
I rely on Amplitude analytics and Figma Make to turn real user insights into high-fidelity prototypes in hours, not weeks. This pairing compresses our continuous discovery loop and helps my team prioritize what truly moves the needle for customers and the business.
Design smarter with Amplitude and Figma Make. Use AI and product analytics together to prototype, test, and learn faster.
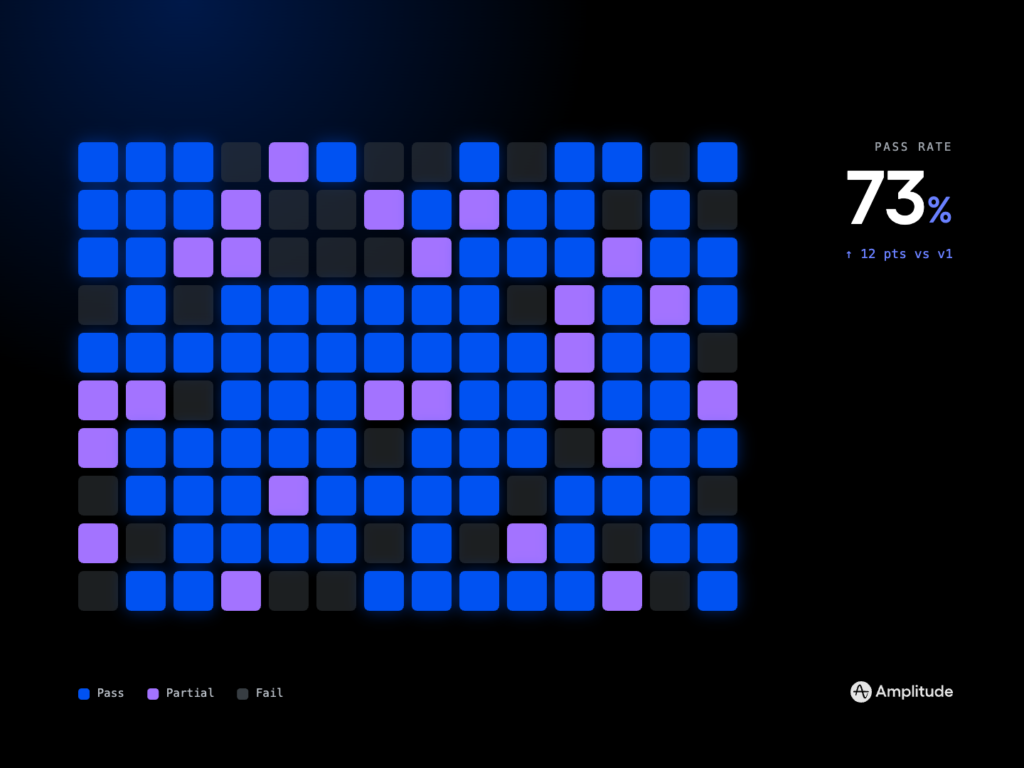
Here’s how I put that into practice: I start with product analytics to isolate a measurable opportunity—often around user activation, conversion drop‑offs, or retention analysis. Amplitude cohorts and funnels surface where friction hides; I translate those signals into design prompts and flows in Figma Make, so we can visualize and validate potential solutions before a single line of production code is written.
Once a promising direction emerges, I convene the product trio—design, engineering, and product—around a clear outcome metric, not output. We build a lightweight driver tree, align on a hypothesis, and define the minimum detectable effect (MDE) so our A/B testing has enough statistical power to be decision‑worthy. From there, we create a small set of Figma Make variations that reflect distinct value hypotheses, not cosmetic tweaks.
On the experimentation front, I gate risky changes behind feature flags and ship via our CI/CD pipeline to limit blast radius and accelerate feedback. I monitor the experiment with a unified analytics platform mindset: the same definitions and segments in Amplitude power both pre‑launch discovery and post‑launch evaluation. That continuity lets us compare prototype expectations against production reality with far fewer translation errors.
A few principles keep this workflow sharp and responsible: I use privacy-by-design patterns, apply data governance guardrails to keep datasets consent‑aligned, and set AI risk management standards so generated designs respect accessibility and brand constraints. Critically, I avoid vanity metrics—I measure learning speed, decision quality, and downstream impact on activation or retention, which are what sustain product-led growth.
If you’re looking for a playbook, try this cadence: 1) define the customer outcome and success metric; 2) map a simple driver tree to narrow the solution space; 3) explore multiple flows in Figma Make; 4) validate quickly with concept tests and usability checks; 5) run A/B testing with a clearly defined MDE; 6) ship iteratively behind feature flags; 7) close the loop in Amplitude with cohort‑level retention analysis; 8) refine copy and UX writing to reinforce the core value proposition. Repeat until the signal is undeniable.
Blending Amplitude analytics with Figma Make has become my fastest path from insight to impact. It keeps my team focused on learning that compounds, features that matter, and outcomes customers can feel—so we truly make what matters.
Inspired by this post on Amplitude – Best Practices.


Leave a Reply