A successful product can create momentum, but durable leadership determines whether that momentum becomes an enduring company or platform. The distinction is especially important for infrastructure businesses, where trust, scalability, and operating discipline must keep pace with adoption.
Taken together, the two source articles suggest a practical leadership test: can an organization preserve customer value while strengthening the strategy, governance, and systems surrounding the product?
Product strength can conceal organizational weakness
Why Great Products Can Still Fail argues that product excellence is necessary but insufficient for company health. A compelling product may temporarily mask unclear strategy, weak accountability, poor tradeoffs, or an operating culture that values output more than outcomes. Adoption and market opportunity do not automatically prove that the organization can make sound decisions as it grows.
This changes the leadership question. The issue is not simply whether teams can ship something customers value, but whether the company can repeatedly direct talent and capital toward the right problems. Product discovery, stakeholder management, roadmapping, and sprint planning become parts of a governance system: they connect customer evidence to decisions and expose assumptions before those assumptions harden into costly commitments.
The article also emphasizes ethical decision-making and corporate governance. That perspective broadens product leadership beyond roadmap ownership. Leaders remain responsible for the organizational conditions under which a successful product is developed, sold, and extended.
Durable platforms reduce uncertainty at every stage
The Supabase article approaches durability through a developer-platform case study. It reports that Supabase started with an open-source PostgreSQL proposition intended to combine rapid application development with an architecture developers would not have to abandon as their needs became more serious. In that account, the platform’s value rests on fast setup, predictable building blocks, reliable documentation, sensible defaults, and a credible path to scale.
Those qualities reveal a broader platform principle: durability is not the same as having the largest feature set. A durable platform lowers uncertainty. It helps customers understand what they are adopting, begin using it without unnecessary friction, and remain confident that early speed will not create an architectural trap later.
The source attributes part of that confidence to Supabase’s alignment with PostgreSQL and its open-source approach. Community trust and commercial growth are presented as mutually reinforcing rather than competing motions. This complements the governance argument from the first article: trust is created when a company’s operating choices support the product promise, not merely when its marketing states that promise.
Leadership durability comes from connected operating loops
The Supabase account reports that founder Paul Copplestone’s earlier startup experiences contributed to an emphasis on finding product-market fit before blitzscaling and on separating fundraising from building. It also describes the company as operating with a constraint mindset even after raising capital. Read alongside the warning that strong products can disguise structural problems, the lesson is that available resources should not be mistaken for validated demand or organizational readiness.
Positioning forms another operating loop. According to the Supabase article, a tagline change preceded the project reaching the top position on Hacker News and was treated as an early product-market-fit signal. The useful interpretation is not that wording alone establishes fit. It is that positioning can test whether the market recognizes the job a product performs. When the message and the customer problem align, feedback becomes clearer and acquisition friction may fall.
Measurement must then distinguish genuine contribution from inherited momentum. The source reports that Supabase designed sales compensation around incremental uplift over a control group. In a product-led business, that approach asks whether sales created conversion or expansion beyond what self-service adoption would probably have generated. It places evidence above activity and limits the temptation to claim credit for demand already produced by the product.
Organizational learning completes the system. The article describes a fully distributed, asynchronous team with near-zero attrition and connects its scaling philosophy to kaizen, or continuous improvement. Because these are claims from a single company-focused account rather than independently verified comparisons, they should be treated as reported characteristics. Their leadership relevance is still clear: asynchronous execution depends on strong writing and explicit ownership, while continuous improvement requires teams to identify and remove recurring friction.
AI readiness should amplify a durable foundation
The Supabase article reports three AI-related waves involving pgvector, Bolt and Lovable, and Claude Code. It presents these developments as successive ways in which retrieval, rapid application creation, and AI-native development workflows increased the relevance of an existing backend platform.
The sequence matters because it separates readiness from trend chasing. The reported AI opportunities could compound platform value because the underlying customer need already existed: developers wanted to build quickly on a backend they could trust. AI changed workflows and urgency, but it did not replace the platform’s core value proposition.
For leadership teams, this implies a disciplined filter for emerging technology. A new capability deserves investment when it strengthens an established customer job, improves the platform’s trusted primitives, or opens a coherent path for existing users. Technology excitement alone cannot resolve weak positioning, unclear ownership, or an unproven operating model.
Key takeaways
Treat product success as evidence, not immunity. Adoption does not eliminate the need for governance, ethical judgment, and explicit accountability.
Design platforms around customer confidence. Fast onboarding, dependable primitives, clear documentation, and a credible scaling path matter together.
Preserve constraints after capital or demand arrives. Resources should follow validated customer value rather than substitute for it.
Measure incremental impact. Product-led and sales-led motions need a method for separating created lift from revenue that would have occurred anyway.
Use AI to extend a durable value proposition. Emerging workflows are most useful when they compound an existing platform advantage.
Durable leadership is ultimately visible in what happens after early success: whether the organization converts attention into learning, learning into disciplined choices, and those choices into a platform customers can continue to trust.
I’ve led and rescued more analytics migrations than I can count, and I know the pressure: every event, dashboard, and decision pipeline depends on getting it right. Migrating analytics platforms doesn't have to be painful. Get seven lessons from Human37 and Amplitude to help your team plan, migrate, and land cleanly.
Here’s how I approach this work so teams keep momentum, regain trust in their numbers, and accelerate product-led growth on a unified analytics platform—without the rework and stakeholder fatigue that typically follow.
Lesson 1 — Start with outcomes, not events. Before moving a single event, I align leaders on the questions we must answer and the decisions we must speed up: activation, retention, and expansion. I map those goals to a simple driver tree, then back into the behavioral analytics we need. This trims noise, tightens scope, and ensures Amplitude analytics (or any destination) is instrumented for decisions, not vanity metrics.
Lesson 2 — Audit and map your data with rigor. I inventory current events, properties, IDs, and sources, then define a target schema with clear naming conventions, ownership, and versioning. Data governance and privacy-by-design are non-negotiable: we separate PII, document consent paths, and remove legacy debris. This step prevents schema drift and makes platform scalability sustainable.
Lesson 3 — De-risk the cutover with a phased plan. Rather than a big-bang switch, I dual-run critical flows, compare telemetry, and use feature flags to roll forward (and back) safely. Observability and anomaly detection are my guardrails: I monitor volume, cardinality, and event timeliness to spot regressions early—long before executives notice broken charts.
Lesson 4 — Treat instrumentation like product code. I wire schema checks into CI/CD, enforce typed analytics wrappers, and validate payloads pre-merge. With docs-as-code, the tracking plan stays current and reviewable. This keeps quality high at scale and avoids the slow death of broken funnels caused by well-meaning quick fixes.
Lesson 5 — Enable the people, not just the platform. Tools don’t create insight—teams do. I run hands-on enablement with product tours and in-app guides tailored to each role, establish communities of practice, and publish short playbooks for common questions (activation analysis, cohort retention, and journey mapping). When customer success and growth marketers can self-serve, adoption sticks.
Lesson 6 — Land cleanly with fast, visible wins. Within the first two weeks post-cutover, I showcase analyses that matter: retention analysis by use-case, friction points via session replay and heatmaps, and conversion lift by segment. These quick proofs build confidence, reinforce the value proposition, and keep stakeholders engaged through the longer tail of hardening.
Lesson 7 — Govern and evolve continuously. After go-live, I schedule schema reviews, backlog grooming, and QBRs to prune events and refine definitions. Ownership is explicit, and changes flow through the same review process as code. This keeps the unified analytics platform trustworthy as the product (and org) changes.
I’ve seen this playbook turn skepticism into momentum. In one migration I inherited mid-flight, we refocused on decisions, tightened governance, and phased the rollout; the team moved from fire drills to confident launches—and stakeholders finally believed the numbers again.
If your team is staring down a migration, anchor on outcomes, automate quality, and invest in enablement. With disciplined execution readiness and the lessons I’ve applied alongside partners like Human37 and platforms like Amplitude, you can move fast, reduce risk, and land cleanly—without the chaos.
Inspired by this post on Amplitude – Perspectives.
I’ve watched the rise of product engineering up close, and it’s reshaping how we build software. The old model of rigid handoffs and separate functions is giving way to small, empowered product teams where engineers own the customer problem end to end. That shift isn’t just cultural—it’s a performance advantage that compounds with every release.
I often summarize it this way: “Product engineers are taking over. They ship code, talk to users, and own outcomes—no handoff required. Here’s what the role is, and why it matters now.”
When I say “product engineer,” I’m describing a builder who goes beyond writing code. I expect them to partner in product trios with product management and design, participate in continuous discovery, and make decisions grounded in product strategy and real customer insight. They don’t toss features over a wall; they own the problem, the solution, and the measurable outcome.
Why now? Modern delivery practices like CI/CD and feature flags compress feedback loops, while behavioral analytics and session replay make customer friction visible in real time. As expectations rise for quick iterations and clear value, teams that reduce handoffs and align around outcomes outperform on DORA metrics such as deployment frequency and lead time for changes.
Day to day, a strong product engineer blends discovery and delivery. They join customer interviews, review support tickets, analyze usage patterns, and run A/B testing to validate hypotheses. Then they ship code in small, safe increments, instrument telemetry, and watch adoption and retention signals to confirm they’re moving the numbers that matter.
Team shape matters. I favor compact, cross-functional squads anchored by product trios, each with explicit outcomes vs output OKRs. Product engineers often operate like forward deployed engineers, partnering with customer success and solutions engineering to learn at the edge of real-world usage. This proximity to customers turns ambiguity into insight—and insight into product leverage.
Accountability is concrete. We track DORA metrics for delivery health and pair them with product outcomes such as activation, time-to-value, and Net Recurring Revenue (NRR) drivers. The combination keeps us honest about both how fast we move and whether what we ship truly works for customers.
The hiring profile is distinct. I look for engineers who are curious about the “why,” comfortable with trade-offs, and energized by customer conversations. They can navigate architectural complexity, but they also translate user feedback into crisp product bets. Many grow into natural facilitators of discovery rituals and developer evangelism across the organization.
If you’re getting started, pilot a single squad. Establish clear outcomes vs output OKRs, invest in CI/CD and feature flags, and commit to continuous discovery with weekly customer interviews. Give the team ownership of a KPI tied to product strategy, and measure progress with DORA metrics plus usage and retention signals. The early wins—fewer handoffs, faster learning, tighter feedback loops—build momentum quickly.
In short, product engineers thrive where accountability, autonomy, and user empathy meet. They reduce wasteful coordination, shorten the path from insight to impact, and ensure we ship code that customers actually adopt. That’s why this role is reshaping how software gets built—and why the teams that embrace it will set the pace for everyone else.
An AI agent becomes operationally valuable when it can move beyond explaining a process and complete the underlying work. That same transition gives the agent access to sensitive data and consequential actions, so integration must be designed as both a product capability and a security boundary.
The practical objective is not maximum access. It is the smallest dependable set of permissions that lets an agent resolve a well-defined workflow, supported by deterministic controls, observable outcomes, and a clear path to human intervention.
System access changes both the value and the risk
Without backend access, an agent can describe how to update an account, check a renewal, or report a damaged order. With access to a CRM, billing platform, or order-management system, it can potentially retrieve the relevant record and complete the request during the conversation. The Intercom article presents this shift from answering to acting as a central difference between basic AI adoption and mature deployment.
The article cites Intercom’s 2026 Customer Service Transformation Report, reporting improved metrics among 87% of teams with mature AI deployments, compared with 62% overall. It also reports that 82% of senior leaders said their teams had invested in AI during the preceding year, while only 10% said they had reached mature deployment. These source-reported figures suggest an integration gap, but they do not independently establish that system access caused the reported improvements or that an integration is secure.
Security therefore cannot be added after the workflow succeeds. A customer-facing interface may remove the need to visit a separate application, but it must not remove identity and authorization checks. The agent still needs a trustworthy way to associate the request with the correct customer, determine what that customer is permitted to do, and constrain the backend operation accordingly.
Choose workflows where access justifies its complexity
Not every automated conversation benefits equally from deeper integration. Intercom reports the results of rebuilding four fixed, scripted Tasks as Procedures with system access. Over the 12 months through May 2026, the reported resolution rate for its bounce-list workflow rose from 9.3% to 79.9%, while bug reporting increased from 9.2% to 66.5%. Email forwarding moved from 44.9% to 66.5%, but Messenger installation rose only from 67% to 69.2%.
The variation is more instructive than the headline gains. According to the article, the bounce-list process required multi-step reasoning, dynamic branches, and error recovery. Bug reporting still ended in a human handoff, but the procedure improved that handoff by pre-triaging the issue, surfacing possible GitHub matches, extracting relevant URLs, and requesting impersonation access. Messenger installation was already a comparatively linear process, leaving less room for improvement.
A suitable first integration is therefore not merely a popular support topic. It should be high-volume and repeatable, have an identifiable system owner, and depend on live data or actions that materially change the outcome. Existing APIs improve feasibility, but the security review should also consider data sensitivity, reversibility, authorization complexity, and the consequences of acting on an ambiguous request.
Use an access ladder instead of a single launch
The phased approach described by Intercom can also serve as a security model. Each stage expands capability only after the workflow and its controls have produced enough evidence to justify the next step.
Stage
Agent capability
Appropriate use
Control emphasis
No integration
Guide, troubleshoot, check policy, triage, and route
Discover where explanations repeatedly lead to manual work
Evaluate answer quality, routing accuracy, and escalation behavior
Read-only access
Retrieve approved fields such as order or subscription status
Resolve information requests without changing a record
Restrict endpoints, records, and fields; verify customer authorization
Write access
Update records or initiate actions such as cancellations or refunds
Complete bounded workflows after earlier stages are dependable
Validate inputs, limit action scope, record outcomes, and require approval where consequences warrant it
Mock responses can test branching logic before an API is ready, as the Intercom article notes. It also proposes a temporary human-in-the-loop step when an integration is still several engineering sprints away. These methods can validate the workflow and expose missing requirements, but simulated success should not be treated as proof that production identity, authorization, failure recovery, and audit controls are ready.
Put deterministic controls around probabilistic decisions
Plain-language workflow instructions can guide an agent, but security-critical constraints should not depend solely on the model interpreting those instructions correctly. A safer architecture places enforceable controls between the agent and each backend system.
Control
Practical design implication
Dedicated identity
Give the agent its own service identity rather than borrowing a staff account, so permissions and activity remain attributable.
Least privilege
Allow only the endpoints, operations, records, and fields required by the selected workflow.
Read and write separation
Keep retrieval permissions distinct from mutation permissions and grant write access only when the use case requires it.
Independent policy enforcement
Validate identity, authorization, limits, and required inputs outside the model before executing an operation.
Bounded actions
Prefer narrow, purpose-built operations over unrestricted database or administrative access.
Human approval and escalation
Route ambiguous, exceptional, sensitive, or difficult-to-reverse cases to an authorized person.
Auditability and monitoring
Record the request, decision, tool call, result, and escalation so failures and unusual patterns can be investigated.
Safe failure behavior
Prevent retries, timeouts, or partial completion from producing duplicated or inconsistent changes.
The integration request should document the workflow in plain language, identify every read and write point, name the system owner, and specify the minimum required fields. It should also define how success and harm will be measured: not only whether the agent completed the conversation, but whether it selected the correct record, performed the authorized action once, protected restricted data, and escalated when it lacked sufficient confidence or permission.
This framing also improves the business case. Engineering is being asked to expose a narrowly scoped capability with explicit boundaries, rather than to provide broad access to a general-purpose agent. Leadership can then compare measurable workflow value with implementation effort and residual risk.
Key takeaways
System access creates value when it lets an agent complete work, but it simultaneously expands the security boundary.
The best initial workflow is frequent, bounded, operationally meaningful, and owned by a team that can approve its data and actions.
Progress from no integration to read-only retrieval and then to narrowly scoped write operations; do not treat access as an all-or-nothing decision.
Enforce identity, authorization, field restrictions, action limits, and audit logging outside the model’s natural-language instructions.
The strongest long-term pattern is a portfolio of small, governed capabilities rather than one broadly privileged agent. Each successful workflow can supply the evidence needed to extend access deliberately, while keeping the consequences of error visible and contained.
Package supply chain security is not simply a matter of choosing reputable libraries. The practical challenge is controlling an expanding dependency graph, the code that executes during installation, the resources that installed software can reach, and the automated tools allowed to make those decisions.
A useful defensive model follows the path an attack must take: enter through a package or dependency, execute in the development environment, discover valuable information, and transmit it elsewhere. Organizing safeguards around that sequence produces a stronger posture than relying on any single scanner, sandbox, or package reputation signal.
Package risk grows through the dependency graph
Developers usually evaluate the packages they select directly. The less visible risk lies in transitive dependencies: packages installed because another dependency requires them. The source article illustrates the scale of this effect by reporting that installing Jest brought in 266 packages. That example is not evidence that those dependencies were malicious; it shows how one deliberate choice can create hundreds of additional trust relationships.
This changes the unit of review. The relevant question is not only whether a named package appears legitimate, but whether its complete dependency graph is proportionate to the job. A small utility that introduces unfamiliar native modules, unrelated capabilities, or an unexpectedly broad tree deserves more scrutiny than its simple interface might suggest.
Manifests such as package.json, pyproject.toml, and requirements.txt make dependency installation repeatable. Repeatability alone, however, does not guarantee safety. If version ranges or unresolved transitive dependencies allow later releases to enter automatically, two installations based on the same manifest can produce different risk profiles. Pinning direct and transitive versions converts an evolving external graph into a more deliberate, reviewable input.
Match defenses to the stages of a package attack
The source article says an analysis covering more than 230,000 malicious-code incidents found a recurring pattern: malicious code first needs an entry point, then searches the device for sensitive data, and finally uses a network connection to exfiltrate what it finds. This reported pattern suggests three distinct control points.
Reduce risky entry and automatic execution
A waiting period for newly published packages can reduce exposure to releases that have not yet attracted community scrutiny. The article recommends installing only packages that are at least seven days old. That is a risk filter, not a guarantee: an older malicious package can remain undetected, while a legitimate urgent fix may occasionally justify an exception.
Installation scripts require separate treatment because they may execute before a developer has inspected the installed code. Disabling automatic install hooks by default creates a decision point. A package that depends on a post-install action can still be used, but the script, its purpose, and the capabilities it invokes should be reviewed first.
Constrain access after installation
Pre-install review cannot catch every problem. The next layer limits what package code can inspect or modify if it does execute. Sandboxed folders and isolated development environments can reduce the blast radius, but the source cautions that isolation by itself does not prevent malicious code from entering. Access boundaries therefore complement package controls rather than replace them.
Limit unnecessary network egress
Stolen information has less value to an attacker if malicious code cannot transmit it. Restricting unnecessary outbound connectivity addresses the final stage of the reported pattern. This layer matters because a package may evade provenance review and execute inside an environment despite earlier controls. Entry controls, resource boundaries, and egress restrictions together create independent opportunities to interrupt the attack.
Provenance is a decision process, not a trust badge
No single popularity or identity signal proves that a release is safe. The source proposes evaluating maintainer history, download patterns, repository activity, signed releases, and consistency across registries. Their value comes from comparison: a sudden change in maintainership, an unusual release pattern, or a mismatch between repository and registry information may warrant investigation even when each signal looks plausible in isolation.
Context also matters. Dependency behavior should be compared with the package’s stated purpose. A capability that is normal for a database driver may be difficult to justify in a formatting utility. This purpose-to-capability test helps teams focus limited review time on anomalies rather than treating every dependency as equally suspicious.
These checks work best when they lead to a clear disposition: approve the package and lock the reviewed version, replace it with a narrower dependency, inspect it more deeply, or decline it. Provenance information without a decision rule can become documentation that does not change behavior.
AI coding agents must inherit the same installation policy
AI-assisted development introduces a governance problem as much as a technical one. A coding agent may be able to select and install a package while pursuing a larger task, compressing several human decisions into one automated action. If it can also reach broad areas of the file system and use the network, a malicious dependency may encounter a larger potential blast radius.
The source describes workflows in which Claude searches, creates, and edits files across a broad knowledge system, including notes derived from downloaded PDFs. That breadth provides productivity value, but it also makes one-folder isolation impractical for the reported workflow. The proposed response is disciplined configuration: hooks require the agent to follow the same package-age, install-script, provenance, and dependency rules expected of a human developer.
This principle is more durable than a rule tied to one assistant. Package policy should apply consistently whether an installation is initiated by a developer, an AI agent, a local automation script, or a build process. The initiator may change; the acceptable evidence, permissions, and exceptions should not.
Key takeaways
Review the full dependency graph, because the packages selected directly represent only part of the installed attack surface.
Use a waiting period for new releases as one filter, while preserving a documented path for justified exceptions.
Prevent install scripts from running automatically until their purpose and behavior have been examined.
Combine provenance checks with a purpose-to-capability test and an explicit approve, investigate, replace, or reject decision.
Pin direct and transitive versions, then run recurring audits to detect issues discovered after installation.
Apply the same package rules to coding agents, automation, local development, and build environments.
Layer installation controls, resource constraints, and network egress limits so that one missed signal does not determine the outcome.
A mature package security posture will increasingly depend on making these controls routine and machine-enforceable. As development becomes more automated, the teams best positioned to move quickly will be those that turn package trust from an informal judgment into a consistent operating policy.
I love being a builder. It feels like a superpower I can’t stop using, and lately I’ve been channeling it into better workflows, faster experimentation, and sharper product thinking.
I tinker with my Claude Code workflows to make every day more effortless. I’m having a blast creating AI-generated interview snapshots and opportunity solution trees for Vistaly. I also spend time digging into traces and iterating on the AI coaches I use for our discovery courses.
Then the recent wave of malicious software spreading through the open-source community popped my bubble. It hit companies big and small—names like OpenAI, PostHog, and Zapier. As I dug in, I realized what many cybersecurity experts have long known: this is a deep rabbit hole. If I want to build responsibly, I have to get significantly better at protecting my devices, credentials, and code. And if you’re building with AI or modern tooling, you likely do, too.
Here’s why. We all rely on open-source software. Most modern applications assemble tried-and-true components—parsing a PDF, handling dates across time zones, visualizing spreadsheet data, connecting to an API—rather than reinventing them. The same is true for agent skills and MCP servers; they accelerate how we get value from models. This is overwhelmingly a good thing. But it also creates an attack surface that bad actors exploit.
We don’t need to abandon third-party code. We do need to understand the mechanisms attackers use and consistently defend against them.
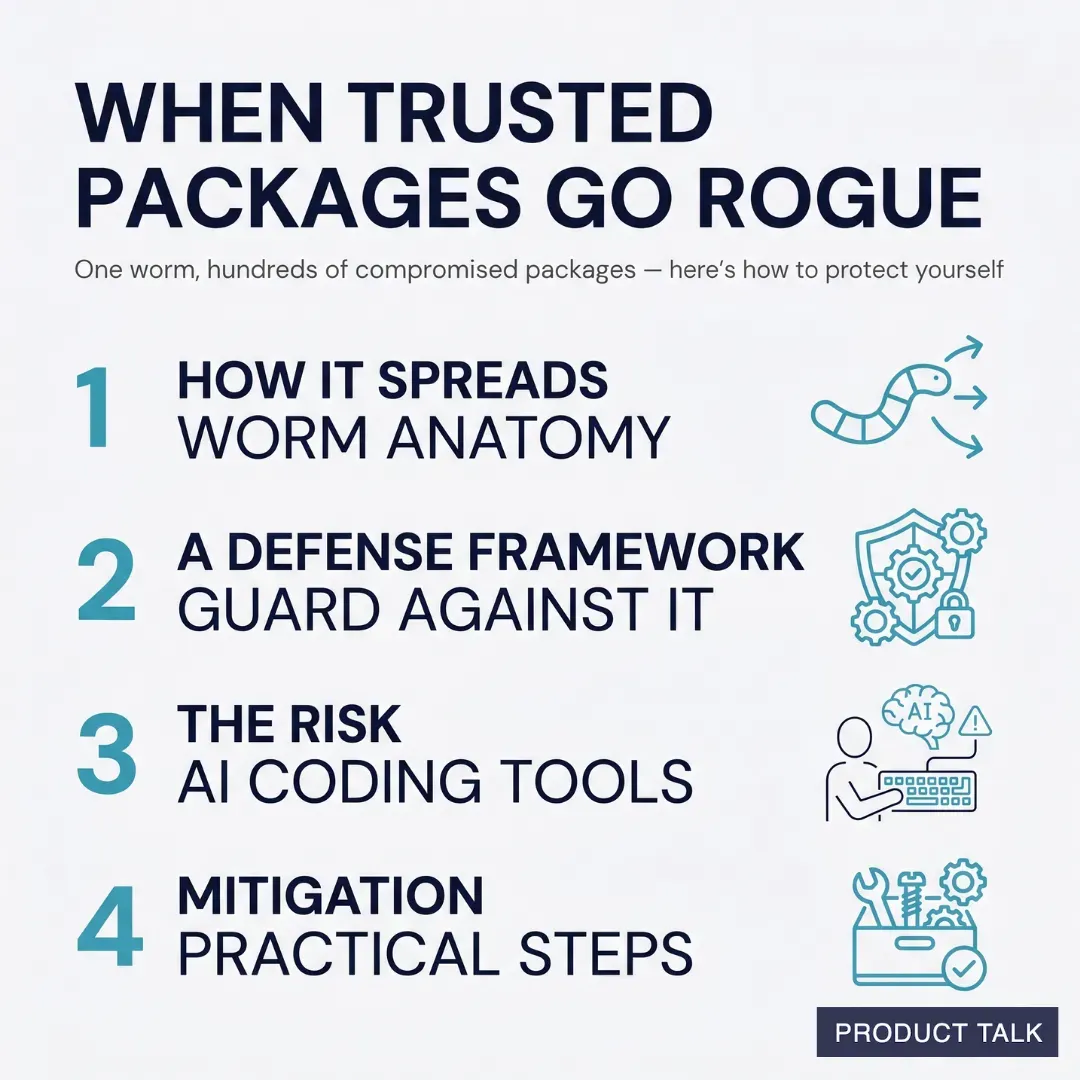
When one malicious worm compromises hundreds of packages, what should dev teams do? This visual teaser maps the agenda—how it spreads, how to guard against it, AI tool risks, and concrete steps to mitigate.
On May 11th, I started seeing tweets about a TanStack hack. At that time, I didn’t know what TanStack was. But apparently, it’s a popular set of JavaScript libraries that are used by a lot of React sites. At first, I didn’t pay much attention. Then I learned the packages were compromised by a worm—malicious software that self-replicates—and it spread quickly. Within hours, dozens of packages were implicated; by day’s end, it was in the hundreds. That’s when I knew I had to lean in.
If you’ve explored safe development practices with coding agents before, you’ve seen the basics of package safety. A package is a bundle of reusable code shared through registries, and nearly every app you use depends on them. The unfortunate twist with this specific hack, known as the Mini Shai-Hulud worm, is that it shows prior “safe enough” heuristics aren’t sufficient. Popularity and trust signals don’t guarantee safety. We have to do more.
So here’s what I’ll cover today: how malicious software typically works, a practical framework for guarding against it, the specific risks of using Cowork to write and run code, and concrete steps to mitigate that risk. My goal is simple: help you keep building—despite the risks—while protecting your data and your business.
Quick disclaimer: I’m not a security expert. I’m sharing my personal journey and what I’ve learned through research and hands-on work. Please use your best judgment when applying any of this.
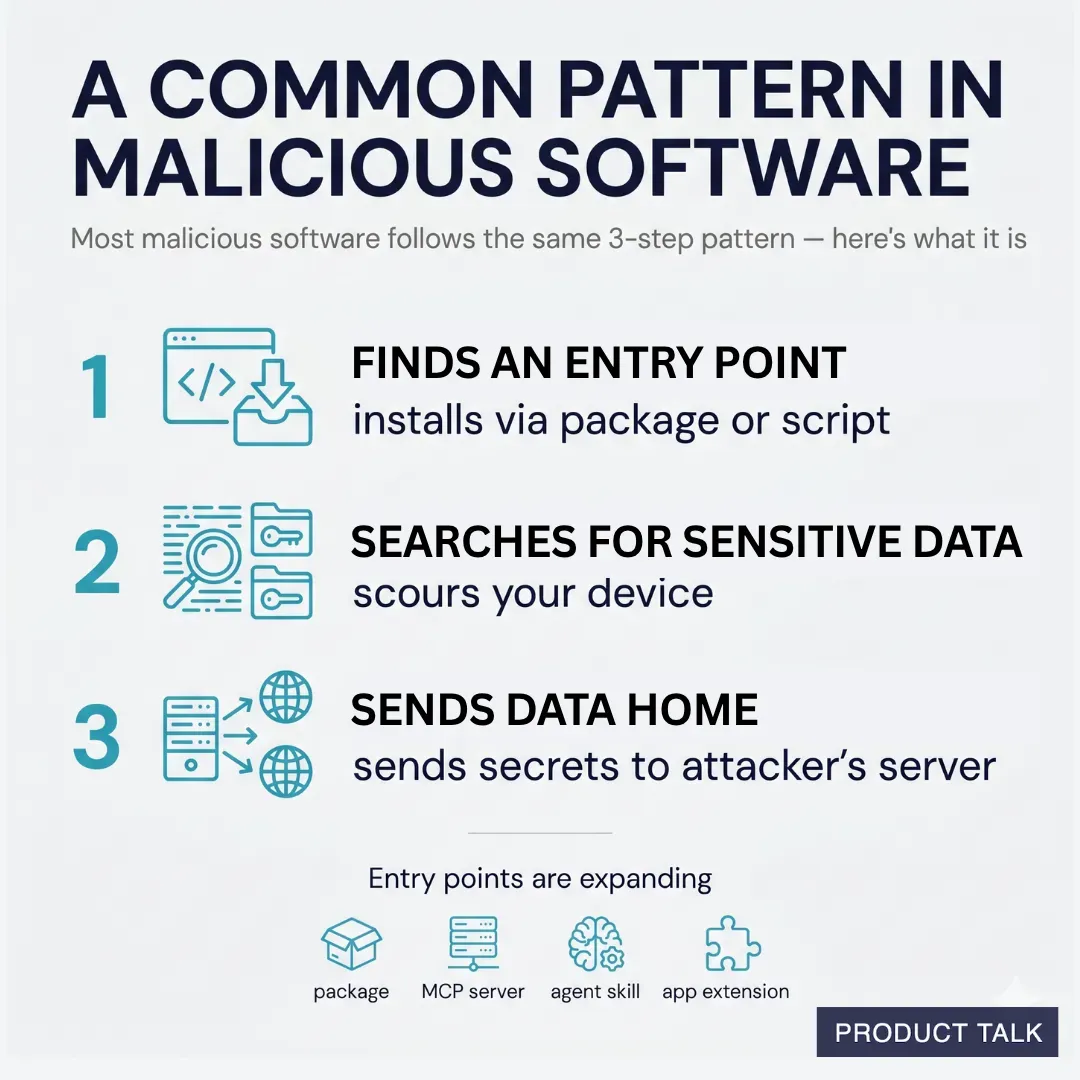
Package hacks share a simple playbook: get in, sweep for secrets, and phone home. This visual breaks down the 3 steps and flags new entry points—from packages to MCP servers, agent skills, and app extensions.
An agent recently scoured over 230,000 malicious software incidents and found that most malicious software follows a similar pattern. First, it needs an entry point onto your computer. Once installed, it scours your device for sensitive data, and then it uses your network connection to send that data to its own servers. The Mini Shai-Hulud worm spreads via malicious package install scripts that run at download time, then searches the device for credentials (including package publishing rights), poisons additional packages to continue replicating, and uses multiple channels—including the victim’s own GitHub public repos—to distribute secrets.
In practice, most attacks boil down to three steps: 1) It finds an entry point to your device. 2) It searches your device for sensitive data. 3) It sends that data to its own server. The good news: this pattern also tells us how to defend. We can harden entry points, minimize what code and agents can access, and constrain outgoing network traffic.
Keep in mind that install scripts aren’t the only entry vector. Any code that runs on your machine could contain malicious payloads: third-party packages, agent skills, MCP servers, browser or desktop extensions—the list is long. As coding agents and “vibe coding” tools become mainstream, more non-engineers are exposed to the same risks engineers have managed for years.
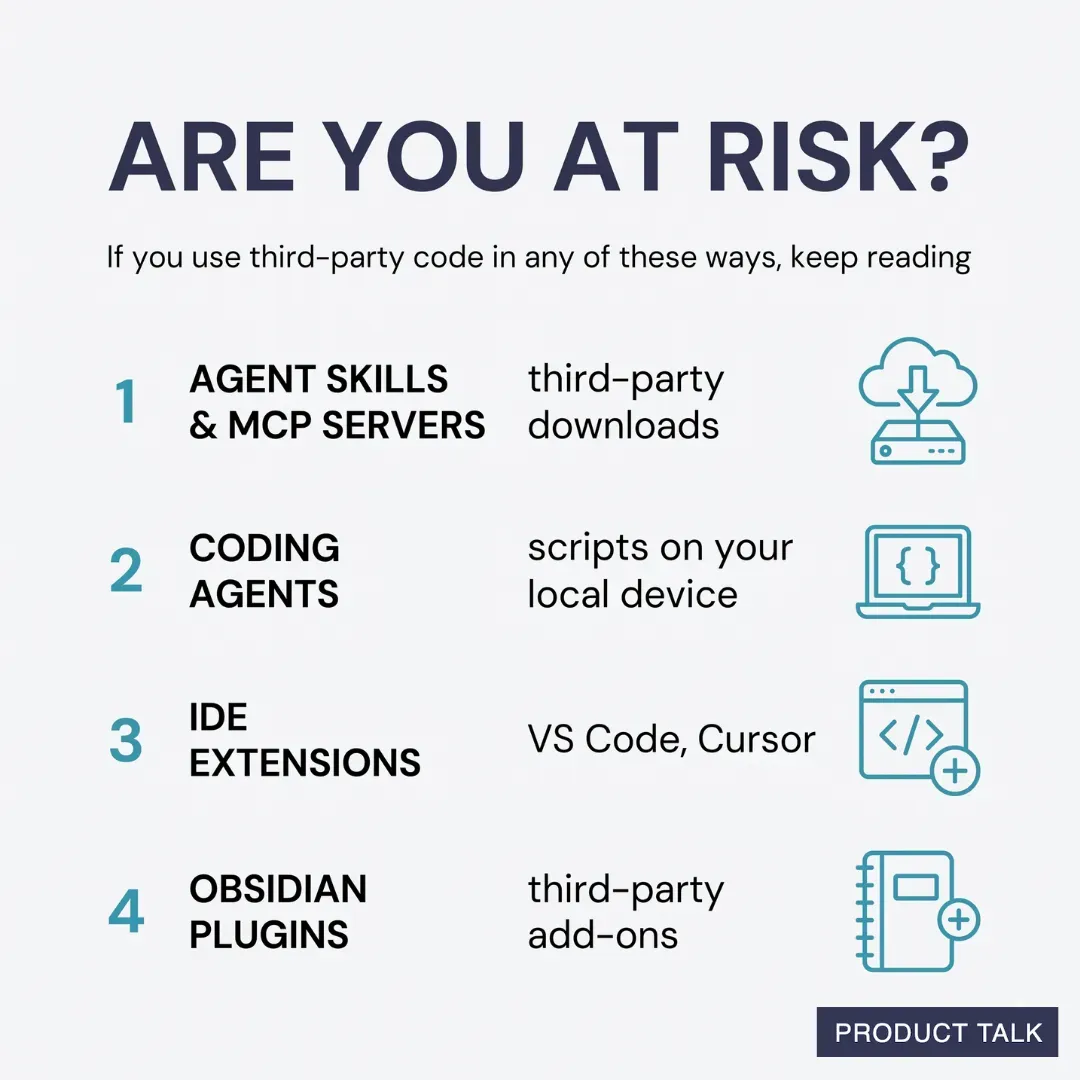
You might be at elevated risk if you do any of the following: you download and use third-party skills or MCP servers; you let Claude Code, Codex, or other coding agents write scripts that run locally and use third-party packages; you use an IDE like VS Code or Cursor with third-party extensions; or you install third-party extensions in tools like Obsidian. This isn’t an exhaustive list, but if any of these apply, it’s worth tightening your approach.
Relying on third-party code? This visual highlights four common risk zones—agent skills/MCP servers, coding agents, IDE extensions, and Obsidian plugins—and urges a review of downloads, local scripts, and add-ons.
The “safest” approach would be to avoid installing third-party software on your local device entirely. That’s not realistic. We all depend on third-party components in our stack. So I’ll start with one of the most common paths for non-engineers writing and running code today: Cowork.
Evaluating Cowork’s safety was eye-opening. Cowork offers meaningful protection—more than running code directly on your machine—but it isn’t bulletproof. There’s a notable gap you should understand.
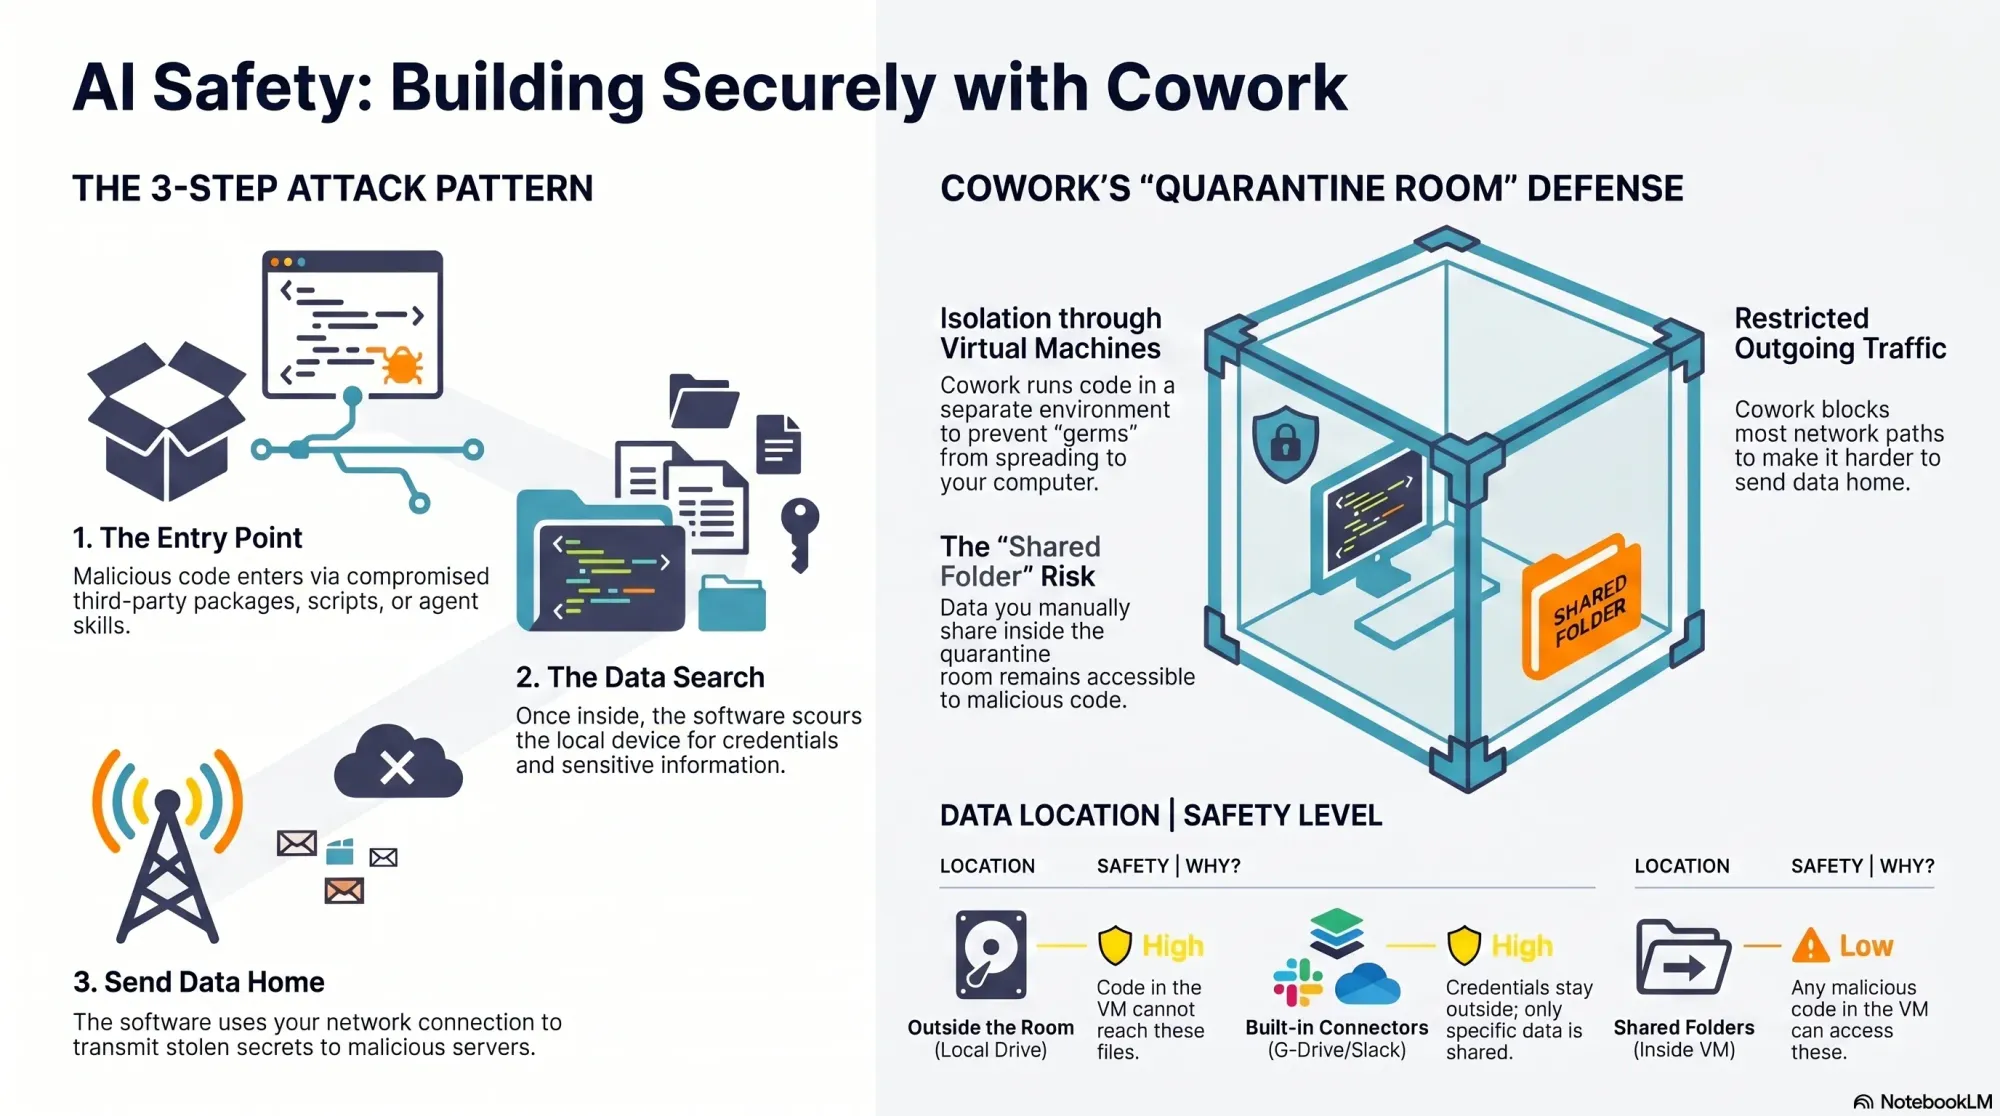
Here’s how Cowork helps. It runs code inside a virtual machine, which isolates the execution environment from your real device—a quarantine room for code. While Cowork doesn’t fully control what comes into the room (that part is on you), if malicious code gets in, it’s contained and cannot reach the rest of your filesystem. Cowork also limits outbound network traffic from the virtual machine, which helps disrupt data exfiltration. However, it’s not foolproof.
Because Claude can install packages inside Cowork, it remains susceptible to malicious code like the Mini Shai-Hulud worm. And GitHub is on the allow list so Cowork can read and write to your repos. Since the Mini Shai-Hulud worm uses GitHub to publish secrets, this creates exposure. The crucial mitigation: if you never give Cowork access to sensitive data, there’s nothing for an attacker to steal.
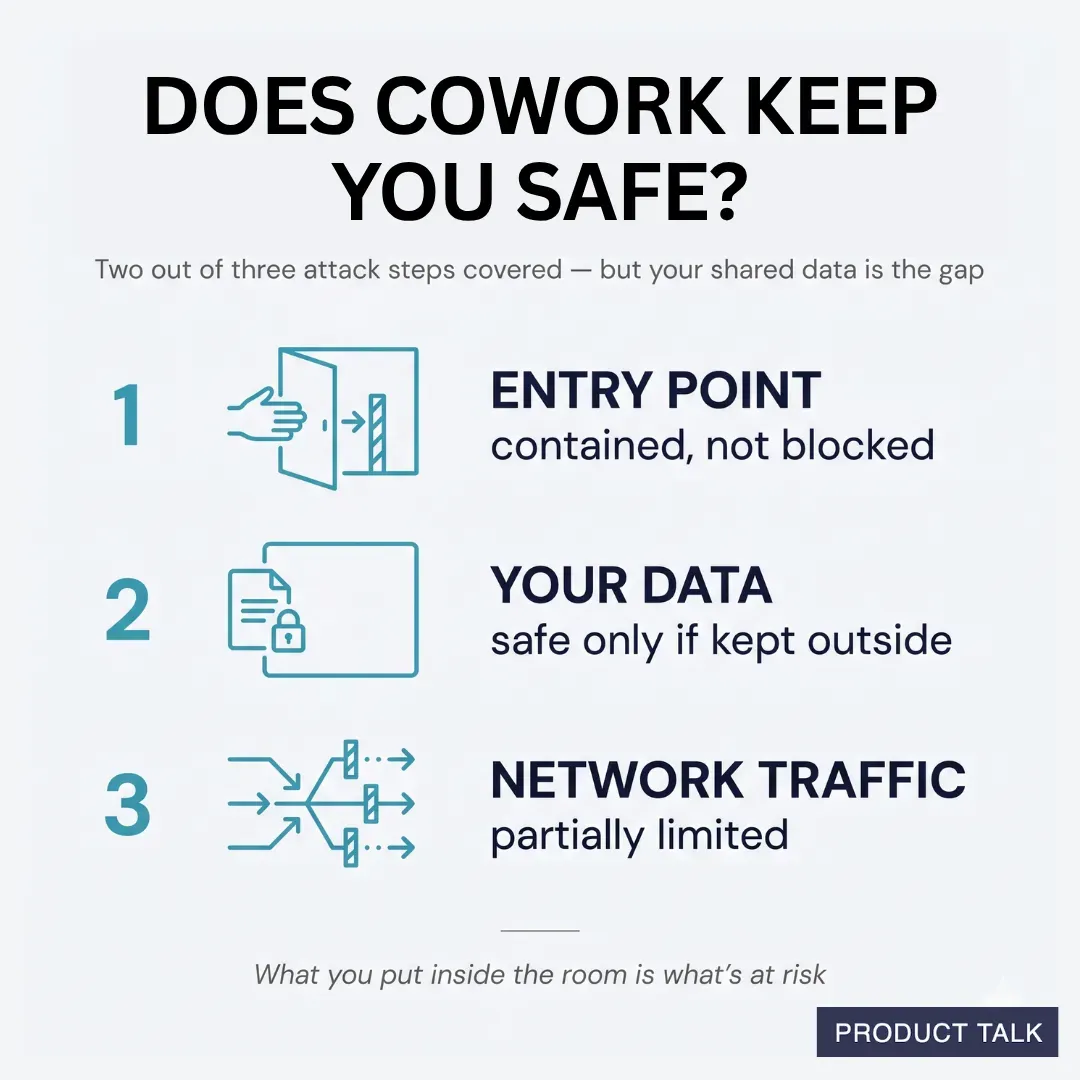
A quick visual from a security deep dive on package hacks shows how Cowork handles threats: entry points are contained, data is only safe when kept outside, and network traffic is partly limited—making shared data the gap to watch.
Your responsibility is straightforward but critical: your data is only safe if it stays outside the virtual machine. When you mount folders into Cowork, those folders become accessible to any code running inside the VM. That includes malicious scripts. Before sharing, ask two questions: do the folders contain any credentials or secrets, and do they include proprietary data that would be harmful if accessed?
It’s common for code to need credentials. That’s why Cowork includes connectors to third-party sources like Google Drive and Slack. Credentials configured for these connectors never enter the VM—they remain outside the quarantine room—so they’re not exposed to malicious code. But if your code requires additional credentials inside the VM, scope them tightly and assume they could be compromised.
You can also use custom MCP servers you create yourself with Cowork. Those credentials stay outside the VM as well, provided the MCP servers are remote (hosted on a web server, not downloaded locally). It’s more work than dropping in a local server, but it keeps secrets out of reach from VM-executed code.
Beyond credentials, scrutinize the actual content you share with Cowork, including anything accessed through connectors. Least privilege is the rule: grant only what’s absolutely necessary for the task, and nothing more.
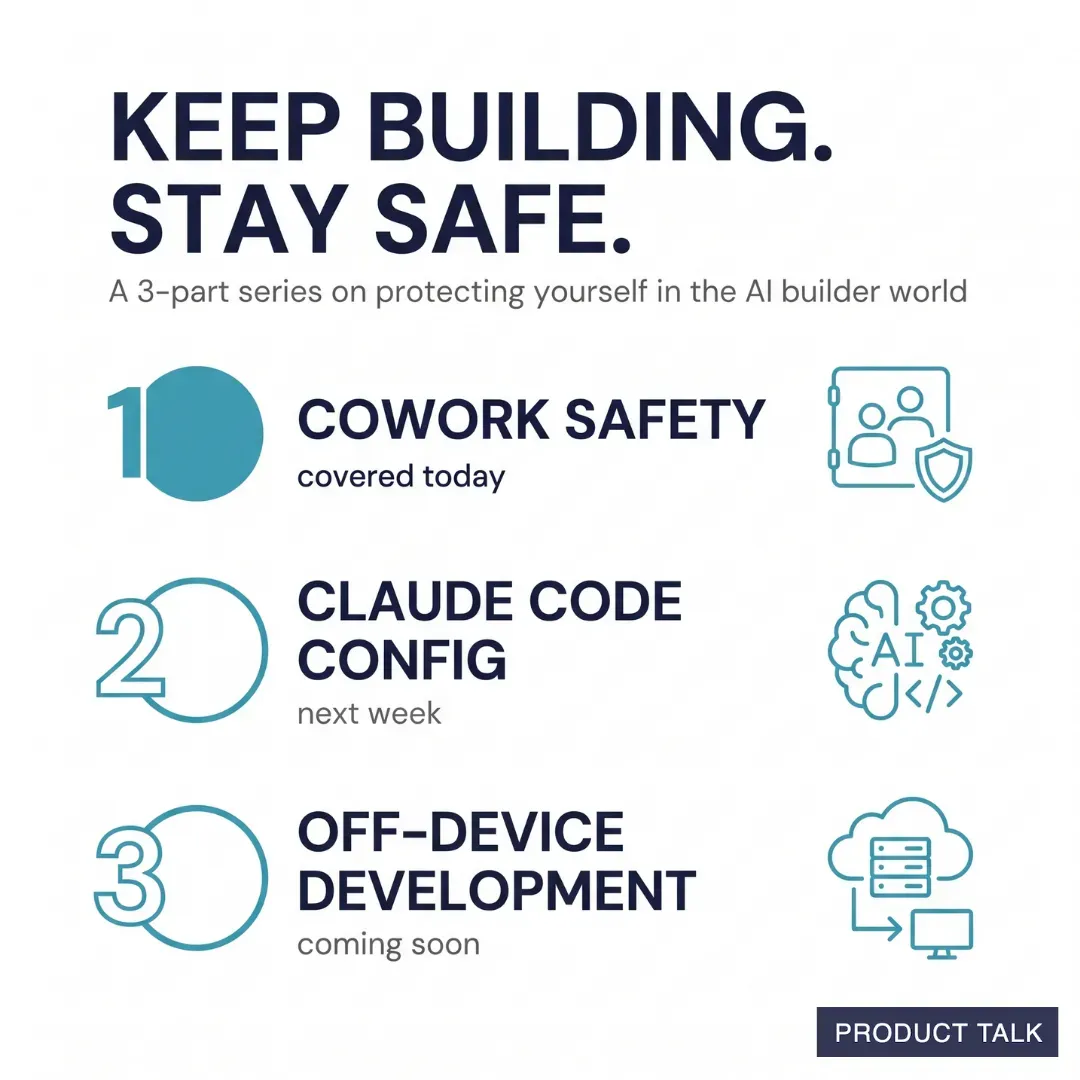
Amid a wave of package-supply attacks, this Product Talk visual launches a 3-part guide to safer AI building—starting with Cowork safety today, then Claude code config next week, and off-device development coming soon.
What about skills? Cowork supports skills, and you can add third-party skills inside the quarantine room. If you’re not placing your own data in that room, you can afford more risk. The moment you add sensitive or proprietary data, be selective. Skills can include third-party code, and bad actors use skill directories to distribute malicious payloads. Personally, I never use third-party skills as-is. If one looks useful, I read through the files, then ask Claude to recreate it so I understand what it does and maintain control. If I were to use third-party skills, I’d do it in Cowork and keep their data access to the minimum necessary.
Overall, Cowork is a solid, “safe-ish” option if you’re disciplined about what you share. The challenge is that utility often requires access to real data—exactly what we’re trying to protect. In an upcoming deep dive, I’ll outline strategies to keep malicious code out in the first place. While I’ll focus on local development, the same patterns can extend to Cowork with a bit of setup.
One more important clarification: don’t confuse Cowork with the Code tab in the Claude Desktop app. Cowork runs code inside a virtual machine. The Code tab does not. If you ask Claude to write and execute code from the Code tab, that code runs on your local device and you’re fully responsible for security. There is one exception: the Code tab can run code in Anthropic’s cloud; I’ll cover that approach when we get into moving development off the local machine.
To summarize Cowork’s protections against the attacker’s three-step pattern: installs and scripts still run, but they’re contained inside an isolated virtual machine instead of your real device; access to sensitive data is strongly limited to the specific folders you mount, leaving the rest of your filesystem (including unrelated credentials) out of reach; data exfiltration is partially constrained because Anthropic limits outbound network traffic from the VM—helpful, but not absolute. By contrast, local Code tab sessions offer no isolation, no filesystem restrictions, and no network limits—so any malicious install scripts run directly on your machine with full access and open egress.
My takeaways so far: I still love building with AI, but I’m doing it more cautiously. Cowork offers meaningful containment when used deliberately. I still prefer the flexibility of Claude Code, and I’ve reconfigured my setup to reduce risk. Even so, “safer” isn’t “safe,” which is why I’m increasingly shifting development off my local device to more controlled environments. I’ll share the practical details—tools, configs, and scripts—in the next installments.
If this perspective is useful, let me know. I want builders to move fast—and safely—through this new era of agentic AI. Until then, stay safe out there.
I’m getting sharper, more specific questions about scale from enterprise customers every quarter, and that’s exactly how it should be. Teams want to know how our platform behaves during their highest-volume moments — the Black Friday sales, the sporting events, the production incidents — and they want confidence their growth won’t outpace the systems they depend on.
We welcome those questions. They’re the right ones to ask of any critical component of your business.
Today, our systems handle serious scale. At daily peak, we see over 150,000 customer requests per second coming into the platform, with more than 70,000 asynchronous requests per second flowing through the background systems. During our busiest days of the week, we handle over five million conversations and more than 100 million comments being added across the platform.
We also design for individual customer spikes, not just aggregate platform traffic. We can handle a single customer workspace spiking with hundreds of comments per second, or around 100 new conversations per second. Sustained over a full day, that would map to millions of conversations from a single customer.
While those numbers matter, they age quickly. Every growing software company can publish a bigger number every year, month, week. What ultimately matters is whether the architecture has clear scaling levers, whether we understand the pressure points in the system, and whether we can add capacity before customers need it.
Every system has limits. Competence is knowing where they are, measuring them, and moving them before customers reach them.
Here’s how we do that in practice.
We build on boring foundations because at the edges, we try hard not to be clever. We use AWS for the infrastructure primitives AWS is very good at running. We do not want our engineers spending their best energy recreating S3, load balancers, queues, or commodity infrastructure patterns. We want that energy spent on the parts of the system that are specific to our customers and our product.
“That is a deliberate trade-off. It gives us fewer systems to understand, deeper expertise in the ones we do run, and more leverage when we need to scale.”
This extends a principle I’ve embraced for years: run less software. The point isn’t to minimize the stack for its own sake; it’s to compound expertise. When many teams build on the same small set of technologies, our tooling, observability, and operational practice all improve together. Boring technology choices aren’t a lack of ambition — they reserve our ambition for the nuanced scaling challenges that matter.
The source of truth is the hard part. You can scale stateless web traffic by adding machines, add queue consumers, and add cache. Those are real problems — just not the hardest ones. The source-of-truth database is where the most important data lives, where the hardest correctness guarantees exist, and where maintenance windows often come from. It has to be correct, fast, resilient to failover, capable of large migrations, and able to keep serving traffic while we improve it. As customers grow, it cannot require a full re-architecture every time the next ceiling appears.
That is why we moved to Vitess, managed by PlanetScale. The goals were clear: improve availability, reduce operational complexity, make large table migrations safer, simplify MySQL scaling, and eliminate customer downtime from routine database maintenance and failovers. When we first laid out this direction, the largest part of the migration was still ahead of us. We completed that migration in 2025, and the benefits are now part of how we operate the platform day to day.
Today, our highest-scale source-of-truth data is spread across 128 shards. The database layer handles around two million requests per second, with more than ten million cache reads per second in front of it. For the largest customers, we can isolate and scale database capacity independently, including dedicating a shard to a single customer when needed.
We have not come close to needing that, which is significant. The goal of architecture like this is not to run every system at the edge of its capacity, but rather to have room to move before customers need it. Vitess gives us native sharding, query routing, online schema change capabilities, connection pooling, and resharding primitives built for this kind of workload. Instead of application code carrying all of the sharding complexity, the database layer can do more of the work. That reduces cognitive load for engineers and removes whole classes of operational risk.
Ultimately, this gives us practical scaling options instead of hard architectural rewrites, and lets us do routine database improvement without planned customer-impacting maintenance windows.
Search is not a hidden bottleneck for us. Search underpins core product surfaces across the platform — from vector search in our AI features to realtime reporting — and if it’s slow or unhealthy, customers feel it. Scaling isn’t just adding more machines; often the better approach is making the product do less unnecessary work. Today, our Elasticsearch clusters support a much higher-throughput product than in the past, with more than 650TB of storage, more than 1.7 trillion documents, and peaks above 40,000 requests per second. We’re serving a larger product surface more efficiently, not just running a bigger cluster.
More importantly, when an index gets too large or traffic distribution turns unhealthy, we don’t want a high-risk, manual migration. We reshape Elasticsearch indexes online by partitioning by customer ID, dual-writing to old and new indexes, backfilling, validating, gradually moving customers with feature flags, and deleting the old index only when we’re confident. We’ve used this pattern for years to make large search migrations safer and more incremental — a core playbook in our platform scalability and SRE practices.
Fairness is non-negotiable in a multi-tenant system. A single customer’s high-volume moment should not quietly become everyone else’s latency problem. We design for this at multiple layers. For asynchronous work, we use overflow queues and queueing strategies that prevent one high-volume workload from consuming shared capacity in a way that hurts quieter tenants. AWS SQS fair queues are one example of a primitive we use extensively. They’re designed for exactly this class of problem. When one tenant creates a backlog in a shared queue, fair queues help reduce the dwell-time impact on other tenants.
We also build application-level guardrails so customer isolation doesn’t depend on every engineer remembering every rule in every code path. In a large multi-tenant Rails application, the safe path must be built into the system. The focus is primarily about correctness and customer data separation, but the broader operating principle is the same: important customer boundaries should be enforced by infrastructure and application frameworks.
The same thinking applies to scale. We want customer-specific load to be visible, attributable, and controlled. When a customer spike happens, we should be able to understand it as that customer’s workload, protect the rest of the platform, and add capacity where it’s actually needed.
Fin adds a new dimension to scaling. Our AI Agent Fin introduces a new set of infrastructure challenges. To provide reliable AI-powered support at scale, we need to operate across multiple model providers, route across them based on capacity and latency, and protect customer-facing workloads from lower-priority work. The details differ from traditional SaaS infrastructure, but the principle is the same: understand the bottlenecks, build clear scaling levers, and monitor the customer outcome. AI providers are not commodity storage systems, and we do not design as if they are.
That is why we have invested in Fin-specific reliability systems. Fin now fully resolves over two million conversations per week. At that scale, high availability cannot depend on a single model, a single provider, a single region, or a single pool of capacity. Our LLM routing layer supports cross-vendor failover, cross-model failover, latency-based routing, capacity isolation, and load testing. We also maintain buffer capacity with major providers, with headroom to handle 2x to 3x normal Fin traffic at any point. For enterprise customers, this matters because AI support volume can spike just like human support volume — and the AI layer must absorb that spike without relying on one fragile upstream path.
When customers depend on Fin to absorb a spike in support demand, the AI layer needs the same operational discipline as the rest of the platform.
Performance tests help, but production traffic is reality. Real customers use products in ways no synthetic test will perfectly predict: launches, incidents, seasonal patterns, gaming events, sudden changes in end-user behavior. Those moments give us data that no lab can fully reproduce. Often, a large customer event barely moves the platform-wide graphs because our customer base is broad enough that one industry’s peak aligns with another’s quiet period. Black Friday and Cyber Monday are good examples. Many ecommerce customers are at their busiest, while many B2B SaaS customers are quieter. At the aggregate platform level, the change can be much less dramatic than people expect.
“That does not mean those events are unimportant. It means we need to look at both levels: the health of the overall platform and the experience of the individual customer having the spike.”
Sometimes, these events teach us something specific. In one case, a very large customer used the Messenger in a way that exercised the full Messenger lifecycle even though the visible user experience did not require it. Under normal traffic, this was fine. During a major customer-side incident, their users refreshed aggressively, generating a much larger burst of Messenger traffic than the integration actually needed. The platform stayed available, but the event exposed unnecessary work in that integration path. We built a lighter-weight integration path that served the customer’s actual use case with far less work per request, making future spikes easier to absorb.
We treat large customer events this way even when there’s no broad customer impact. They’re opportunities to understand real scaling properties and make the next event safer — a habit that anchors our incident management, observability, and FinOps practices.
Scale is also an operating model. The infrastructure matters, but it’s not enough. You can have the right database architecture and still hurt customers if you detect issues late, recover slowly, communicate poorly, or fail to learn from incidents.
“That is why our operating model starts with customer outcomes. If the customer cannot do the job they came to do, the system is unhealthy. It does not matter how many dashboards are green.”
Heartbeat metrics tell us whether customers can do the core jobs they hire us to do. They cut through infrastructure noise and answer the question that matters most during an incident: are customers able to use the product successfully?
This shapes how we ship. Today, we average around 250 ships to production per workday, with an average merge-to-production time under 10 minutes. That isn’t a vanity metric — it’s part of the safety model. Smaller changes are easier to understand, easier to observe, and easier to roll back. Feature flags let us separate deployment from release. Automatic rollback and heartbeat-driven detection help us recover quickly when a change hurts customers. These are the very DORA metrics we hold ourselves to in order to balance CI/CD speed with stability.
“Fast shipping is not the opposite of reliability. Done properly, it is one of the ways you stay in control of change.”
The bar is high. Engineers are expected to understand the impact of their changes, watch them go live, and act quickly if something looks wrong. Resuming service is not the end of an incident. We expect teams to understand the root cause, fix the contributing systems, and prevent recurrence. That’s how scale stays safe over time.
Scheduled maintenance should be extraordinary. Historically, database maintenance was a main reason for maintenance windows: upgrading a database, changing instance sizes, performing failovers, or moving large tables could require customer-impacting downtime. With the move to Vitess and PlanetScale, we changed what routine database improvement looks like. We can upgrade, scale, and improve critical database infrastructure without turning that work into planned customer-impacting downtime — and we do this in practice, not just as a goal.
This matters because customers rely on our platform for live operations. If their support team, Messenger, Help Desk, or AI Agent is unavailable, the impact is immediate. Scheduled maintenance cannot be treated as a casual operational convenience.
“Our posture is simple: routine infrastructure improvement should not require planned customer-impacting downtime.”
Scheduled maintenance should be exceptional, non-routine, clearly communicated, and minimized in frequency, duration, and customer impact. That’s the practical benefit of the architecture work: better scaling is not only about handling more traffic, but also reducing the operational moments that might inconvenience customers.
What this means for customers is simple: be skeptical of vague scale claims. The question isn’t whether a vendor says they can scale — it’s whether they can explain how, where the limits are, what they measure, how they recover, and what they’ve changed after learning from production. We understand the scaling properties of our systems, have clear levers to add capacity at the right layers, design for customer isolation and fairness, monitor customer outcomes directly, and use real production events to make the next one safer. Scale is never finished. Every large customer event, traffic spike, migration, and incident teaches us something about the real behavior of the system — and we use that data to keep improving. That’s what you should expect from a platform you depend on during your busiest moments.
You want session replay on more journeys because the blind spots are expensive. A funnel can show where users leave, but it cannot show whether they encountered a broken control, a confusing message, a layout shift, or an error that never reached your analytics. Replay can turn those behavioral signals into enough context to make a product decision.
The hard part is expanding that visibility without collecting data you should not have, degrading the experience you are trying to understand, or filling storage with recordings nobody will use. The answer is not a single masking setting. You need a capture contract, a delivery architecture, a sampling model, and an operating scorecard that treat performance, fidelity, and privacy as one system.
Set the capture contract before you expand coverage
Replay programs often begin with a coverage question: what percentage of sessions should you record? That is the wrong first question. Start with the decision you expect the recording to change. If nobody can name that decision, more coverage will create more cost and exposure without producing more insight.
Write a capture contract for each product surface. This is a short, reviewable specification that connects a business purpose to technical controls. It should answer:
What question is replay meant to answer? Examples include diagnosing failed activation, explaining an error spike, or finding friction in a conversion step.
Which routes, components, and user cohorts are in scope? Name them. Do not approve an undefined all-product rollout.
Which data is prohibited? Include form values, credentials, payment details, message content, health information, account-recovery data, and any product-specific sensitive fields that apply.
What consent state permits capture? The recorder should not initialize before the required state is known. Withdrawal should stop capture and prevent queued data from being sent.
Who can watch a replay? Define roles by purpose. Product discovery, support investigation, engineering diagnosis, and administration do not automatically require identical access.
How long will the data remain available? Tie retention to the stated purpose rather than keeping replay indefinitely because storage permits it.
What sampling rule applies? State the baseline rate, targeted cohorts, exclusions, temporary overrides, owner, and expiry condition.
Apply those controls as close to collection as possible. A web replay is commonly reconstructed from serialized page state, changes, and interaction events. The privacy risk therefore sits in the data leaving the browser, not only in what the player later displays. A value hidden during playback may already exist in an outbound payload or stored record.
A useful default is to block text and input values, then allowlist only fields proven safe and necessary. Add route-level and component-level exclusions for sensitive surfaces. Use a separate, time-bounded approval for diagnostic capture that needs greater fidelity. I would reject a policy that merely says to mask personal information: the term depends on context, and engineers cannot reliably implement an undefined category.
Test the contract against the raw system, not just the player. Seed a non-production fixture page with recognizable test values, exercise every relevant component state, inspect the browser payload, inspect the stored representation, and verify that exports and downstream tools preserve the restriction. If a prohibited test value crosses the collection boundary, the control has failed even if the replay screen obscures it.
Consent and retention obligations vary by jurisdiction, contract, and data type. Your privacy or legal owner must approve those rules for the markets you serve. Engineering can enforce an approved policy; it cannot infer that policy from a generic replay configuration.
Keep capture off the user’s critical path
Scalable replay starts in the browser, where your product competes with the recorder for main-thread time, memory, and bandwidth. A backend that can ingest billions of events does not help if the recorder makes an interaction sluggish or loses the DOM changes needed to explain the problem.
Capture the minimum useful representation. Filter excluded nodes and values before serialization. Avoid collecting detail that no approved use case needs.
Separate recording from transport. The capture path should write to a bounded queue rather than waiting for a network request. Upload latency must not become interaction latency.
Batch adaptively. Small batches can reduce delay during quiet periods, while larger compressed batches can reduce request overhead during sustained activity. The policy should respond to queue pressure and network conditions.
Define backpressure behavior. When production exceeds delivery capacity, the recorder needs a documented degradation order. Preserve navigation, consent changes, errors, and the structural events required for reconstruction before lower-value detail. Never freeze the page to protect the replay.
Bound long sessions. Flush incrementally, cap memory use, and make reconnection behavior explicit. A queue that grows for the life of a tab will eventually turn a delivery problem into a page-performance problem.
Make partial data visible. Mark gaps, dropped segments, and incomplete uploads. A replay that silently appears complete is more dangerous than one that clearly communicates its limits.
Backpressure deserves special attention because it forces a product decision disguised as an implementation detail. If the system cannot retain everything, what must survive? The answer should come from the capture contract. An error marker without enough surrounding state may be useless, but exhaustive cursor movement may be expendable. Rank event classes before an incident forces the recorder to choose implicitly.
Do not validate the client only on a fast laptop and stable connection. Use representative complex pages and test replay on and off under CPU pressure, constrained networking, rapid DOM change, background-tab transitions, reconnection, and long sessions. Compare Web Vitals, long tasks, memory growth, bytes transferred, queue drops, upload completion, and playback completeness. Long sessions, traffic spikes, complex interactions, and variable networks are precisely where an apparently sound design reveals its failure modes.
There is no universal acceptable overhead that fits every product. Set budgets relative to your production baseline and the importance of the journey. A small regression on a frequently used mobile activation path may matter more than a larger regression on an internal administration page. Segment the results by route, browser, device class, network condition, and session length so averages do not hide the users most affected.
Sample for decisions, not for a warehouse of footage
A single global sample rate is easy to configure and hard to defend. It spends collection capacity uniformly even though product questions are not uniformly valuable. It can also miss rare failures while overrepresenting routine sessions that nobody will watch.
Use a portfolio of sampling modes:
Random baseline sampling gives you a less biased view of ordinary behavior and lets you notice problems you did not predefine.
Cohort sampling increases visibility for a defined population such as new users, a browser family, a release cohort, or users entering a critical journey.
Signal-based sampling concentrates diagnosis around errors, failed steps, rage clicks, dead clicks, abnormal exits, or other instrumented friction signals.
Temporary diagnostic sampling raises fidelity for a narrow incident or release window, with an owner and an automatic expiry condition.
Hard exclusions override every sampling mode. A high-value investigation is not permission to collect from a prohibited surface or consent state.
Keep one statistical distinction clear. Targeted replay is good for explaining a known problem, but it cannot tell you how prevalent that problem is. If you record sessions because they contain an error, the resulting library will naturally make errors look common. Use analytics or a random baseline to measure frequency. Use replay to understand mechanism and context.
A disciplined investigation looks like this:
Find a measurable change in a funnel, cohort, error rate, performance signal, or support pattern.
Define the affected population before opening replays.
Review a deliberately selected set of relevant sessions and record recurring observable behaviors, not interpretations of user intent.
Turn those observations into a falsifiable product or technical hypothesis.
Instrument, release, or experiment so the hypothesis can be measured outside the replay player.
This prevents two common mistakes: browsing memorable sessions until a story feels true, and treating one vivid recording as evidence of market-wide demand. Replay is strongest when it explains a quantitative signal and leads back to a measurable change.
Run replay with a coupled performance, privacy, and value scorecard
Session replay is not finished when playback works. It is an operating capability with client releases, configuration changes, storage growth, access decisions, and incident risk. Give it an owner and review the system across five dimensions.
Dimension
Signals to watch
Decision the signals should trigger
User experience
Web Vitals, long tasks, main-thread work, memory growth, and replay bytes
Reduce capture detail, change delivery behavior, narrow coverage, or halt a rollout when the recorder breaks its budget
Fix prioritization or transport before teams rely on incomplete recordings for decisions
Platform reliability
Ingestion failures, processing delay, retrieval latency, playback-start failures, and behavior during traffic spikes
Add capacity, repair a failing stage, or adjust sampling without shifting the problem into the browser
Privacy and governance
Redaction test failures, capture outside approved consent states, retention exceptions, and access outside approved roles
Disable affected capture, contain the data, follow the approved deletion or incident process, and repair the control before restoring it
Decision value
Investigations that reached a useful replay, time to diagnosis, time to resolution, and product hypotheses validated outside replay
Move coverage toward high-value use cases or retire collection that produces no action
These dimensions constrain each other. Aggressive compression may improve bandwidth while hurting reconstruction. More capture may improve fidelity while violating the page budget. Narrow access may improve governance while blocking the support engineers responsible for incident response. The job is not to maximize any single metric; it is to keep the entire system inside approved boundaries.
Version capture configuration like production code. A seemingly harmless selector change can expose text, remove necessary context, or increase mutation volume. Test recorder and configuration releases against fixture pages containing known sensitive values and known reconstructable interactions. Keep a rollback path.
Prepare shutdown controls before launch. You should be able to stop capture for a component, route, environment, tenant group, or the whole product without waiting for a new application release. Document who can use each control, how queued data is handled, how affected stored data is identified, and when privacy, security, support, and engineering must be involved. If collection crosses a prohibited boundary, continuing to record while the team debates ownership compounds the exposure.
Finally, connect replay operations to the workflows that consume it. Product teams need links from behavioral cohorts to relevant sessions. Support needs controlled escalation paths. Engineering and SRE need errors, network signals, layout shifts, and performance context close to the replay timeline. Connecting interaction context to observability and delivery workflows can shorten the path from an anomaly to a testable explanation, but only if the data remains trustworthy and accessible to the right roles.
Key takeaways
Approve a capture contract for each surface before approving a broader sample rate.
Redact or exclude sensitive data before it leaves the browser; a masked player is not enough.
Protect the page with decoupled delivery, bounded queues, adaptive batching, and explicit backpressure priorities.
Keep random sampling for prevalence and use targeted sampling to explain known signals.
Operate performance, fidelity, platform reliability, privacy, and decision value as a coupled scorecard.
Require scoped shutdown controls, retention handling, access ownership, and rollback before production expansion.
Before you increase replay coverage, ask for two artifacts: a one-page capture contract for the next journey and a replay-on versus replay-off test under that journey’s difficult conditions. If the team cannot show what is allowed to leave the browser, how the page stays within budget, and which decision the recordings will change, the rollout is not ready to scale.
Your Amplitude dashboard is populated, but the room still debates whether the numbers are real. Engineering sees successful requests. Product sees unexplained breaks. Each feature adds more events, yet confidence in the data keeps falling.
You do not fix this by collecting more data or polishing the dashboard. You fix it by treating instrumentation as a product interface: designed around a decision, expressed as a clear contract, reviewed with the code, tested against real journeys, and monitored after release.
Design the decision before you name the event
The most common instrumentation failure starts before an engineer writes code. A stakeholder asks to track a page, button, or feature without saying what decision the data must support. The resulting event may be technically valid and still be useless.
Begin with a decision statement: If this behavior differs by this segment or step, I will change this part of the product. That sentence forces you to identify the behavior, comparison, and possible action. If nobody can describe the action, the proposed event is probably speculative inventory rather than decision-grade data.
Suppose you need to decide whether team invitations are blocking activation. A useful behavioral sequence might contain Workspace Created, Invitation Sent, Teammate Joined, and First Shared Action Completed. The important work is not typing those labels. It is defining what each one means.
Does Invitation Sent fire when someone clicks the button, when the request succeeds, or when the message is accepted for delivery?
Does Teammate Joined mean the invite was accepted, the new user signed in, or the user entered the intended workspace?
Can retries emit the same behavior more than once?
Can an existing user join through a path that bypasses the invitation flow?
Which actor owns the event: the inviter, the invitee, the workspace, or some combination?
Those distinctions determine whether the funnel represents the customer journey or merely the user interface. A click is evidence of intent. A confirmed state change is evidence of completion. Track both only when you have a real use for both, and do not give them names that imply the same meaning.
Use events for behaviors that happened and properties for the context needed to interpret them. If email and link invitations represent the same business action, use one Invitation Sent event with an invitation channel property. Split them into separate events only when their meanings, lifecycles, or downstream decisions genuinely differ.
Before approving an event, require answers to five questions: Who will use it? What decision will it change? What exact condition emits it? What else could produce the same signal? What will you do if the result moves? This keeps the tracking plan small enough to govern and precise enough to trust.
Turn the tracking plan into an executable contract
A tracking spreadsheet is not a contract if the implementation can drift from it unnoticed. The definition must be specific enough for an engineer to implement, a reviewer to challenge, and an automated check to validate.
Data quality has several independent layers. Structural validity asks whether the payload follows the expected schema. Semantic validity asks whether the event means what its name claims. Coverage asks whether every intended surface and journey emits it. Identity integrity asks whether behavior is attached to the right user, account, or workspace. Passing one layer does not prove the others.
An event can therefore be perfectly formatted and analytically false. Invitation Sent with a valid channel property still misleads you if it fires before the backend confirms success. This is why human-readable names and strict schema validation are necessary controls, but not the whole quality system.
Contract field
What to specify
Failure it prevents
Decision and metric
The product question, downstream measure, and action the signal can change
Events collected without a defined use
Canonical event
One stable, human-readable name and any forbidden aliases
Several names for the same behavior
Trigger and completion boundary
The exact state transition, success condition, and behavior on failure or retry
Clicks or attempts being counted as completed outcomes
Emitter and source of truth
The client, server, worker, or other component responsible for emission
Double counting when multiple layers report the same action
Actor and entity
The user, account, workspace, or object to which the behavior belongs
Metrics grouped around the wrong unit of analysis
Required properties
Names, types, allowed values, null rules, and derivation logic
Broken segments and silent type drift
Identity behavior
Expected handling before sign-up, after login, after logout, and during account changes
Split histories, merged users, and misplaced account activity
Environment and release context
How production, test data, application versions, and relevant platforms are distinguished
Test traffic contaminating decisions or regressions being hidden in aggregates
Owner and lifecycle
The accountable team, review status, downstream consumers, and deprecation path
Orphaned events that nobody can safely change or remove
QA evidence
The automated assertion, tested journey, sample payload, and production verification
Approval based only on code inspection
Property rules deserve the same precision as event rules. Decide whether an absent value means unavailable, not applicable, or an instrumentation defect. Keep types stable. Define bounded values where the business vocabulary is bounded. Avoid using display copy as an analytical value because a harmless wording change can fragment the data.
Treat a property type change, trigger change, or identity change as a breaking contract change. Adding a new optional property is usually less disruptive than changing what an existing field means. When meaning must change, introduce an explicit migration plan and identify which historical comparisons will no longer be valid.
Identity needs its own test plan. Exercise an anonymous visit followed by registration, a returning-user login, logout on a shared device, switching between workspaces, and any cross-device journey you intend to analyze. Verify the resulting user and account histories instead of assuming the SDK calls produce the business behavior you want.
Apply data minimization at the contract boundary. Every property should have a decision use, an owner, and an acceptable data classification. Do not collect free-form or sensitive values merely because they might become useful later. Preventing unnecessary capture is safer than trying to contain it after it has entered the analytics pipeline.
Make the pull request your instrumentation quality gate
Developer-first instrumentation does not mean product hands analytics to engineering and walks away. It means the analytics contract follows the same change-management path as the behavior it describes. The code, definition, tests, and review evidence move together.
Start in a feature branch. Run the setup workflow there so configuration and instrumentation changes are visible before they reach the main branch.
Update the analytics contract in the same pull request as the feature. A behavior change without its contract delta is incomplete; a contract change without its implementation is unverifiable.
Review the emission boundary. Confirm that the event fires on the intended success condition, has one authoritative emitter, handles retries deliberately, and does not fire on rendering unless rendering is the behavior you mean to measure.
Run structural checks in CI/CD. Validate canonical names, required properties, types, permitted values, environment configuration, and forbidden fields. Fail the build when a known contract is violated.
Run behavioral tests around the analytics client. Exercise success, failure, cancellation, and retry paths, then assert which events should and should not be emitted. A negative assertion is often what catches inflated success metrics.
Verify the journey in a non-production environment. Capture the observed sequence and payload, then compare them with the contract. Keep this traffic distinguishable from production behavior.
Define the production check before merging. Name the owner, expected signal, dimensions to inspect, downstream chart or cohort affected, and response if the data does not match the release.
Automated checks are strongest at detecting known structural failures. They can prove that a required field exists; they cannot decide whether the field represents the right business concept. Keep a lightweight semantic review in the pull request. Engineering should own trigger and runtime correctness. The product or analytics owner should own meaning and downstream use. Bring in privacy or security review when the identity model or captured data changes.
The reviewer should be able to reconstruct the analytical meaning without reading every implementation detail. Include the decision statement, contract change, sample payload, tested journey, and affected measures in the pull request. That context preserves intent when the original team has moved on and makes later taxonomy changes auditable.
Do not turn the gate into an analytics committee. Most changes need a clear owner and one qualified reviewer, not a meeting. Escalate when a change redefines a shared event, alters identity, introduces sensitive data, or breaks historical comparability. Routine additions that conform to the contract should remain routine.
Prove production data is decision-grade, then keep proving it
A successful deployment proves that code reached production. It does not prove that actual customers, application versions, queues, retries, and identity transitions produce trustworthy analysis. The final quality gate operates on observed production behavior.
Inspect new or changed instrumentation by release, platform, environment, emitter, and relevant customer segment before relying on an aggregate. Aggregates can hide a missing platform, a version-specific regression, or duplicate client and server events.
Presence: Did the intended event appear after the release, and is an unexpected absence explained by traffic or by a defect?
Completeness: What share of observed events contains each required property, and where are missing values concentrated?
Conformance: Did new property values or types appear outside the agreed contract?
Uniqueness: Do retries, page transitions, or multiple emitters create suspicious duplicate patterns?
Sequence sanity: Can a completion event occur without the prerequisite behavior, and is that a legitimate alternate path?
Identity continuity: Do anonymous, authenticated, user, and account histories connect in the journeys that matter?
Comparability: Did the release change the meaning or population of an existing metric even though its name stayed the same?
Set alert and acceptance thresholds from expected traffic, historical behavior, and the cost of a wrong decision. A universal percentage would create false precision. An event used for an executive activation metric deserves a tighter response than a diagnostic event used occasionally by one feature team.
Give every important event a visible trust state. Proposed means the contract exists but the code does not. Instrumented means the code is deployed. Observed means production data has arrived and basic checks passed. Trusted means the owner has verified the real journey and approved downstream use. Deprecated means new analysis should stop depending on it. This vocabulary prevents a dashboard builder from treating mere event presence as approval.
When production data is wrong, treat it like a data incident. Record the affected event, properties, segments, and time window. Identify the dashboards, experiments, and decisions that consume it. Stop or correct the bad emission. Backfill only when the intended values can be reconstructed deterministically from reliable records; otherwise, preserve the gap and mark the period as non-comparable. A plausible-looking repair is more dangerous than an explicit hole because it hides uncertainty.
Add the failure mode to the contract test after the repair. If a retry caused duplicates, add a retry case. If one platform omitted a property, cover that platform. If identity changed during a workspace switch, turn that journey into a regression test. The incident should leave the instrumentation system harder to break in the same way.
Govern by change triggers rather than recurring ceremony. Review instrumentation when a team launches a new journey, moves an event between client and server, changes identity behavior, modifies a shared taxonomy, adds a platform, or sees unexplained production drift. This focuses attention where meaning can change.
Start every event with a decision, observable behavior, and named owner. If the possible action is unknown, do not collect the event by default.
Define trigger, emitter, actor, properties, identity behavior, environment handling, and QA evidence as one versioned contract.
Ship the contract, implementation, automated checks, and journey evidence in the same pull request.
Separate structural validation from semantic review. A valid payload can still represent the wrong behavior.
Promote events from instrumented to trusted only after production verification, and mark damaged periods instead of silently presenting them as comparable.
Use the next feature as the boundary for change. Pick one consequential customer journey, write its contract, put the instrumentation through the pull request, and verify it after release. Do not wait for a company-wide taxonomy rewrite. One fully governed journey will expose the missing standards and give you a working pattern for the next one.
If your team cannot show the contract, test evidence, production check, and current trust state behind a metric, do not use that metric for a roadmap or growth decision yet. Label the uncertainty, repair the signal, and make trust part of the definition of done.
Fraud teams are drowning in signals—events, alerts, and edge cases that look suspicious but rarely point to what truly matters now. In my role leading product, I focus on turning that noise into clear, ranked actions the team can trust. Behavioral analytics is how we bridge the gap from “something looks off” to “here’s why it matters and what to do next.”
See how behavioral analytics helps fraud management teams surface anomalies, prioritize risk factors, and act faster with greater confidence.
When I build fraud capabilities, I start by defining the outcomes that matter: find anomalies early, prioritize by impact, and respond in minutes—not days. That requires a rigorous approach to data governance, strong observability across the stack, and a mindset tuned to threat detection and response rather than passive reporting.
For me, behavioral analytics means unifying event streams across web, mobile, payments, and support into a single, trustworthy, unified analytics platform. We then apply anomaly detection on top of baselines for user, device, and entity behavior—capturing velocity spikes, geolocation drift, account takeover signals, and unusual journey paths. The win is not more alerts; it’s clearer context per alert.
Prioritization is where the value compounds. I combine deterministic signals (e.g., device fingerprint mismatches, impossible travel, repeated declines) with weighted risk scoring that adapts to emerging patterns. This helps fraud analysts triage by potential loss and customer impact, not just alert volume—so the highest-risk cases land at the top of the queue with the right context attached.
Actionability is the final mile. I map each risk tier to a playbook—step-up authentication, temporary holds, secondary review, or immediate block—so teams can act with confidence. Real-time alerts route to the right channel; feature flags allow fast containment; and AI risk management practices ensure continuous learning while preserving precision and recall. We close the loop by measuring investigation time, false positive rates, and recovery to keep improving.
A few lessons keep paying off: instrument early and consistently; keep your schema stable; document risk definitions; and test changes with A/B testing to quantify impact before scaling. Treat your fraud stack like a mission-critical cybersecurity system with tight SLAs, clear ownership, and auditable decisions—because it is.
If you’re evaluating your next move, start with a narrow but high-ROI use case (account takeover or payment fraud), stand up clear dashboards for analysts, and iterate on the risk scoring model weekly. With disciplined data practices and aligned playbooks, behavioral analytics turns scattered signals into decisive, defensible action.
Inspired by this post on Amplitude – Perspectives.
I’ve stepped into too many product reviews where teams argued over numbers that should have been obvious. Three names for the same “signup” event, properties scattered across tools, and no shared definitions—classic analytics chaos. As VP of Product Management at HighLevel, I’ve learned that scaling an analytics taxonomy isn’t just a data exercise; it’s a leadership mandate that unlocks decision velocity, alignment, and confident product bets.
Learn best practices our professional services team has compiled in helping customers move from scattered events to a scalable, user-friendly data structure.
Why does this matter so much? A robust taxonomy powers a unified analytics platform across Amplitude analytics, Pendo, and our CRM stack, reduces rework, and strengthens data governance. When events are clear and consistent, product-led growth accelerates: onboarding becomes measurable, activation is trackable, and retention analysis turns into a weekly ritual rather than a quarterly scramble.
I always start with outcomes, not events. We define a North Star metric and use driver trees to map how user behaviors ladder up to that outcome. Then we ground the plan in journey mapping: what signals mark activation, aha moments, and long-term engagement? This ensures our taxonomy mirrors real user intent, not just engineering convenience.
Next comes naming conventions and structure. We standardize on a readable, durable pattern (for example, actor_action_object), apply consistent property naming, and document required vs. optional properties. We version events deliberately, so we can evolve without breaking dashboards. Most importantly, we align events to product strategy—tracking less, but better.
Governance makes it scale. We establish a clear DRI for the tracking plan, a lightweight review process for changes, and a schema registry that serves as the single source of truth. Privacy-by-design is non-negotiable: we treat sensitive fields deliberately and audit access. Observability closes the loop—schema validations and alerts catch drift before it confuses teams.
Tooling and process turn good intentions into muscle memory. We keep the tracking plan “as code” in a repository, run CI/CD checks to validate events, and use feature flags to roll out new instrumentation safely. Pendo helps us annotate in-app experiences, while Amplitude provides the exploratory lens for cohorts, funnels, and retention. Together, these systems reduce guesswork and speed up discovery.
Migrations are where many teams stall, so I de-risk them with a clear, time-boxed plan. We audit the current event surface, map scattered events to the new taxonomy, and deprecate duplicates with guardrails. We communicate changes broadly, provide easy-to-scan documentation, and pair enablement sessions with hands-on examples from live dashboards. The goal is confidence, not just compliance.
We measure success like a product. Are we answering critical questions faster? Are duplicate events trending down? Are activation and retention questions easy to answer in under five minutes? When the taxonomy is working, stakeholders stop asking, “Do we trust this?” and start asking, “What should we build next?”
One of the most rewarding shifts I’ve seen: product trios moving from ad-hoc analyses to repeatable, weekly rituals. With crisp definitions, onboarding flows become testable, PLG motions are predictable, and leadership reviews focus on outcomes, not definitions. That’s the moment analytics transforms from a cost center into a growth engine.
If you’re staring at a wall of scattered events, start small: clarify outcomes, align your journey map, set conventions, and ship a minimum viable taxonomy to one critical flow. Iterate quickly. The compounding payoff—clarity, speed, and trust—will be obvious to every team you partner with.
When we do this well, analytics becomes a strategic asset. Our teams spend less time reconciling numbers and more time building what matters. That’s the real meaning of moving from chaos to clarity.
Inspired by this post on Amplitude – Best Practices.
Where is the true boundary between product and engineering—and what happens when it gets blurry? I’ve led and coached teams through this question many times, and I’ve learned that clarity here isn’t just a nice-to-have; it’s foundational to quality, velocity, and team health.
I’ve seen well-intentioned product managers step in to “help” by taking ownership of bug triage, tech debt prioritization, or even system architecture. At first, it feels productive. Over time, it creates role confusion, slows decision-making, and burns out PMs—while paradoxically lowering engineering quality. The “CEO of the product” myth and legacy IT, project-based mindsets are usually at the root. Treating engineers as “order takers” breaks down in evergreen product environments.
The healthiest collaboration model is simple and disciplined: The product trio owns the “what”; engineering owns the “how”. Product managers are not people managers for engineers—and shouldn’t be accountable for engineering quality. Our job is to frame the problem, align on outcomes, and continuously discover value with customers—not to supervise technical execution.
If quality is a problem, the solution is escalating and fixing the system, not managing individual bugs. In practice, that means surfacing patterns and elevating them to engineering leadership, who can address root causes—staffing, skills, code health, CI/CD gaps, observability, or process design—rather than asking PMs to paper over issues with status updates. This keeps accountability where it belongs and reinforces outcomes vs output OKRs.
One high-leverage move is to remove unnecessary intermediaries. Removing the PM as a middleman creates better flow and clearer ownership. Create direct paths for stakeholders to get bug status without routing everything through product. Use dashboards, shared tools, or Slack channels instead of one-off updates. In my teams, shared Jira views, Slack incident channels, and status pages eliminated handoffs, improved stakeholder management, and gave engineers the space to solve problems end-to-end.
Strong engineering leadership is non-negotiable. What strong engineering leadership should own (and why that matters) is the technical system, quality guardrails, sustainable pace, and the practices that uphold them—incident management, code review rigor, test coverage, and SLOs with SRE. Skilled engineering teams naturally push back when boundaries are crossed—and that’s a good thing. It signals ownership, craft pride, and a pathway to durable execution.
When do I step in as product? Primarily to clarify desired outcomes, sequencing, and trade-offs—bringing customer and business context to the table. I structure product roadmapping and sprint planning around value slices and risks, not task lists. I align on decision rights early: architecture and tech debt strategies live with engineering; product strategy, positioning, and success metrics live with product; discovery and prioritization live with the product trio.
Here are the system-level moves I’ve found most effective: Escalate systemic quality issues to engineering leadership, not individual contributors. Advocate for real engineering leadership if your org expects product teams—not IT teams. Then reinforce a culture of continuous discovery so product, design, and engineering make better upstream decisions together. This is how empowered product teams ship higher-quality outcomes—without burning anyone out.
If you’ve ever found yourself acting as the middleman for bug status or being asked to “own” engineering decisions outside your expertise, you’re not alone. Reset the boundaries, make work visible, and double down on shared outcomes. In my experience, the moment we clarify roles and remove status theater, quality rises, cycle time improves, and everyone does the job they were hired to do—better.