Our retention curve had flattened even as activation ticked up, and that disconnect told me we were missing a leading indicator buried in our AI agent telemetry. I set out to connect our AI evals directly to product retention, not as an academic exercise, but as the basis for focused roadmap bets and stronger product-led growth.
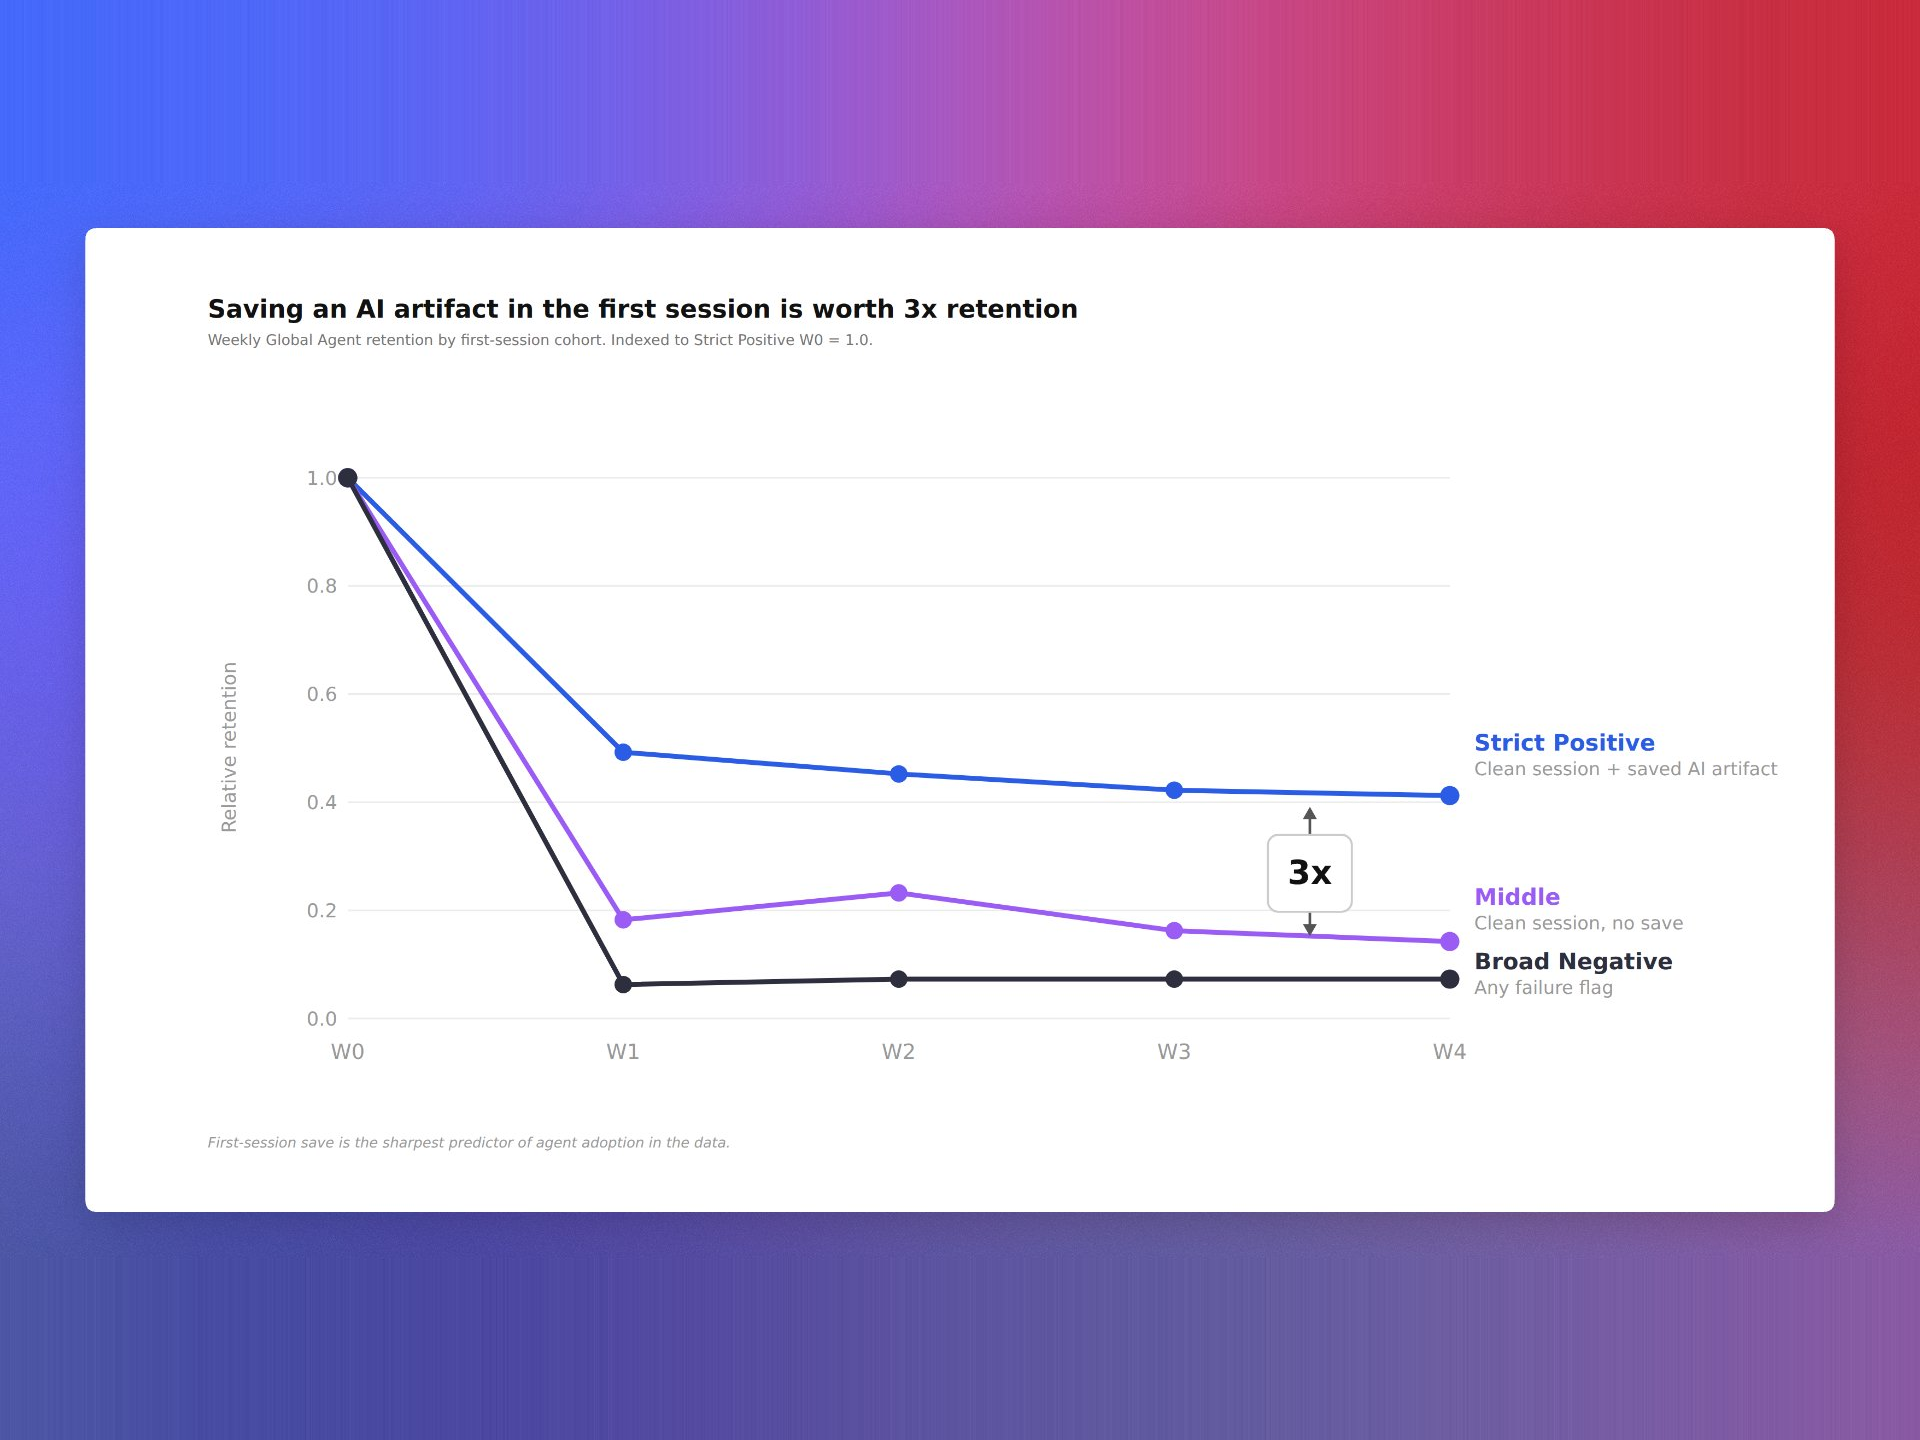
"Learn how we used Agent Analytics to discover an eval signal that predicts 3X higher user retention."
Connecting AI evals to retention analysis is deceptively hard. Evals often live in ad-hoc notebooks while behavioral analytics and cohort retention live elsewhere. IDs drift. Signals are noisy. Teams gravitate to fast output over outcome clarity. I leaned into eval-driven development to close that gap and make our AI workflows accountable to business results.
We began with crisp hypotheses: for example, that higher semantic accuracy and lower escalation rates would correlate with repeat usage. We enumerated a concise eval taxonomy—accuracy, containment, safety, latency, and UX friction—and used Agent Analytics to compute per-user and per-tenant features on a daily cadence. That gave us a reliable, unified analytics platform for AI-specific signal generation.
Next, we joined those features to our product telemetry in Amplitude analytics using clean user and account identifiers. With that foundation, we created weekly and monthly cohorts, ran retention analysis, and used driver trees alongside simple logistic models to control for plan type, segment, region, and acquisition channel. The goal wasn’t perfection—it was directional clarity strong enough to inform product strategy.
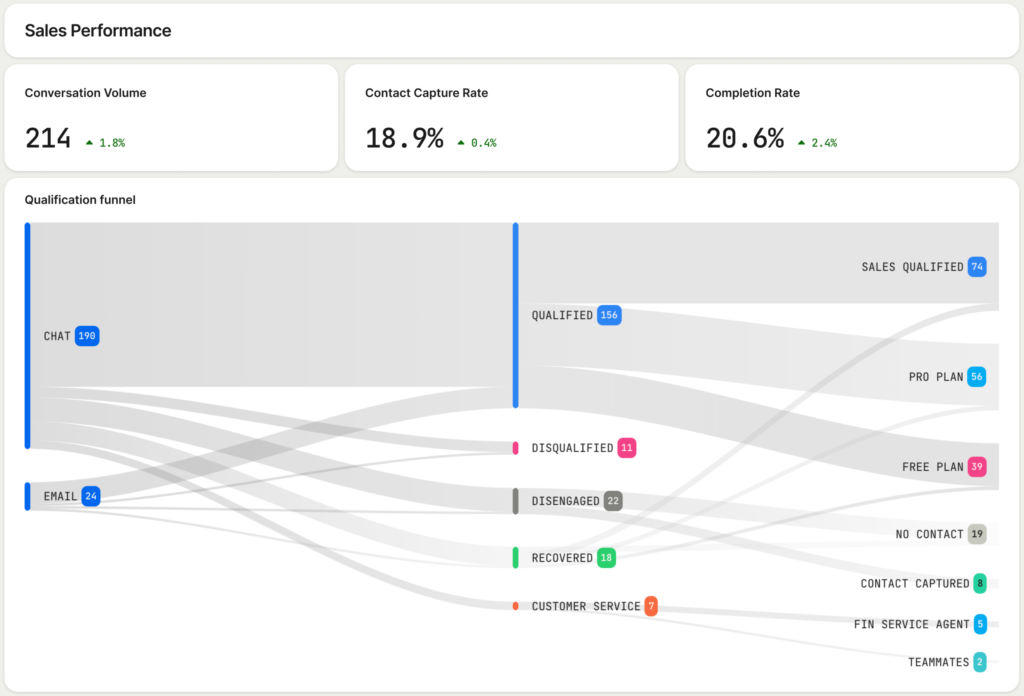
One eval metric separated itself from the pack. When users hit a specific threshold early in their journey, the model predicted 3X higher user retention compared to peers who didn’t. I still remember overlaying that signal on our cohort chart—the lift was impossible to unsee, and it immediately reframed our activation and onboarding priorities.
From there, we operationalized. We built in-app guides that nudged new users toward the eval threshold, added a health score to customer success workflows, and put feature flags on model changes until they improved the eval. We validated the effect size with A/B testing and set up anomaly detection to catch regressions before they touched real users.
If you want a repeatable playbook: define your north-star retention window, shortlist 3–5 eval candidates tied to real user value, ensure rock-solid identifiers across systems, compute daily features in Agent Analytics, model uplift against retention cohorts in Amplitude analytics, then translate the winning signal into onboarding nudges, product tours, and success playbooks. Track second-order outcomes too—support tickets, NPS, and Net Recurring Revenue (NRR)—so you don’t optimize a proxy at the expense of experience.
I also learned what to avoid. Watch for sample-size traps and label leakage, and remember that segment mix can masquerade as model improvement. Use minimum detectable effect (MDE) calculations to size experiments, add risk scoring to gate launches, and keep a tight feedback loop between product, data science, and customer success.
The payoff is far more than a tidy dashboard. By grounding our AI strategy in behavioral analytics and measurable retention lift, we turned an abstract eval into a concrete growth lever—and gave our product teams the confidence to move faster with clarity.
Inspired by this post on Amplitude – Perspectives.


Leave a Reply