
When I need fast, trustworthy visibility into how users actually experience a product, I turn to Amplitude—and specifically to "Session Replay", "Heatmaps", and "Zoning Insights". These capabilities translate behavioral signals into crisp narratives that my team and I can act on with confidence. They shorten the distance between a hypothesis and evidence, which is exactly what high-velocity product organizations need.
"Session Replay" helps me move beyond aggregate metrics to see friction in context. Instead of debating why an activation step underperforms, I watch representative sessions to pinpoint the precise moments where intent stalls—confusing copy, a misaligned CTA, or an unexpected edge case. This evidence accelerates continuous discovery and quickly informs where to refine UX flows or instrument smarter "A/B testing" to validate improvements.
With "Heatmaps", I get a fast, intuitive view of where attention concentrates and where it dissipates. It’s a powerful complement to behavioral analytics: I can correlate engagement hotspots to intent signals and identify dead zones that warrant design changes. When paired with journey mapping and crisp product discovery questions, heatmaps make it easier to align cross-functional teams around the most promising experiments.
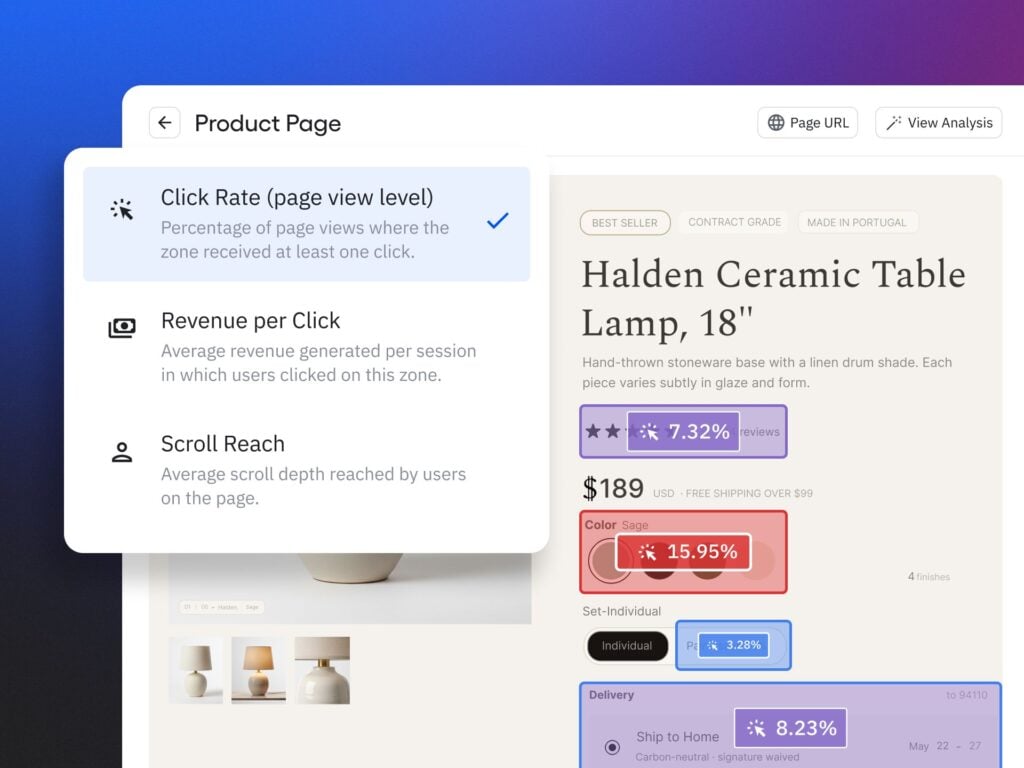
"Zoning Insights" adds a layer of precision by quantifying how specific interface regions contribute to outcomes. I rely on this to reduce opinion-driven debates and focus on the UI elements that actually drive user activation, conversion, and retention. It’s a direct line from evidence to roadmap priority, which keeps product strategy grounded in results rather than anecdotes.
All of this sits neatly alongside "Amplitude analytics", allowing me to connect qualitative context from replays and heatmaps with quantitative patterns in funnels, cohorts, and drivers. That integration strengthens product-led growth motions: stronger hypotheses, quicker iteration loops, and clearer accountability for outcomes like user activation and retention analysis. The result is a more disciplined approach to product strategy, where each bet is traceable to user behavior and business impact.
In practice, I embed these capabilities into product trios and continuous discovery rituals. We instrument events, define success upfront, and run tightly scoped experiments that de-risk decisions before we scale. The payoff is faster learning, fewer costly missteps, and a roadmap that reflects what customers actually do—not just what they say.
If you’re aiming to sharpen prioritization and accelerate value delivery, combining "Session Replay", "Heatmaps", and "Zoning Insights" with robust behavioral analytics is one of the most effective, scalable ways I’ve found to align teams, de-bias decisions, and drive measurable outcomes.
Inspired by this post on Amplitude – Best Practices.


Leave a Reply