When I think about what separates resilient products from forgettable ones, it always comes back to product value. In my role leading product at HighLevel, I’ve learned that value isn’t a slogan—it’s the measurable, compounding outcomes customers experience that make your product indispensable and your growth durable.
Discover what product value means, how to measure it with key metrics, and proven ways to increase product value for long-term growth.
Here’s how I define it in practice: product value is the net benefit a clearly defined ideal customer profile realizes over time, relative to their next best alternative and the total cost to achieve that benefit. That framing forces me and my team to zoom in on two questions: who exactly are we building for, and what outcomes do they consistently achieve with us that they can’t achieve as easily or as affordably elsewhere?
Value shows up twice in a customer’s journey—first as perceived value (do they believe it will help?) and then as realized value (did it actually help?). Great product management closes the gap between the two by aligning product positioning, onboarding, user activation, and ongoing engagement with the outcomes customers care about most.
To manage product value rigorously, I look through three lenses: perception, behavior, and economics. Together, they give me an end-to-end picture that is actionable for product discovery, go-to-market strategy, and product-led growth.
Perception tells me how customers feel about their trajectory with our product. I track signals like NPS, CSAT, and CES, and I rely on structured interviews to capture Jobs-to-be-Done narratives. These qualitative insights often reveal points of parity we must meet just to be considered, and the points of differentiation we must elevate in our value proposition to win.
Behavior tells me what customers actually do. Time-to-value, onboarding completion, activation rate, retention curves, feature adoption depth, and weekly active teams are my go-tos. Instrumentation matters: with Amplitude analytics, Pendo, and Intercom, I map funnels and cohorts so I can see where users stall and where they surge. When I spot friction in the first session or first week, I treat it as an opportunity to tighten product tours, improve tooltip design, and personalize in-app guides.
Economics tells me what value means to the business over time. I watch LTV, Net Revenue Retention, expansion revenue, gross margin, and CAC payback. Cohort-based retention analysis is especially revealing—if expansion offsets logo churn, I know we’re delivering value strong enough to merit deeper adoption, not just initial curiosity.
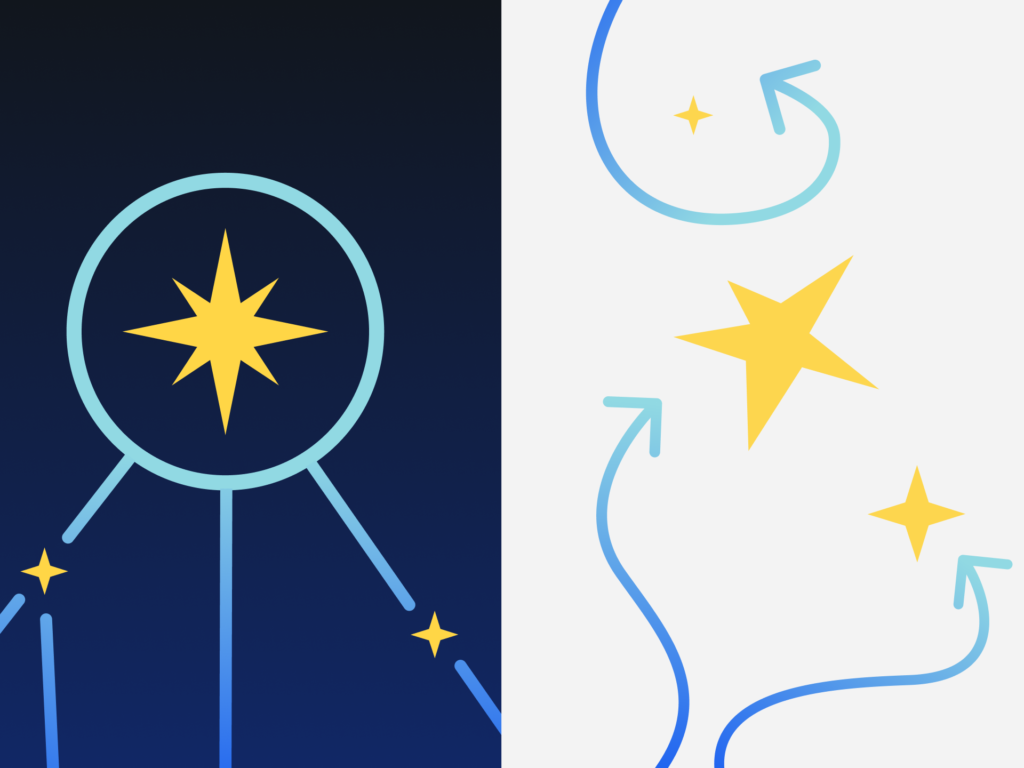
Anchoring this with a North Star Metric helps my teams aim at outcomes, not output. I choose a metric directly tied to customer value creation—something like “activated accounts achieving the aha moment weekly”—and wire it through outcomes vs output OKRs. That way, product roadmapping and sprint planning reflect what customers pay for, not what’s easiest to ship.
Growing product value starts with sharpening the ICP and clarifying the value proposition. I map pains and desired outcomes, articulate points of parity we must satisfy, and highlight the differentiators that change the decision. From there, I revisit SaaS pricing and packaging to ensure customers pay in proportion to realized value, not feature count.
Next, I systematically compress time-to-value. Fast, context-aware onboarding and user activation are non-negotiable. I combine in-app guides, product tours, and progressive tooltips with CRM integration through platforms like HubSpot to trigger the right message at the right step. A/B testing then helps me identify which experiences reduce setup friction and accelerate that first meaningful outcome.
Sustained engagement compounds value. I design habit loops around core jobs, reduce cognitive load in key workflows, and surface proofs of progress at moments when users are most likely to disengage. For advanced users, I introduce higher-order use cases and templates that inspire expansion without overwhelming new users who are still finding their footing.
None of this works without empowered product teams. I rely on product trios to align discovery and delivery, and I keep feedback loops tight so real customer signals inform every release. This is how we move from shipping features to earning outcomes, from intuition-only to evidence-backed decision making.
If you need a starting plan, try this: define your North Star Metric and its leading indicators, instrument your critical paths, identify the three biggest drop-offs between sign-up and activation, and run focused experiments to improve them. Tie these to clear OKRs and review the impact weekly. You’ll see perception, behavior, and economics begin to reinforce each other—and that’s when product value truly scales.
Inspired by this post on Product School.


Leave a Reply