Tag: value proposition

  • From Amplitude Adoption to Customer Value: A Leadership Model

    From Amplitude Adoption to Customer Value: A Leadership Model

    If your team can show what customers clicked but cannot explain what changed in their business, you do not have customer value evidence. You have usage evidence. That distinction becomes expensive when a renewal, expansion, or roadmap decision depends on a credible outcome.

    The fix is not another dashboard. You need an operating model that connects product behavior to workflow change, business outcomes, and a decision the customer is prepared to make. Customer value leadership is the discipline that keeps that chain intact.

    Customer value is a chain, not an adoption metric

    Amplitude has both a Head of Strategic Customer Success and a regional Head of Value for Asia Pacific and Japan. Job titles do not reveal the full operating model, but the distinction is useful. Helping a customer succeed with a product and proving the value of that success are related responsibilities, not identical ones.

    Customer success can coordinate adoption, remove account-level obstacles, and maintain the relationship. Product can build the capability and instrument its use. Analytics can show what happened inside the product. Value leadership must connect those contributions to an outcome that matters outside the dashboard.

    Use this chain when you evaluate a value claim: product capability leads to user behavior; behavior changes a workflow; the workflow affects an operational or business outcome; the outcome changes a decision. A broken link cannot be repaired by adding more detail to the links you already have.

    • Usage means an event occurred. A user opened, configured, created, or completed something.
    • Adoption means the intended users incorporated the behavior into a recurring workflow.
    • Outcome means something measurable changed in that workflow or in the operation around it.
    • Value means the outcome matters enough to affect a customer decision, such as continuing, expanding, standardizing, or changing direction.

    These working definitions prevent a common category error. A rising event count can be evidence of usage, but it does not automatically establish adoption. Adoption can be real without improving the intended outcome. Even a verified outcome may have limited value if the customer does not consider it material.

    This is why product analytics is necessary but insufficient. It is closest to the behavior layer. The business outcome may live in an implementation record, CRM, support system, finance system, operational database, or the customer’s own system of record. Your value model has to cross those boundaries without pretending that a convenient proxy is the result itself.

    Write the value contract before you instrument the dashboard

    A value contract is a testable agreement about what should change, for whom, why the product should contribute, how the change will be measured, and what decision will follow. It is not a legal contract or a sales promise. It is the shared measurement brief for product, customer success, data teams, and the customer sponsor.

    Write the hypothesis in this form: If the specified users complete the intended workflow through the product capability, the named business outcome should move in the expected direction because of the stated mechanism. The result will be judged in the named system of record, for the defined population and time window, against an agreed baseline or comparison. The named decision owner will use the result to make a specific decision.

    A practical value contract should contain:

    • Outcome owner: the customer stakeholder who cares about the result and has authority to act on it.
    • Outcome: the operational or business condition expected to change, including its unit of measurement.
    • Population: the users, accounts, workflows, or transactions included in the claim.
    • Mechanism: the reason the product behavior should produce the outcome rather than merely accompany it.
    • Behavioral signal: the observable action showing that the capability entered the intended workflow.
    • Baseline or comparison: the prior state, untreated group, alternative workflow, or other reference needed to interpret movement.
    • System of record: the place from which the outcome value will be taken.
    • Measurement window: the period in which the behavior and outcome can reasonably be connected.
    • Evidence boundary: what the available data can establish and what will remain an assumption.
    • Decision: what the customer or your product team will do if the result is confirmed, rejected, or inconclusive.

    Consider a hypothetical onboarding capability. A weak claim is: guided setup improves activation. A testable contract is: when newly assigned administrators complete configuration through guided setup, elapsed time from access to the first completed workflow should decline because fewer manual handoffs are required. Product analytics will establish the configuration path, implementation records will establish elapsed time, and the customer sponsor will determine whether the change is material to the rollout decision.

    The second version gives every participant something concrete to verify. It also exposes missing data before anyone builds an executive narrative around an attractive chart.

    Value layerQuestion to answerEvidence to inspect
    CapabilityWhat product intervention was available and correctly configured?Release, entitlement, and configuration records
    BehaviorDid the intended users perform the intended action?Events, paths, account identity, and cohort membership
    WorkflowDid the way work was completed actually change?Completion states, handoffs, errors, and process records
    OutcomeDid the relevant operational or business measure move?The agreed customer or company system of record
    DecisionWas the movement material enough to change what happens next?A documented decision from the accountable stakeholder

    Instrumentation should follow the same contract. Define the event, account and user identity rules, qualifying population, required properties, exclusions, data owner, and expected data freshness. Then identify the external outcome record and the join needed to connect it to product behavior. If identity cannot be reconciled across those systems, say so before presenting an account-level value claim.

    Match the strength of the claim to the strength of the evidence

    Customer value work loses credibility when the language becomes stronger than the measurement. A dashboard can establish that behavior occurred. It cannot, by itself, eliminate changes in customer staffing, process, demand, pricing, seasonality, implementation support, or other competing explanations.

    Use an evidence ladder and label every material claim:

    • Observed: the target behavior or outcome was measured. Safe language is that users performed the action or that the metric changed.
    • Associated: the behavior and outcome moved together in the relevant population. Safe language is that the two were associated; alternative explanations remain.
    • Contributed: behavioral data, outcome data, the proposed mechanism, and customer context support the product as a meaningful contributor. The evidence is stronger than correlation but does not isolate the product as the sole cause.
    • Causal: an experiment or credible comparison isolates the intervention sufficiently for a causal statement within the tested population and conditions.

    This classification is not academic caution. It determines what you can responsibly tell a customer, put into a business case, use in a case study, or feed into a product investment decision. Saying that evidence supports a contribution is more credible than claiming causation the design cannot prove.

    Prepare a compact evidence packet for each important value claim. Include the contract, the population and exclusions, the baseline or comparison, the product behavior, the outcome record, relevant customer context, plausible rival explanations, the evidence label, and the decision at stake. Keep raw observations separate from customer-supplied values and internal assumptions.

    This separation matters especially in financial models. An estimated labor value, assumed conversion effect, or projected risk reduction may be useful for planning, but it is still an assumption until the customer accepts the input and the outcome is observed. Marking the boundary does not weaken the case. It lets the decision-maker see which part is measured, which part is supplied, and which part is inferred.

    Three checks catch most overstatements:

    • Counterfactual check: what would probably have happened without the product behavior?
    • Segment check: does the result hold for the target population, or is an aggregate hiding materially different groups?
    • Mechanism check: can you explain how the behavior produced the outcome, and does the available evidence support that path?

    If you cannot answer a check, downgrade the claim and record what evidence would raise confidence. That creates a measurement backlog with a purpose, instead of a growing collection of dashboards nobody can use to make a decision.

    Give the value leader decision rights and a review mechanism

    A Head of Value cannot succeed as a ceremonial translator who is invited after product, sales, and customer success have already chosen their metrics. The role needs authority over the quality of value claims while leaving functional ownership where it belongs.

    I would give customer value leadership responsibility for:

    • maintaining the shared definitions of usage, adoption, outcome, value, and evidence confidence;
    • requiring a value contract before a strategic claim is instrumented or commercialized;
    • rejecting claims whose wording exceeds the available evidence;
    • convening product, data, customer success, sales, and customer stakeholders when the evidence chain crosses their boundaries;
    • turning repeated account-level evidence into portfolio learning for positioning, onboarding, and roadmap decisions; and
    • making unresolved assumptions, data gaps, and ownership gaps visible to leadership.

    I would not make the value leader the owner of every customer outcome. Product still owns the capability and its intended mechanism. Data owners remain accountable for measurement integrity. Customer success owns the adoption plan and account context. Sales owns the commercial hypothesis it introduces. The customer sponsor decides whether the outcome is material in that customer’s business.

    The value leader owns the standard connecting those responsibilities. That includes the right to say that a claim is not ready.

    Replace status-heavy value meetings with decision reviews. Require the value contract and evidence packet in advance. During the review, ask:

    • Which customer decision is this evidence meant to inform?
    • What changed in product behavior, and among exactly which users or accounts?
    • What changed in the workflow or business outcome?
    • Does the proposed mechanism still hold, or did implementation reveal a different one?
    • Which competing explanations remain plausible?
    • What confidence label does the evidence support?
    • What will product, customer success, or the customer do differently as a result?

    A review is complete only when it produces a decision, a revised claim, or a named evidence gap with an owner. A polished presentation without one of those outputs is reporting, not value management.

    Keep account truth separate from portfolio truth. Evidence from a strategic account can guide that account’s success plan. It should influence the core product only when you can explain why the underlying need or mechanism generalizes to a relevant segment. Repeated value contracts make that comparison possible because teams stop describing every customer outcome in incompatible language.

    If you use regional value leaders, make the boundary between global consistency and local adaptation explicit. Definitions, evidence labels, and claim standards should remain comparable. Customer workflows, stakeholder language, implementation conditions, and the decisions that establish materiality may require local context. Without that boundary, central teams either erase useful differences or regional teams produce claims that cannot be compared.

    Key takeaways

    • Amplitude behavior data can establish what users did; customer value leadership connects that behavior to workflow changes, business outcomes, and decisions.
    • Define usage, adoption, outcome, and value separately so an engagement metric is not mistaken for business impact.
    • Create a value contract before building the dashboard. Name the population, mechanism, baseline, system of record, evidence boundary, and decision owner.
    • Label claims as observed, associated, contributed, or causal, and use language that matches the evidence.
    • Give the value leader authority over claim quality, cross-functional evidence standards, and portfolio learning without transferring every functional responsibility into the role.
    • Run value reviews around pending decisions, not presentation updates.

    Choose a strategic account with a live renewal, expansion, rollout, or workflow decision. Draft its value contract with product, customer success, data owners, and the customer sponsor. Then audit the chain from capability to behavior, outcome, and decision. The first missing link tells you where leadership is needed; another adoption chart will not.

    References

  • Designing Awe: Intentional, Sensory-Rich Experiences to Elevate Product Leadership

    Designing Awe: Intentional, Sensory-Rich Experiences to Elevate Product Leadership

    What makes an event truly unforgettable—and what can product teams learn from it? As I listened to an illuminating conversation about crafting experiences, I found myself reflecting on how the same principles translate directly to product strategy, continuous discovery, and the day-to-day work of product management leadership.

    Listen to this episode on: Spotify | Apple Podcasts

    In this episode, the conversation explores how Petra Wille and her co-organizer Arne design experiences (not just events) at Product at Heart and their Product Leadership gatherings. From a candlelit speakers' dinner in a rosemary-covered greenhouse to a disco ball that appeared for exactly 20 seconds, the details reveal how intentional design, sensory cues, and a little bit of goofy magic help people shed their corporate armor and open up to real inspiration and connection. The parallels back to product design are unmistakable—from designing for delight and awe, to the classic question of who you're choosing to serve.

    In my role leading product teams, I see how these choices map directly to empowered product teams and the rigor of product discovery: you can’t please everyone, so you design deliberately for the right someone. That means curating for depth over breadth, and giving people agency through self-select paths—much like the "Hard Problems Club"—so niche audiences feel seen within a broader experience. It’s the same discipline we apply to product strategy and value proposition: clarity about the segment, the problem, and the kind of transformation we’re creating.

    The programming choices here are also instructive. The team designed the Product at Heart Leadership Event across one and a half days, including a farm excursion and a leadership improv workshop. Those decisions weren’t ornamental; they were part of a deliberate journey that builds safety, curiosity, and connection—precisely the conditions that help leaders generate better ideas and have the real conversations that move work forward. In product, we build that journey through thoughtful onboarding, product tours, and progressive discovery.

    I was struck by the role of sensory experience in unlocking inspiration—rosemary, zucchinis-as-instruments, and a three-meter disco ball. Too often, we conflate more features with more value; in practice, well-placed sensory or interaction details do more to create delight than another settings panel ever will. The same is true in software: microinteractions, purposeful motion, and small moments of surprise can change how people feel about your product, which changes how they use it.

    What Petra calls "serendipity moments" resonated with me. Creating space for people to shed their corporate armor and make unexpected connections is as critical in community and conference networking as it is in a product’s information architecture. When we design pathways that invite contribution—opt-in tracks, intimate circles, and unstructured time—we invite the kind of learning and collaboration most teams say they want but rarely experience by accident.

    The reflections on the World Domination Summit and the idea of designing for awe added a useful distinction: the difference between novelty and awe. Novelty is pleasant but fleeting; awe takes people out of the mundane and expands what feels possible. In product terms, awe is the moment a user realizes a new capability not only solves a task but changes how they think about their work. That’s the bar I want my teams aiming for in our roadmapping and journey mapping.

    There’s also a pragmatic lesson in investment. The details that seem extravagant are often the ones that matter most—and not because they’re expensive, but because they’re intentional. A disco ball that appears for exactly 20 seconds signals care, timing, and narrative. In product, that’s the difference between a scattered backlog and a cohesive story: choosing the few standout moments that deliver meaning, not just motion.

    For product leaders, the translation is clear: define who you serve, design for choice and delight, and invest in the details that unlock connection and insight. Whether it’s a farm excursion and leadership improv or a carefully crafted advanced-user path, the goal is the same—create conditions for real breakthroughs and lasting behavior change.

    "If we can get through that armor and shut off the business reflexes, then inspiration is more likely to hit." — Petra Wille

    Resources & Links

    Follow Teresa Torres: https://ProductTalk.org

    Follow Petra Wille: https://Petra-Wille.com

    Mentioned in this episode

    Strong Product People by Petra Wille

    Product at Heart — Speakers Dinner Leadership (see the rosemary garden!)

    Reflections on Product at Heart’s 2026 Leadership Event

    Arne Kittler of Product at Heart

    Product at Heart Conference — Hamburg 2026 (read about the Hard Problem Clubs)

    House of Beautiful Business — an event that inspired Petra and Arne's approach to sensory experience

    Petra’s recap for this year’s House of Beautiful Business in Tangier — Rituals, Rugs, and Radical Tenderness – My Experience at the House of Beautiful Business in Tangier

    World Domination Summit — founded by Chris Guillebeau; "How to live a remarkable life in a conventional world"

    Derek Sivers — mentioned as a spoken word contributor at experiential events

    Have thoughts on this episode? I’d love to hear your perspective in the comments—what “awe moments” are you intentionally designing for your teams and your users?


    Inspired by this post on Product Talk.


    Book a consult png image
  • Crafting Beloved Tech Brands: My Moonshot Marketing Playbook for the Post-LLM Era

    I spend a lot of my time asking a deceptively simple question: what does excellent marketing actually look like in 2026? From the vantage point of product leadership, the answer isn’t a spreadsheet or a channel plan—it’s a feeling. Beloved tech brands earn the benefit of the doubt, create gravity around their roadmap, and make customers proud to belong. That kind of momentum is not an accident; it’s a system.

    Here’s the hard truth I’ve learned building and scaling products: giving teams different goals creates dysfunction. When brand, demand gen, product marketing, and comms run on fragmented OKRs, you manufacture internal headwinds. “Marketing is one engine – not separate pieces.” One strategy, one narrative, one set of outcomes—expressed through different craft disciplines and time horizons.

    That unity of purpose clarifies executive roles, too. The real difference between an SVP and a CMO is scope and narrative ownership. A great CMO architects the whole system—portfolio allocation, brand architecture, integrated go-to-market strategy, and the bar for creative taste—while refusing to get dragged into decisions they should never be making (for example, approving every headline or micromanaging channel tactics). Leaders should decide the outcomes, standards, and constraints; teams should control the craft.

    On portfolio design, I run marketing like a portfolio of moonshots. You need a healthy mix: proven programs that compound, emergent bets that learn fast, and a small set of true moonshots that can change the slope of the curve. The point isn’t bravado; it’s risk-balanced exploration. If everything ships safely, you’re under-investing in differentiation. If everything is a swing for the fences, you’re not building a repeatable growth engine.

    This is where taste becomes a strategic advantage. “Ubiquity is the opposite of cool.” If you want to be beloved, you cannot treat every channel, audience, and moment as equal. Early on, selective distribution, distinctive creative codes, and tight community loops create status and meaning. Later, you scale without sanding off the edges that made the product special.

    Why do a few companies build a flywheel of momentum while others stall? They align story, product, and distribution. The product earns trust, the narrative creates aspiration, and the go-to-market strategy ensures the right customers experience both at the right time. Then perception cycles kick in—the Silicon Valley clock turns—and irrational optimism or skepticism can amplify signals. The antidote is compounding proof: consistent product shipping, community advocacy, and creative that makes people care.

    Scaling taste across an organization is teachable. I codify brand principles, narrative guardrails, and examples of “right” versus “almost right.” I replace abstract feedback with decision rubrics—what we keep, kill, or revise and why. I run recurring creative reviews with a small cross-functional council, so judgment compounds. Taste can’t be fully automated, but it can be operationalized: shared references, a story bible, and a high bar for craft that’s explicit, not mystical.

    In a post-LLM world, the fundamentals haven’t changed—but the frontier has. Generative tools supercharge iteration and research, yet the artistry never really left. You still need a point of view, a tension worth resolving, and a value proposition that’s felt, not just stated. Can taste be encoded in software? Parts of it—pattern libraries, style constraints, data-driven feedback—absolutely. But the spark that makes work unforgettable remains human: judgment, risk tolerance, and the courage to ship something that might not fit the playbook.

    That’s why telling an optimistic, yet realistic story about AI matters. Over-automation drains humanity; under-automation wastes potential. The best work pairs AI Strategy with craft leadership: LLMs for rapid exploration, humans for narrative decisions and ethical judgment. Your message should show how AI expands customer agency, not just efficiency.

    The brand-versus-growth debate is a false choice. The right story accelerates pipeline, and the right demand programs reinforce the brand. Look at Apple’s discipline around product truth and design codes, or Google Chrome’s “The Web Is What You Make of It (Dear Sophie)” for proof that emotion and utility can co-exist. Notion, Pinterest, Square, HubSpot, and Harley-Davidson show how community, identity, and product-led growth interlock when the company knows exactly what it stands for.

    When it comes to launches, I’ve learned that announcement videos full of humans, lack humanity. Overproduced gloss often dilutes the truth customers seek: what problem does this solve, how quickly can I feel the value, and why does it matter now? Real users, real context, and a crisp arc from problem to promise will outperform most theatrics.

    Practically, I architect my week to protect taste and outcomes. Early-week for strategy, portfolio reviews, and cross-functional alignment; mid-week for deep creative and product marketing work; late-week for decision clears and postmortems. I time-box “disruptive energy”—space to chase non-obvious ideas—and I guard it like any critical meeting. Without protected cycles for exploration, the urgent will always suffocate the important.

    If there’s a single takeaway: playbooks are obsolete, but the fundamentals are not. The channels change; the psychology doesn’t. Run one engine. Allocate a true portfolio. Scale taste with rigor. In the AI era, make people care. That’s how beloved tech brands are built—and how they endure.


    Book a consult png image
  • Value-Based Pricing and Packaging: A Practical Playbook

    Value-Based Pricing and Packaging: A Practical Playbook

    If your pricing discussion keeps bouncing between competitor screenshots, delivery costs, and whatever Sales thinks the market will accept, you are not yet deciding a price. You are mixing four separate decisions: the pricing model, the pricing metric, the package, and the amount charged.

    Separate those decisions and make them in the right order. You will get a pricing system that customers can understand, Finance can model, Sales can explain, and Product can improve as real behavior replaces assumptions.

    Find the value, then choose a metric that tracks it

    Value-based pricing does not mean charging the highest number a customer will tolerate. It means connecting what the customer pays to a result the customer cares about. Your costs still determine whether the offer is sustainable, but they do not explain why the buyer should purchase it.

    Start by keeping four commonly confused decisions separate:

    DecisionQuestion it answersExample output
    Pricing modelWhat overall structure determines how the customer pays?Fixed fee, access-based, usage-based, or outcome-based
    Pricing metricWhat unit causes value and charges to scale?Account, seat, transaction, workflow, or verified outcome
    PackagingWhich capabilities, limits, and service levels belong together?Plans, allowances, add-ons, commitments, and overages
    PriceHow much will you charge for the package or metric?List price, contracted rate, and discount guardrails

    Define value in the buyer’s language

    Your first customer conversations should not begin with a proposed price. Begin with the decision the buyer is trying to make and the change the buyer expects after adopting the product. Ask for recent, concrete examples rather than opinions about a hypothetical offer.

    • What event made this problem important enough to address?
    • What happens if the buyer leaves the problem unsolved?
    • Who experiences the problem, and who controls the budget?
    • What observable change would count as success?
    • How does the buyer prove that change internally?
    • What alternatives compete for the same budget, including manual work and doing nothing?
    • What causes value to grow: more users, more activity, more completed work, better results, or lower risk?

    Turn the answers into one working statement: For [buyer], the product creates value when [observable result] improves [business or operational consequence], compared with [current alternative]. This is not positioning copy. It is a testable value hypothesis that will guide the metric and package.

    If different segments complete that sentence differently, do not average the answers into a vague promise. That is evidence that the segments may need different packages, metrics, or sales motions. A support leader buying fewer escalations and an operations leader buying more throughput may use the same product while evaluating its value in different ways.

    Turn value into a billable unit

    The pricing metric is the bridge between the value hypothesis and the invoice. For an AI support agent, for example, the model can charge only for results, while the unit is an outcome counted when the agent resolves a customer query without further help. The principle is attractive because payment moves with delivered value. The definition is difficult because every ambiguous edge case can become an invoice dispute.

    Write the metric specification before selecting the price. It should define:

    • The event that starts the measurement.
    • The event that qualifies the unit as complete.
    • Any quality threshold required before it is billable.
    • Exclusions, such as tests, spam, duplicates, abandoned work, or activity outside the contracted scope.
    • Attribution when a human, an automation, and an AI system all contribute.
    • How reversals, reopened work, refunds, and corrections affect the count.
    • What the customer can see before the count appears on an invoice.
    • Which record resolves a disagreement between product analytics and billing.

    My rule is simple: if a buyer cannot understand what will be counted and predict the direction of the next bill, the metric is not ready. Evaluate every candidate against six tests:

    • Value alignment: Does an increase in the unit normally mean the customer received more value?
    • Predictability: Can the customer forecast the unit well enough to plan a budget?
    • Auditability: Can both sides inspect the same underlying events?
    • Controllability: Can the customer influence usage or set limits without abandoning the product?
    • Operational feasibility: Can your product, data, billing, and support systems calculate the unit consistently?
    • Economic alignment: Does revenue scale sensibly relative to the cost and risk of delivering the value?

    A value-based design does not always require a literal outcome metric. A proxy can be the better choice when it is closely related to value and much easier to forecast and audit. Raw activity is a poor proxy when it can grow without improving the customer’s result. A seat is a poor proxy when adding users does not increase value. An outcome is a poor metric when success cannot be defined consistently. Choose the least complicated unit that preserves alignment.

    Before charging anyone, run the proposed rules against beta or historical events. Generate shadow invoices, inspect unusually high and low accounts, and reconcile the count from the raw event through the customer-facing bill. This exposes definitional and data problems while they are still product problems rather than financial disputes.

    Make packaging do the segmentation work

    Pricing determines how revenue scales. Packaging determines which customers select which offer. A package is therefore not a decorative feature table. It is a mechanism for matching different value patterns, operating needs, and willingness to pay without creating a custom product for every account.

    1. Segment customers by how they receive value. Company size may matter, but workflow complexity, risk, required integrations, volume, and the cost of failure can be more revealing.
    2. Identify the minimum complete experience. Every package should let its intended customer reach the core outcome; a deliberately crippled entry plan teaches the market that the product does not work.
    3. Place differentiators where their value is concentrated. Advanced governance, analytics, automation, integrations, service levels, and support may matter much more to one segment than another.
    4. Choose the relationship between access and consumption. Decide what is included, what is metered, whether unused commitments expire, how overages work, and whether customers can set caps or alerts.
    5. Test whether buyers can self-select. Show realistic scenarios, ask which package they would choose, and then ask them to explain why. Their explanation is more diagnostic than the selected tier.

    Choose modular, bundled, or hybrid architecture deliberately

    Modular pricing works best when capabilities have distinct buyers, adoption paths, and measurable outcomes. It lets a customer buy one job without funding unrelated functionality. Its weakness appears as the portfolio expands: each additional module adds another decision, metric, contract term, and sales explanation.

    Bundling works better when capabilities reinforce one workflow or when customers experience the combined result rather than the individual components. It reduces buying friction, but it can hide which capability creates value and can force smaller customers to pay for breadth they do not need.

    A hybrid can separate platform access from variable value: a base package covers the shared product, an included allowance makes the initial bill predictable, and overages or commitments let revenue grow with delivered value. Use that structure only when each component answers a different commercial question. Adding a platform fee, several meters, tier thresholds, credits, and add-ons without a clear role for each one creates a billing puzzle, not a pricing strategy.

    Look for these packaging failure signals:

    • Customers repeatedly need capabilities scattered across several tiers.
    • The entry package cannot produce the outcome used to sell it.
    • The highest tier is simply every leftover feature rather than an offer for a distinct need.
    • Two packages attract the same customer for reasons your sales team cannot explain consistently.
    • The economically best package for you is visibly wrong for the customer.
    • Customers need a spreadsheet or a salesperson to estimate a normal bill.
    • Every new capability becomes a new add-on because the portfolio has no shared packaging logic.

    Do not ask customers whether they like the package names or feature list. Give them a buying situation, expected volume, required controls, and a budget constraint. Ask them to choose, identify what feels unnecessary, and state what is missing. You are testing whether the architecture supports a decision, not whether the page looks polished.

    Measure willingness to pay only after the offer is clear

    Quantitative pricing work becomes useful only after buyers understand the model, metric, and package. Otherwise, a survey can produce a precise answer to a question the market would never ask. Use qualitative discovery to establish the buyer’s language and mental model, then carry that exact framing into willingness-to-pay testing.

    Methods such as Gabor-Granger and Van Westendorp answer different questions. Gabor-Granger-style testing helps estimate purchase willingness across proposed price points. Van Westendorp-style questions help expose perceived price boundaries, including where an offer begins to feel implausibly cheap or prohibitively expensive. Neither method discovers the value metric for you, and neither produces a universally correct price.

    A defensible survey sequence looks like this:

    1. Describe the customer problem and product outcome without promotional language.
    2. State exactly how charging works.
    3. Define the billable unit, including the success condition.
    4. Show what the package contains and what it excludes.
    5. Give the respondent a realistic usage or outcome scenario.
    6. Ask about willingness to purchase at a specific price or across a controlled sequence of prices.
    7. Capture the respondent’s role, segment, buying authority, expected volume, and current alternative so the results can be interpreted rather than merely averaged.

    A demand curve is more useful than a single average. In one outcome-priced case, stated purchase willingness moved from 69% at $0.86 per outcome to 39% at $1.42. Those figures are not benchmarks for another product. They demonstrate why the decision is strategic: moving along the curve changes expected adoption as well as revenue captured from each unit.

    A simple price multiplied by the share willing to buy can identify a survey-based revenue peak, but that point is not automatically your final recommendation. It does not, by itself, include realized discounts, differences in unit volume, cost to serve, retention, expansion, sales effort, or the value of establishing market share.

    Decide what the price is meant to accomplish before interpreting the curve:

    • If the priority is adoption, you may accept less revenue per unit to reach more qualified customers.
    • If the priority is near-term revenue, you may choose a higher point while accepting a lower attach rate.
    • If the product requires substantial support or delivery cost, margin may eliminate prices that look attractive in a demand survey.
    • If the category is unfamiliar, simplicity and predictability may be more important than extracting the theoretical maximum.
    • If the product is part of a broader platform, the effect on cross-sell, retention, and portfolio coherence may matter more than stand-alone revenue.

    Treat willingness-to-pay results as stated intent, not observed buying behavior. Segment the curve before using it. A blended result can conceal a high-value segment with strong demand and another segment that should not be targeted at all. It can also overstate confidence when respondents use the product but do not own the budget.

    Convert the demand curve into a commercial model

    The survey narrows the plausible range. The commercial model tells you whether an option can survive contact with actual customers, contracts, usage, discounts, and delivery costs. This is where a promising price becomes an operating plan.

    1. Set a candidate list price. Choose a point that reflects the demand curve and the strategic objective, not just the highest theoretical revenue index.
    2. Estimate realized price. Apply expected discounts, negotiated rates, credits, promotions, and channel effects. A list price that relies on constant exceptions is not the real price.
    3. Project units by segment. Use beta or observed usage to estimate outcomes, transactions, seats, or another billable quantity. Preserve the distribution instead of relying only on the mean.
    4. Model attach rate. Estimate what share of eligible customers will buy in conservative, base, and upside cases. Connect each case to an explicit assumption rather than a general level of optimism.
    5. Calculate customer and portfolio revenue. For a metered product, combine realized unit price with expected annual units. Then roll the result across eligible customers and segments.
    6. Include delivery economics. Subtract variable delivery costs and account for service obligations that grow with usage. For AI products, inspect how model, infrastructure, support, and exception-handling costs behave at both low and high volume.
    7. Connect the recommendation to the operating plan. Show the implications for customer count, adoption, annual recurring revenue, gross margin, expansion, and any dependencies on the rest of the portfolio.

    Stress-test the assumptions that can break the plan

    A single base case hides the shape of the risk. Change one major assumption at a time so decision-makers can see what the recommendation depends on.

    • Discount sensitivity: What happens if realized price is materially below list price?
    • Volume sensitivity: What happens when customers generate far fewer or far more units than the average?
    • Attach sensitivity: How much adoption is required before the product covers its fixed investment?
    • Cost sensitivity: Does high usage improve gross profit, or does the delivery cost scale almost as quickly as revenue?
    • Concentration risk: Does the forecast depend on a small number of unusually large customers?
    • Invoice volatility: Can normal changes in behavior create bills that customers will perceive as unpredictable?
    • Metric leakage: Are valuable events going unbilled, or are low-quality events being counted as successful outcomes?

    Inspect account-level scenarios, not just portfolio totals. A model can produce acceptable average revenue while creating obviously unreasonable bills for a small customer, a seasonal customer, or a high-volume account. Those tails often become the discount exceptions, support escalations, and renewal problems that the average concealed.

    Make the recommendation easy to challenge

    The approval memo should contain the decision and the logic required to dispute it. Include:

    • The buyer, value hypothesis, model, metric, and metric definition.
    • The proposed packages and the segment each package is designed to serve.
    • The willingness-to-pay range and how it changes by segment.
    • The recommended list price, expected realized price, and discount guardrails.
    • Conservative, base, and upside forecasts for adoption, revenue, and margin.
    • The most sensitive assumptions and the evidence supporting them.
    • Alternatives considered, why they were rejected, and what evidence would reopen them.
    • Operational dependencies across Product, Research, Data, Finance, Engineering, Sales, Customer Success, Support, and billing.

    Cross-functional review is not ceremonial. Finance can expose a margin or forecasting problem. Engineering can show that the proposed event cannot be measured reliably. Sales can identify a model buyers cannot procure. Support can anticipate disputes. Product can determine whether the metric rewards the behavior the product is supposed to create. Resolve those conflicts before the price becomes a public promise.

    Launch pricing as a controlled learning system

    Approval is the end of price design and the start of price operations. Customers experience pricing through entitlements, usage counters, contracts, invoices, renewal conversations, and support responses. A sensible strategy can fail if those surfaces disagree.

    Complete the billing path before charging

    • Write a billing specification that maps raw events to billable units and contract terms.
    • Verify entitlements, included allowances, overages, caps, credits, and exception handling.
    • Run parallel or shadow invoices and reconcile them from event log to customer-facing total.
    • Give customers a usage view that uses the same definitions and timing as billing.
    • Enable Sales with qualification rules, scenario-based pricing examples, and clear discount authority.
    • Prepare Customer Success and Support to explain the metric, diagnose discrepancies, and escalate genuine billing errors.
    • Instrument proof of value next to proof of usage so the commercial conversation is not reduced to a meter.
    • Communicate the effective date, affected products, counting rules, package changes, and available customer controls in plain language.

    Do not alter existing charges on the assumption that a product announcement overrides a contract. Review contractual commitments, renewal timing, migration rules, and customer communications before changing what an existing customer pays. An informal migration can create financial disputes and destroy trust even when the new model is better designed.

    Use behavior to diagnose the next problem

    Instrument the system from the first launch cohort. Review both commercial performance and customer experience:

    • Eligibility, attach rate, and package selection by segment.
    • List price, realized price, discount frequency, and exception rates.
    • The full distribution of billable units per customer, not just the average.
    • Revenue and gross margin by segment, package, and usage band.
    • Invoice variance and how accurately customers forecast their charges.
    • Billing questions, disputes, credits, and metric-definition escalations.
    • Activation, continued usage, achieved outcomes, expansion, contraction, renewal, and churn.
    • Sales-cycle friction caused by the model, procurement requirements, or package complexity.

    Use each signal to choose the next investigation. Low attach can point to weak qualification, unclear value, the wrong package, or the wrong price. Strong attach followed by low activity can indicate an onboarding or product-value problem. High activity with poor margin calls for an economics or discount review. Frequent disputes usually justify inspecting the metric definition, event quality, and customer visibility. These patterns are diagnostic prompts, not causal proof; pair the numbers with targeted customer and GTM conversations.

    Review the architecture, not only the number, when the product expands. Modular outcome pricing can work cleanly while each capability has a distinct result. As a platform adds capabilities, buyers may face several meters, overlapping modules, and an invoice they cannot predict. That is a signal to reconsider how access, bundles, allowances, and outcomes fit together, not merely to adjust every component independently.

    Reopen the pricing system when customers cannot forecast bills, new capabilities do not fit an existing package, discount exceptions become routine, sales explanations diverge, gross margin behaves differently from the model, or the value customers receive is no longer represented by the metric. Pricing should be treated as a living system informed by research, customer behavior, and go-to-market learning, not a launch artifact that becomes untouchable.

    Key takeaways

    • Make four decisions separately: pricing model, pricing metric, package, and price.
    • Define value using an observable customer result before asking what anyone will pay.
    • Choose a metric that aligns with value but remains predictable, auditable, operationally feasible, and economically sound.
    • Design packages around distinct value patterns and buying needs, not an arbitrary progression of feature counts.
    • Use willingness-to-pay work to build a demand curve, then combine it with usage, attach, discounts, and margin in a commercial model.
    • Validate the complete billing path before launch and use observed behavior to improve the system afterward.

    If your team is stuck debating the number, stop the meeting and complete six lines first: buyer, customer outcome, billable unit, measurement proof, package boundary, and commercial assumptions. Any line you cannot defend is the next research or modeling task. Put a price on the page only after those six lines tell one coherent story.

    References

  • Outcome-Based Pricing That Delivers: Pay $10 Only for Qualified Leads with Fin for Sales

    Outcome-Based Pricing That Delivers: Pay $10 Only for Qualified Leads with Fin for Sales

    Our outcome-based pricing model hinges on one principle: you pay when Fin delivers value.

    As Fin takes on new roles, that principle doesn’t change, but the definition of value does.

    Fin for Sales qualifies leads, engages prospects, and routes high-intent buyers to your sales team. The value it creates isn’t a resolved query, but a pipeline of qualified opportunities. So we price accordingly: $10 per qualified lead. And you, the customer, define what “qualified” means, not Fin.

    This is the first outcome-based pricing model for an AI Agent for sales. Here’s why I believe it’s the right approach and how I’ve seen it change the way teams think about SaaS pricing and ROI.

    Over the years, I’ve learned that the fastest way to earn trust with sales and finance leaders is to align pricing with outcomes they actually report on. The core finding from our research was unambiguous: zero buyers preferred paying for activity. They wanted to pay for results.

    That insight shaped how we priced Fin for its service role, $0.99 per resolution, where a resolution means the customer’s issue is fully solved without human intervention. More recently, we evolved that model to outcomes, reflecting the broader ways Fin delivers value across complex workflows. We believe pricing should be aligned with value delivery, and the vendor should carry risk when the product doesn’t perform. In sales, the best unit of value is pipeline.

    Most sales teams today are overwhelmed by leads. Early in my career, I watched reps spend hours chasing form fills that looked promising but went nowhere. That experience cemented a lesson I still use: volume is vanity; qualification is sanity.

    Ensuring the right opportunities promptly reach your sales team is what makes a difference. When a prospect visits your site, engages with Fin, answers qualifying questions, and is directed to a sales rep, Fin is identifying whether the opportunity is worth your team’s time and delivering value.

    Charging per conversation would penalize businesses for every curious visitor who asks a question but isn’t a buyer. And charging per token, well, that’s always been a model that protects the vendor, not the customer.

    We needed a metric that captures the actual value Fin creates in a sales context: qualified leads.

    The purest version of outcome-based pricing for Fin’s sales role would be a percentage of closed revenue. Fin qualifies the lead, a rep closes the deal, and we take a cut. On paper, it looks elegant; in practice, I found it breaks down for two reasons that matter to operators.

    First, attribution. Between the moment Fin qualifies a lead and the moment a deal closes, dozens of things can impact the final result. The quality of human-led demos can differ, products can have outages, prospects’ budgets can get cut. Tying Fin’s price to the final outcome holds it accountable for variables entirely outside its control.

    Second, measurement. To track closed revenue, we’d need deep integration into every customer’s CRM, tracking each opportunity from qualification through to close. That’s a significant implementation burden that slows time to value, which is the opposite of what we want.

    So we asked: what’s the most honest proxy for the value Fin delivers, where Fin is clearly the one creating it?

    A qualified lead is that proxy. It represents the moment Fin has done its job. It has engaged the prospect, gathered the relevant information, evaluated them against your criteria, and determined they’re qualified. Everything up to that point is Fin’s work. Everything after it is the rep’s. At $10 per qualified lead, the pricing reflects this boundary.

    There are two key components to how this pricing model works.

    First, the customer defines success. With Fin’s sales role, the customer sets their own qualification criteria based on their business context. A company with high average contract values might set a lower bar because they can’t afford to miss anyone. A company where rep time is scarce and deal sizes are smaller might set a much higher bar, filtering aggressively to only surface the most promising prospects. The criteria flex to match the business.

    Second, the economics are different by design. As a Customer Agent, Fin can switch between roles like sales and service. So if you’ve deployed Fin for Sales, it can still handle support queries like prospects asking a product question. Those queries are charged at $1 per resolution, consistent with our service pricing. Disqualifications, where Fin determines a prospect doesn’t meet the criteria, are also $1. The $10 price point for qualified leads reflects the higher value of pipeline creation compared to issue resolution.

    The ROI speaks for itself. Early customers are reporting significant returns using Fin for Sales. One shared a perspective that mirrors what I hear in executive QBRs:

    “I would say it’s at least 10 times the value. You’re now giving the business exactly what it needs as opposed to just activity. We say this expression in sales leadership all the time – ‘I don’t pay my sales team for activity. I pay them for results.’ I want my AI engine to be the same way.”

    When you compare the cost of a qualified lead from Fin against the fully loaded cost of an SDR—salary, benefits, tooling, ramp time—the economics are compelling. For many businesses, particularly those that never had SDRs in the first place, Fin for Sales isn’t just replacing headcount, but creating an entirely new capability that wasn’t economically viable before.

    This pricing model came from extensive customer research—qualitative interviews and quantitative studies—exploring how buyers want to pay for AI in a sales context. We tested multiple concepts: per-conversation, per-token, per-seat, revenue share, and per-qualified-lead. The research consistently pointed to outcome-aligned pricing as the preferred model, with the qualified lead emerging as the metric that best balances value alignment, measurability, and practical implementation.

    Outcome-based pricing is still rare in AI, but we think that will change. For Sales Agents, we’re the first to do it. Transparency is part of the model. If you understand why we price the way we do, you can evaluate whether it works for your business.


    Inspired by this post on The Intercom Blog.


    Book a consult png image
  • Mastering Product Marketing with Amplitude Analytics: Proven Playbooks for Sustainable Growth

    Mastering Product Marketing with Amplitude Analytics: Proven Playbooks for Sustainable Growth

    I’m continually refining how we use analytics to elevate product marketing, and this collection brings together my most effective playbooks for driving measurable growth with Amplitude Analytics. If you’re focused on product-led growth, you’ll find pragmatic guidance on translating behavioral analytics into sharper positioning, stronger activation, and durable retention.

    In my day-to-day work, I connect product strategy with go-to-market strategy by grounding every narrative in real user behavior. That means using event data to validate our value proposition, mapping journeys to uncover friction, and aligning product positioning with the moments that actually matter in-app. The outcome is a marketing engine that mirrors how customers discover, adopt, and expand within the product.

    Activation and retention are where outcomes are won or lost. I detail how to set leading indicators for user activation, instrument key behaviors, and run retention analysis that distinguishes healthy engagement from noisy usage. You’ll see how I turn cohort insights into precise messaging, targeted onboarding, and experiments that compound over time.

    Cross-functional execution is essential, so I share ways to operationalize a unified analytics platform across product, marketing, and customer success. With shared metrics, product trios can move faster from product discovery to launch, and marketing can scale campaigns that reflect what’s truly driving adoption. This tight loop reduces guesswork and increases our hit rate on both features and narratives.

    If you’re building a modern product marketing function, these essays and guides will help you move from intuition-led storytelling to evidence-backed strategy. Dive in to learn how I connect behavioral analytics to positioning, packaging, and roadmap choices—so every campaign and release ladders up to meaningful customer outcomes and sustainable growth.


    Inspired by this post on Amplitude – Perspectives.


    Book a consult png image
  • Inside My Product Marketing Playbook: Amplitude Analytics Tactics That Drive PLG Wins

    Inside My Product Marketing Playbook: Amplitude Analytics Tactics That Drive PLG Wins

    I’ve curated a focused set of product marketing insights that zero in on what actually moves the needle—turning data into decisions. You’ll find a special emphasis on Amplitude Analytics, because its behavioral analytics foundation makes it easier to translate product usage into clear messaging, sharper positioning, and measurable growth.

    In my day-to-day as a product leader, I’m constantly bridging the gap between product discovery and go-to-market strategy. The best outcomes come when we connect quantitative signals to narrative: using behavioral analytics to inform the value proposition, refining product positioning with cohort trends, and driving product-led growth with activation and retention insights.

    Here’s how I put this into practice. I start with user activation and retention analysis to identify the few behaviors that predict long-term value. Then I run tightly scoped A/B testing to validate messaging and in-product prompts that nudge those behaviors. When the numbers move, I translate wins into a consistent story—one that sales, success, and marketing can all rally around.

    One pattern keeps repeating: clarity beats complexity. Instead of piling on more features, I focus on the minimum, verifiable set of behaviors that correlate with outcomes. That discipline makes it easier to craft a crisp value proposition, streamline go-to-market strategy, and accelerate feedback loops between product, design, and marketing.

    As you explore this collection, expect practical playbooks over platitudes. You’ll see how to apply Amplitude Analytics to uncover hidden friction, validate hypotheses faster, and operationalize product-led growth motions that compound over time. My goal is to help you move from interesting dashboards to decisive actions that strengthen your roadmap and your revenue.

    If you care about building empowered product teams that learn continuously, you’ll feel at home here. Dive in, borrow what works, and adapt the rest to your context—then measure it, iterate, and share the wins with your team.


    Inspired by this post on Amplitude – Best Practices.


    Book a consult png image
  • Kill Your Darlings: Why I Sunset ‘Successful’ Products to Fuel Real Portfolio Growth

    Kill Your Darlings: Why I Sunset ‘Successful’ Products to Fuel Real Portfolio Growth

    There’s a moment in every product leader’s career when the bravest decision isn’t to build—it’s to stop. That’s why the “Kill Your Darlings” theme resonated so strongly with me. In this episode of All Things Product, Teresa Torres and Petra Wille dig into the courage and craft it takes to sunset products that look successful on the surface yet quietly block your path to meaningful growth. As someone accountable for portfolio outcomes, I’ve learned that disciplined endings are often the catalyst for exceptional beginnings.

    Listen to this episode on: Spotify | Apple Podcasts

    The heart of the conversation is that uncomfortable middle ground between obvious failure and runaway success: products that are profitable, loved by customers, but fundamentally flatlining. Teresa shares candid stories from her own business, including a decision to cut 40% of revenue on purpose. I’ve been there—choosing to retire a “working… kind of” product to free up discovery capacity felt risky in the moment, but it created the focus we needed for durable growth.

    Here’s the trap: some traction can be more dangerous than no traction at all. Early fans are not the same as durable product–market fit, and “stable but not growing” can lull leaders into maintaining instead of learning. Every hour of design, engineering, and go-to-market attention that props up a flatlining product is an hour not invested in the next breakthrough—an opportunity cost that rarely shows up on a dashboard, yet compounds month after month.

    From a portfolio perspective, this is continuous discovery in action. If we want empowered product teams to tackle meaningful outcomes, we have to protect their capacity from zombie work. That means setting clear thresholds for when we double down, shift strategies, or sunset—before attachment and inertia take over. When I’ve institutionalized this discipline, our throughput of high-quality bets increased, and our confidence in what not to do became a strategic advantage.

    Organization design can make sunsetting harder than it needs to be. Dedicated, long-lived teams are fantastic for compounding capability, but they also create emotional and structural ties to specific products. Petra’s point lands: leaders need explicit sunsetting conversations and a portfolio decision-making cadence that sits one level above teams. In my org, we treat sunsetting as a strategic reallocation—not a verdict on a team’s talent—so people are celebrated for learning, not punished for outcomes outside their control.

    Killing profitable products can be the right strategic move when the growth ceiling is clear and the opportunity cost is high. I’ve chosen to “burn the ships (on purpose)” more than once—retiring add-ons that generated reliable revenue but diluted our value proposition and spread discovery thin. Yes, it stings in the quarter you do it. But it’s astonishing how quickly focus restores momentum when you create intentional space for what’s next.

    Practically speaking, I make sunsetting easier and less traumatic by operationalizing it: Regular portfolio reviews focused on outcomes and opportunity cost; a visible “sunsetting” column so everyone sees what’s on the table; the Horizon (H1 / H2 / H3) model to balance core, adjacent, and transformational bets; and making portfolio decisions one level above teams to avoid local optimizations. Add explicit exit criteria and success metrics for endings, the same way we set entry criteria for new bets.

    Another theme I appreciated is designing for the right customers. Teresa highlights intentionally limiting access and pricing to work with customers who show agency and commitment. I’ve applied the same principle: when we’re clear about who we serve and who we don’t, our product–market signal sharpens, churn narratives simplify, and roadmaps get crisper. Focus is a growth strategy.

    If you’re leading a product portfolio, running discovery, or wrestling with a product that “works… kind of,” this conversation is permission to act. Product–market fit isn’t binary, and mediocre success can be the most dangerous place to stay. Sunsetting is a portfolio decision, not a team failure; teams shouldn’t be punished for reaching the end of a product’s natural lifecycle. If experimentation isn’t in your DNA, killing products will always feel traumatic—so make space for it intentionally, not passively.

    Key moments and themes worth bookmarking: 00:00 – Why “kill your darlings” matters; 04:30 – The dangerous middle ground; 09:30 – The opportunity cost of “okay” products; 14:30 – Sunsetting in product organizations; 19:00 – Real examples of killing revenue streams; 28:00 – Designing for the right customers; 33:30 – Burn the ships (on purpose); 38:00 – Making sunsetting easier with Regular portfolio reviews, a visible “sunsetting” column, the Horizon (H1 / H2 / H3) model, and making portfolio decisions one level above teams; 46:00 – Normalizing product lifecycles.

    Resources & Links:

    Follow Teresa Torres: https://ProductTalk.org

    Follow Petra Wille: https://Petra-Wille.com

    Mentioned in this episode:

    Ways to Work with Petra Wille

    Product at Heart

    CDH Membership by Teresa Torres

    Product Talk by Teresa

    Product Talk Academy by Teresa

    Enduring Ideas: The three horizons of growth

    Join the Conversation:

    Have thoughts on this episode? Leave a comment below.

    Full Transcript

    Full transcripts are only available for paid subscribers.


    Inspired by this post on Product Talk.


    Book a consult png image
  • Scaling Enterprise Sales from $0 to $3.5B: CRO Lessons, MEDDIC Mastery, and GTM Truths

    Scaling Enterprise Sales from $0 to $3.5B: CRO Lessons, MEDDIC Mastery, and GTM Truths

    I’ve led product organizations through multiple growth chapters, and the pattern is always the same: the tighter the alignment between product, sales, and marketing, the faster you scale. Reflecting on the journey of Chris Degnan — the first sales hire at Snowflake who spent 11 years helping scale the company from zero to $3.5 billion in revenue as its CRO while partnering with four different CEOs — I’m struck by how consistently the fundamentals win. The playbook isn’t mysterious; it’s disciplined execution, ruthless clarity, and a go-to-market strategy that matures with each revenue stage.

    At $10M ARR, the CRO role is hands-on and founder-adjacent. You’re close to the product, running point on key deals, pressure-testing messaging, and building credibility with early customers. By $1B+, the job is organization design: segmentation, international expansion, forecast accuracy, enablement, recruiting, and cross-functional orchestration. The shift is from deal quarterback to system architect — standing up repeatable, auditable processes that produce reliable outcomes across regions, segments, and industries.

    Sales leaders who can’t sell the product themselves don’t last. Whether you sit in product management leadership or run the field, you need to master discovery, speak the customer’s language, and translate use cases into value. That also means getting fluent in solutions engineering — understanding integrations, data paths, security, and the operational realities buyers live with. I’ve found this hands-on competence to be the fastest way to earn trust internally and externally, and to keep product strategy grounded in market truth.

    The MEDDIC methodology is the foundation for every durable sales org — and, frankly, a founder’s best insurance policy. MEDDIC forces alignment on qualification criteria, from Metrics to Economic Buyer to Decision Process and Identifying Pain. When product and sales both operate to this standard, roadmap bets improve, marketing targets sharpen, and win rates climb. It’s not paperwork; it’s pattern recognition at scale.

    High-output CROs obsess over the right numbers. Pipeline coverage by segment and stage; conversion rates through each gate; sales cycle length by use case; average selling price and discount discipline; consumption predictability when you have consumption SaaS pricing; and post-sale expansion velocity. The art is deciding which two or three metrics are the organization’s true north at a given stage — then designing enablement, compensation, and operating cadence around them.

    On operating cadence, the week in the life at scale is predictable for a reason. Forecast reviews that surface risk early. Deal reviews that coach to MEDDIC depth, not activity theater. Enablement blocks to uplevel managers and ICs. Recruiting time — always. Customer roadshows to refine value proposition and product positioning. And standing meetings with product, marketing, and finance to keep the GTM motion, roadmap, and unit economics in sync.

    Compensation is a force multiplier or a silent saboteur. Keep it simple, consistent, and aligned to the current motion. Early on, weight new logo acquisition and land quality; as you mature, balance new business with expansion, multi-product adoption, and healthy consumption. Guardrails matter — cap over-discounting, reward multi-threading, and avoid plans that create end-of-quarter cliff behavior. The best plans reinforce the behaviors you want your culture to scale.

    Technical CEOs often underestimate how much narrative, segmentation, and process discipline great GTM requires. The handoff from founder-led GTM to sales-led growth is where many teams stall. My rule: prove one repeatable motion in one segment before you add complexity. Codify the buyer’s journey, instrument the funnel, and make sure product strategy and enablement move in lockstep.

    Culture sets the ceiling. You have to find the fakers, manage-uppers, and passengers quickly — people who look busy but don’t move pipeline, who talk big but avoid accountability, or who ride the momentum of others. The mantra that has saved me endless time: “When there’s doubt, there’s no doubt”. Move fast, but with humanity; be clear on expectations, coach hard, and when it’s not a fit, make the change before the team does it for you.

    Feedback is the operating system of a high-performing org. Leaders at every level need to be coachable — on message discipline, on forecast rigor, on how they develop people. I’ve benefited from straight talkers who hold a high bar, and I try to pay that forward. The fastest way to raise organizational IQ is to institutionalize feedback loops across sales, product, and marketing — from post-mortems to win-loss analysis to field-sourced roadmap reviews.

    What separates exceptional ICs from the rest? Hunger, intellectual honesty, and a builder’s mindset. They qualify hard, align to customer metrics early, multi-thread to power and value, and partner tightly with solutions engineering. They don’t hide from gaps; they surface them, and they know exactly what they need from product, marketing, and leadership to win.

    Executive teams that scale share a few traits: crisp segmentation decisions, single-threaded ownership for outcomes, and healthy conflict that resolves into commitment. Dysfunction, by contrast, looks like metrics roulette, opaque decision-making, and a tolerance for exceptions that become precedent. Make the rules explicit and the exceptions rare.

    Leaders like Frank Slootman have popularized intensity, speed, and focus — and there’s real power there when paired with clarity and data. The lesson I carry forward: move fast on people decisions, keep the message simple, and measure what matters. Equally important is knowing where that approach can backfire — when speed outruns learning, or when pressure erodes cross-functional trust. The best operators balance urgency with systems thinking.

    Most AI companies will face a go-to-market reckoning. Model quality won’t save a weak motion. The winners will articulate a hard-nosed ROI, solve specific workflow pain, address data governance and security head-on, and show measurable lift — not demo dazzle. In other words, the same fundamentals apply; the stakes and scrutiny are just higher.

    If you’re building or rebuilding your revenue engine, start here: define your ideal customer profile and segmentation with ruthless clarity; adopt MEDDIC and teach it across product and sales; align compensation to today’s motion; instrument the funnel and inspect it weekly; and cultivate a culture where feedback is fuel. Do that, and the path from $0 to $3.5B stops feeling like mythology — and starts looking like math.


    Book a consult png image
  • Inside Partner Product Marketing: Lessons that Elevate Go-to-Market and Product-Led Growth

    Inside Partner Product Marketing: Lessons that Elevate Go-to-Market and Product-Led Growth

    I’ve learned that the most effective partner product marketing is less about decks and more about decisions. When I collaborate with partner product marketing managers, we translate complex capabilities from a unified analytics platform into crisp, outcome-led narratives that customers can act on. This is where product positioning and go-to-market strategy intersect to create momentum for product-led growth.

    In my experience, the strongest partner product marketing managers operate like solution orchestrators. They align value propositions across partners, clarify the problem-solution fit, and articulate competitive differentiation without drowning teams in feature lists. By anchoring messaging in clear customer pains and measurable gains, they help everyone—from solutions engineering to sales—tell the same story with confidence.

    My playbook starts with outcomes. We define the “why” in terms customers care about, then quantify it with retention analysis, user activation, and time-to-value. That evidence shapes positioning, enables tighter points of parity and differentiation, and ensures our value proposition resonates in market. The result is faster alignment and fewer cycles spent debating messaging without data.

    Cross-functional execution makes or breaks the strategy. I partner closely with solutions engineering to validate solution patterns, and with sales to balance sales-led motions alongside product-led growth. Strong stakeholder management keeps discovery loops tight: we capture objections early, refine narratives quickly, and reduce friction across the funnel.

    On the tactics side, I rely on A/B testing to de-risk bold messaging changes and to optimize in-app guides and product tours. We set a minimum detectable effect upfront, instrument journeys with Amplitude analytics, and iterate quickly. This gives the team statistical confidence while keeping speed high—especially when refining narratives for complex partner solutions.

    Ultimately, great partner product marketing illuminates the shortest path from capability to customer value. When we pair disciplined positioning with data-driven learning, we strengthen our go-to-market strategy and build durable competitive advantage. That’s how we turn strong solutions into market-leading stories that win—and keep—customers.


    Inspired by this post on Amplitude – Best Practices.


    Book a consult png image
  • Deeper AI Integration, Clearer ROI: How Mature Deployments Redefine Support Economics

    Deeper AI Integration, Clearer ROI: How Mature Deployments Redefine Support Economics

    Over the last year, I’ve had the same conversation with a lot of support leaders.

    They’ve deployed AI and are seeing initial efficiency gains, but want to push beyond these early results and achieve meaningful transformation.

    When AI is first introduced, the gains show up quickly. Teams resolve higher volumes of queries, free up capacity, and deliver faster responses. But the real opportunity for impact extends well beyond those initial wins. As AI becomes more deeply integrated into support operations, taking on harder, more complex work, those results compound, new ways to create and measure value open up, and the economics of support change entirely. That shift is where I spend most of my time with leaders—turning early efficiency into durable business value.

    This sits at the heart of “The 2026 Customer Service Transformation Report.” In this reflection, I explore how deeper integration compounds impact and why that makes business value easier to articulate across the organization—especially to finance and product peers who need to see outcomes, not just output.

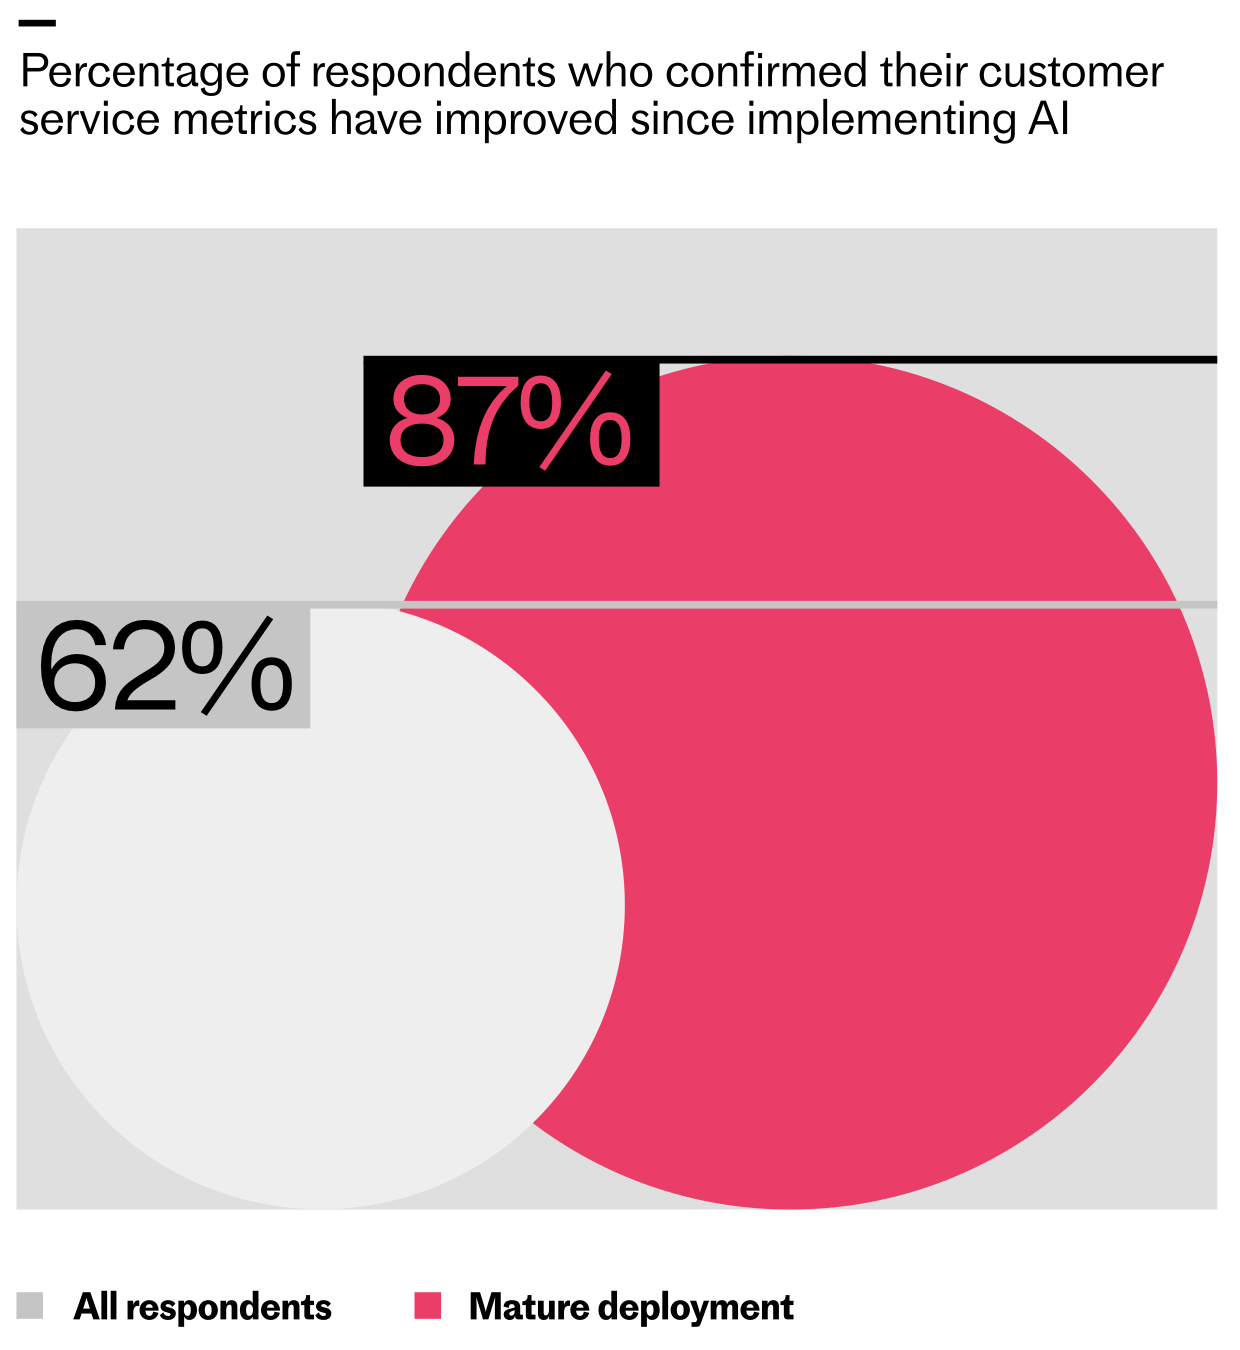
    The teams going deeper are seeing higher returns. The research shows that 62% of support teams have seen their customer service metrics improve since implementing AI, with early wins showing up most clearly in speed and efficiency. But for teams that have reached mature deployment (where AI is fully integrated into operations) that number jumps to 87%.

    Infographic of customer service teams measuring AI ROI by deployment stage: 70% mature, 60% scaling, 43% initial, 35% exploring, shown as donut charts, illustrating the deployment gap.
    As AI programs advance, measurement confidence surges. This chart shows how ROI tracking rises from 35% in exploring to 70% in mature deployments—evidence of a widening execution gap in customer service.

    The same pattern holds for the ability to measure ROI. Among teams in early exploration, just 35% say they can measure their return on AI investment, but for teams at the mature deployment stage, that rises to 70%. In my experience, this is the moment the conversation shifts from “is AI working?” to “how much leverage are we creating?”

    As AI becomes more embedded in support workflows, what teams choose to measure starts to change. In the early stages of deployment, ROI is typically understood through improved customer response times, lower cost to serve, and freeing up capacity. Teams focus on how much time AI creates and whether it’s relieving pressure on the support organization. These signals help validate that the system is working, but they say little about how that capacity is ultimately used.

    As deployments mature, measurement starts to reflect a different intent. Instead of stopping at time saved, teams look at where that capacity is reinvested—into higher value customer work and revenue-generating activities. ROI becomes less about relief and more about leverage. I encourage teams to set targets for capacity redeployment and tie them directly to activation, retention, and expansion outcomes.

    The report data shows this clearly. Across all maturity stages, the most commonly cited measure of ROI is "time freed up that the support team can use to focus on value-adding activities for customers." But at mature deployment, that signal intensifies, with 73% of teams citing it, compared to 56% at early exploration.

    Comparison bar chart on measuring ROI of AI in customer service, showing mature deployments outperform initial: 73% vs 59% for customer value time, 56% vs 34% for revenue-focused time.
    Mature AI deployments reveal clearer ROI: teams report more time freed for value-adding customer work (73% vs 59%) and more hours redirected to revenue-generating tasks (56% vs 34%) than initial rollouts.

    What’s also interesting is that 56% of mature teams say freed capacity is being directed toward revenue-generating activities, up from 34% at initial deployment. That’s a powerful indicator that AI is shifting from a cost narrative to a growth narrative.

    The result is a shift in economic intent: from measuring what AI saves to demonstrating how the capacity it creates is reinvested to drive growth. As a product leader, I anchor this conversation in outcome-based metrics and clear counterfactuals: what would it have cost to deliver the same experience without AI?

    As AI takes on more work, the question moves from “does it save money?” to “how does it change the economics of support?” Legacy support economics were built for linear growth: more customer tickets meant more headcount, more outsourcing, and more software costs. Success was measured through containment—the number of queries that didn’t reach human agents. These models worked when volume and effort were tightly linked, but AI doesn’t scale linearly, and it needs to be evaluated differently.

    To sustain AI investment and expand its impact, teams need to move beyond cost-cutting narratives and build a clearer case for business value. When done right, AI goes far beyond improving support efficiency. It rewires the financial model, breaking the link between support costs and revenue growth, and turning support into a contributor to customer activation, retention, and lifetime value. This means treating your AI Agent as a new workforce capability that changes how your support function creates and captures value. Here’s what value looks like in an AI-first model:

    Two-panel chart on customer service: before AI, support volume and team size rise together; after AI, volume continues upward while team size levels off or declines, indicating ROI from automation.
    Deeper AI integration decouples growth from headcount. This split chart shows support volume surging while team size plateaus, revealing how automation unlocks scale, reduces costs, and makes ROI easier to prove.

    Human productivity: Your team focuses on more strategic areas, not the queue.

    System improvement: Every resolved query makes the system smarter.

    Revenue influence: Support becomes a lever for activation, retention, and growth.

    Organizational agility: You scale service without scaling headcount.

    Neon green hero graphic reading 'The 2026 Customer Service Transformation Report', with subhead 'The AI deployment gap is widening' and a black 'Get the report' button over a bar-chart pattern.
    Leaders are racing ahead with real AI in support. Explore the 2026 Customer Service Transformation Report to see where deployment is stalling, benchmark your team, and get practical steps to scale automation that delights.

    How does this look in practice? Intercom offers a compelling example with Fin. What started as a focused effort to improve their customer support experience has become one of the clearest illustrations of what happens when AI is fully embraced across an organization.

    Since 2022, Fin has helped Intercom absorb more than a 300% increase in customer demand while improving the consistency of delivery—including supporting new routes into support for trial customers and website visitors. Today, Fin is involved in 97% of their customers' conversations. Of those, it resolves 83.5% end-to-end, putting their overall automation rate at 81%.

    That depth of deployment allowed Intercom to scale service without scaling headcount. Without Fin, they would have needed at least 100 additional support teammates to meet rising demand and service standards.

    As Fin took on the majority of day-to-day volume, the human support team shifted toward consultative work—helping customers adopt Fin more deeply, succeed faster, and unlock more value from the platform. Intercom now tracks metrics like “direct revenue generated” and “expansion revenue influenced” to understand the impact of these consultative support activities. This repositioned support from a cost center to an active contributor to long-term growth.

    The throughline from The 2026 Customer Service Transformation Report is that deployment depth makes a significant difference. Teams that are investing in deeply integrating AI are reshaping how support scales and contributes to growth. Value becomes clearer as AI takes on more work, and support leaders can articulate that value to the rest of the business.

    The gap between these teams and those still in the early stages is widening. A select group of pioneers are setting a new bar for what AI-powered customer service can deliver, and understanding what they’re doing differently is the first step toward closing that gap. If you want to dive deeper into the data and frameworks, you can download the report here: https://www.intercom.com/customer-transformation-report?utm_source=blog&utm_medium=internal&utm_campaign=20260128-report-owned-2026cstransformationreport&utm_content=chapterseries_2


    Inspired by this post on The Intercom Blog.


    Book a consult png image
  • 7 Proven Steps to Win Stakeholder Buy-In with Clarity, Data, and Lasting Trust

    7 Proven Steps to Win Stakeholder Buy-In with Clarity, Data, and Lasting Trust

    Buy-in isn’t a single meeting; it’s a designed journey. Over the years leading product strategy at HighLevel, I’ve learned that the fastest way to earn durable support is to reduce uncertainty, align on outcomes, and create visible momentum. Explore how to get buy-in from stakeholders with practical strategies, clear communication tips, and proven methods used by the best. Here’s the 7-step playbook my teams and I rely on to move from idea to aligned action.

    Step 1 — Anchor on outcomes, not outputs. I start by writing a crisp problem statement, the target customer, and the measurable outcome tied to our North Star metric. I translate this into outcomes vs output OKRs so every stakeholder can see the difference between what we’ll ship and what we intend to change. This framing keeps discussions grounded in impact, not features.

    Step 2 — Map stakeholders and incentives. Effective stakeholder management begins with a living map: economic buyers, executive sponsors, influencers, and operators. I capture each person’s goals, risks, and decision cadence. When I speak to Finance, I foreground cost and runway; with Sales, I emphasize pipeline and win rate; for Customer Success, I speak to retention and NPS. Meeting stakeholders where they are builds trust quickly.

    Step 3 — Co-create early with the product trio. I pull the product trios (PM, Design, Engineering) into continuous discovery with GTM partners to validate assumptions and de-risk the solution. This is where empowered product teams shine—rapid discovery sprints, early prototypes, and clear learning objectives. Co-creating exposes blind spots early and transforms critics into champions.

    Step 4 — Socialize a narrative, not a deck. Before any formal review, I circulate a short narrative memo that ties our product strategy to a clear value proposition, competitive differentiation, and go-to-market strategy. I include options and trade-offs so stakeholders feel invited to shape the path, not just stamp approval. Pre-wiring conversations ensure that the “meeting” is simply the last 10% of the decision.

    Step 5 — Back the story with data and a viable plan. I combine retention analysis, funnel metrics, and customer evidence to demonstrate opportunity size and risk reduction. Then I outline a phased approach with product roadmapping and sprint planning, milestones, and success metrics. I highlight the smallest viable bet that proves value fast, along with contingency paths if we learn something unexpected.

    Step 6 — Design the decision. I define the decision we need, by whom, and by when. The decision doc includes the problem, options, risks, mitigations, and the explicit ask. I schedule 1:1s to address concerns, then run a focused review with clear roles and time-boxed discussion. Clarity about the decision—and the criteria—prevents drift and protects timelines.

    Step 7 — Sustain momentum post-approval. After the green light, I convert the plan into execution cadences: weekly demos, transparent dashboards, and QBRs vs OKRs check-ins to reinforce outcomes. We celebrate learning milestones, not just launches, and keep stakeholders informed with concise updates that tie progress to the original outcomes and value proposition. Momentum is the best antidote to second-guessing.

    Clear communication and a repeatable process turn buy-in from a hurdle into a habit. When stakeholders see a compelling narrative, credible evidence, and a path to value, they don’t just approve—they advocate. Follow these seven steps and you’ll build alignment faster, ship smarter, and strengthen trust across the organization.


    Inspired by this post on Product School.


    Book a consult png image