
When I think about the difference between a roadmap that moves the business and one that simply ships output, impact analysis is the habit that changes everything. It gives me and my product trios a disciplined way to forecast value, align stakeholders, and de-risk bets before a single sprint starts. Over the years, I’ve seen great ideas fail not because they were bad, but because we couldn’t articulate, test, and track their true impact. That’s the problem impact analysis solves.
Impact analysis, in practice, is a structured method for predicting how a proposed change will influence user behavior and business outcomes—and then validating those predictions with data. Uncover what impact analysis is, why it matters, and how to do it with proven methods and clear steps for product teams. When done well, it translates strategy into evidence-backed choices that strengthen our value proposition and accelerate product-led growth.
I use impact analysis at three key moments: during product discovery to vet opportunities, in product roadmapping and sprint planning to prioritize, and post-launch to confirm that outcomes beat expectations. It is equally useful for net-new features, UX improvements, pricing changes, and even enablement like in-app guides or product tours.
Step 1: Define the outcome with precision. I anchor every proposal to outcomes vs output OKRs, choose one primary success metric, and record the current baseline. If we plan to experiment, I estimate the minimum detectable effect (MDE) to ensure our A/B testing can actually validate the expected lift. This protects us from investing in ideas that are too small to measure or too broad to manage.
Step 2: Map the causal chain. I translate the idea into a simple impact map: feature change → user behavior (activation, frequency, conversion, retention) → business outcome (revenue, cost, risk, satisfaction). This clarifies what must change in user behavior and why users would care—forcing us to revisit our value proposition if the link feels thin.
Step 3: Size the upside and reach. I estimate who will be exposed (reach), how often (frequency), and the expected behavior change (conversion delta). I complement this with RICE (reach, impact, confidence, effort) or cost of delay to compare options. The goal isn’t perfect math; it’s consistent, transparent assumptions that we can pressure test with data.
Step 4: Evaluate risk, complexity, and dependencies. I assess technical effort, privacy-by-design considerations, data governance needs, and cross-team sequencing. This is where stakeholder management becomes essential—aligning Engineering, Design, GTM, and Security early so we don’t discover hidden blockers mid-sprint.
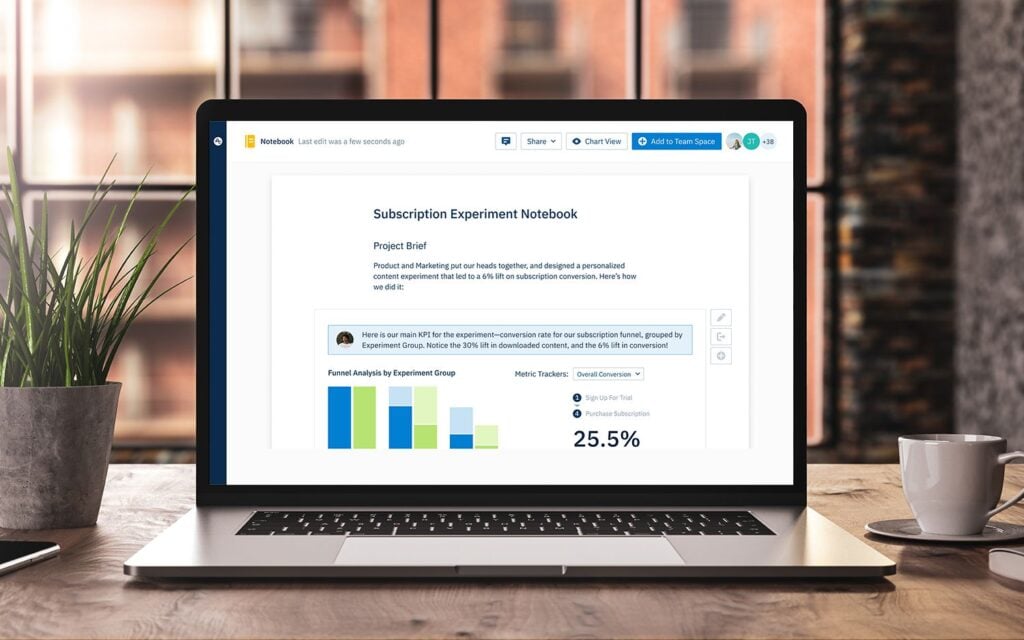
Step 5: Design the evidence plan. For changes where causality matters, I prefer A/B testing with the right MDE and guardrail metrics. I instrument events and set up dashboards in a unified analytics platform (Amplitude analytics, Pendo, or a homegrown stack) so we can monitor leading indicators quickly. If experiments aren’t feasible, I use sequential rollouts, synthetic controls, or pre-post analyses with clear caveats.
Step 6: Communicate the decision. I share a one-page impact brief that summarizes objectives, hypotheses, metric choices, expected lifts, risks, and the test plan. This reduces debate time, improves stakeholder trust, and enables empowered product teams to move faster with clarity.
Step 7: Ship, monitor, and learn. After launch, I track leading indicators within days and validate lagging outcomes over weeks. I run retention analysis and cohort reviews to confirm that behavior change sticks, and I write a short learning memo—especially when we miss—so future bets get sharper.
On a recent initiative, our team debated whether to build a new onboarding flow or invest in targeted in-app guides. The impact analysis showed the guide approach would reach 3x more users in the next quarter, require half the effort, and be easier to A/B test end-to-end. We shipped the guides, saw a measurable lift in activation, and then recycled those insights to inform the broader onboarding redesign. The analysis didn’t just pick a winner—it created a faster path to compounding outcomes.
Common pitfalls I watch for: chasing vanity metrics, assuming linear impact at scale, ignoring confidence and variance, and skipping instrumentation. Another trap is treating impact analysis as a heavyweight doc—keep it lightweight, comparable across initiatives, and tightly tied to decision-making.
My lightweight template: one sentence on the desired outcome and OKR; a causal chain with the key behavior change; a simple sizing with reach, impact, and confidence; risk and dependency notes; the experimentation plan; and the decision. If we can’t write that in one page, we probably don’t understand the bet well enough to pursue it yet.
The next time you review your roadmap, pick your top three bets and run this playbook. You’ll sharpen your prioritization, increase stakeholder confidence, and give your team a clear line of sight from product discovery to measurable outcomes. That’s how we build momentum, quarter after quarter.
Inspired by this post on Product School.


Leave a Reply