
I treat agent performance analytics as a strategic product lever, not a back-office metric. When I combine Pendo’s product signals with Agent Analytics from our support systems, I get a unified view of where users struggle, how agents intervene, and which in-app experiences accelerate resolution. That visibility lets my team drive product-led growth and improve customer experience while lowering support costs.
Increase revenue, cut costs, and reduce risk with Pendo’s Software Experience Management platform. Optimize the entire software experience to drive adoption and improve engagement.
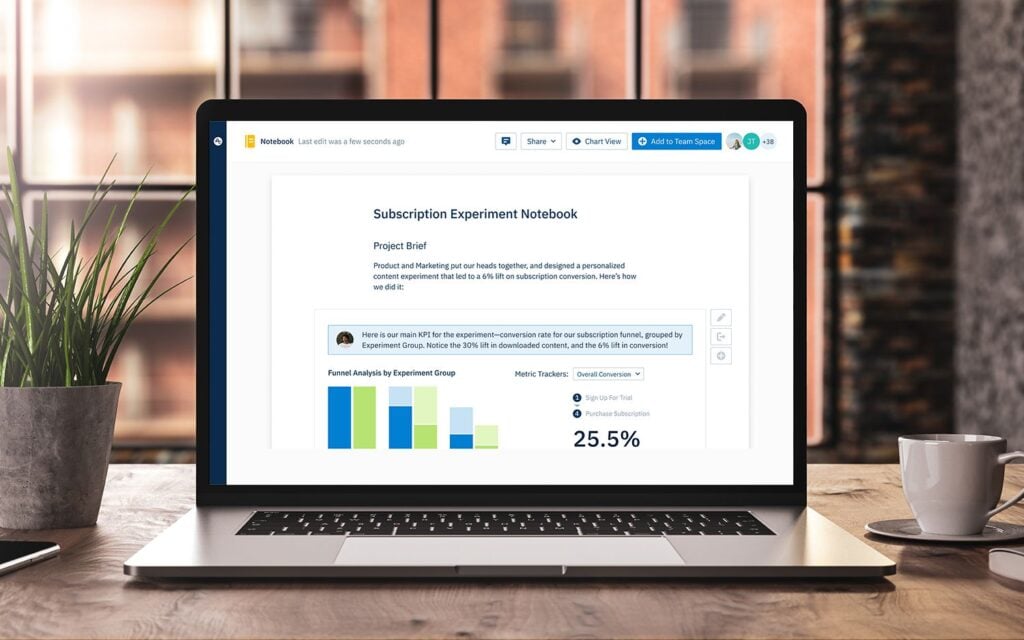
In practice, I build a clear scorecard that blends both product and support KPIs: first response time, resolution rate, first contact resolution, CSAT, containment/deflection rate, average handle time, ticket volume per active account, onboarding completion, user activation, and time-to-value. This balanced view ensures we reward not just speed, but durable outcomes that reduce repeat contacts and improve retention.
To make the data actionable, we connect our CRM integration, ticketing events, and Pendo product analytics in a unified analytics platform. That gives me cohort-level clarity—who needed help, what they were doing before opening a ticket, how agents responded, and whether users stayed engaged afterward. With clean instrumentation and consistent taxonomies, Agent Analytics becomes a reliable operating system for both product and support leadership.
I then use in-app guides, tooltips, and product tours to proactively address the top friction points that drive ticket volume. Through A/B testing, we compare cohorts exposed to guided workflows versus control groups, measuring deflection, faster task completion, and downstream conversion. When a guide meaningfully reduces tickets for a given workflow, we promote it from experiment to standard onboarding, and we feed those learnings back into our roadmap.
The real unlock comes from tying outcomes to business impact. I track how improvements in resolution quality and self-serve adoption influence expansion revenue, support cost per account, and risk signals like churn propensity. Retention analysis helps us validate whether reduced friction and better agent coaching translate into sustained engagement and healthier accounts.
Operationally, Agent Analytics helps me coach teams with precision. I spotlight high-performing behaviors, identify knowledge gaps, and standardize winning playbooks directly in the product via in-app guidance. This approach empowers agents, shortens onboarding for new hires, and keeps our best practices current as the product evolves.
None of this works without trust. We apply privacy-by-design principles and strong data governance, ensuring that analytics, coaching, and automation respect user consent and data minimization standards. With that foundation, we can scale confidently—experiment faster, learn from every interaction, and continuously improve the software experience.
If you’re getting started, begin by baselining your agent and product KPIs, ship one high-impact guide to deflect a top ticket driver, and review results weekly. Within a quarter, you’ll have a repeatable loop: diagnose friction, test an in-app solution, measure deflection and satisfaction, and reinvest the gains into the next set of improvements.
Inspired by this post on Pendo – Best Practices.


Leave a Reply