Tag: in-app guides

  • Turning Pendomonium Insights Into a Product Growth System

    Turning Pendomonium Insights Into a Product Growth System

    Pendomonium can be treated as more than a source of product ideas. Its practical value lies in connecting an identified growth problem to behavioral evidence, a targeted intervention, and a measurable follow-through plan.

    The supplied Pendo account spans analytics, onboarding tools, product strategy, expert advice, and peer conversations. Viewed together, those elements form a repeatable operating system for converting conference learning into product growth experiments.

    Conference learning becomes useful when it enters a growth loop

    The Pendo article describes several distinct kinds of conference value: behavioral analytics and retention analysis can clarify where users struggle; journey mapping and continuous discovery can improve the framing of those problems; and in-app guides, product tours, or broader UX changes can become possible responses. Sessions about empowered teams, stakeholder alignment, and outcome-focused roadmaps address the organizational conditions needed to execute those responses.

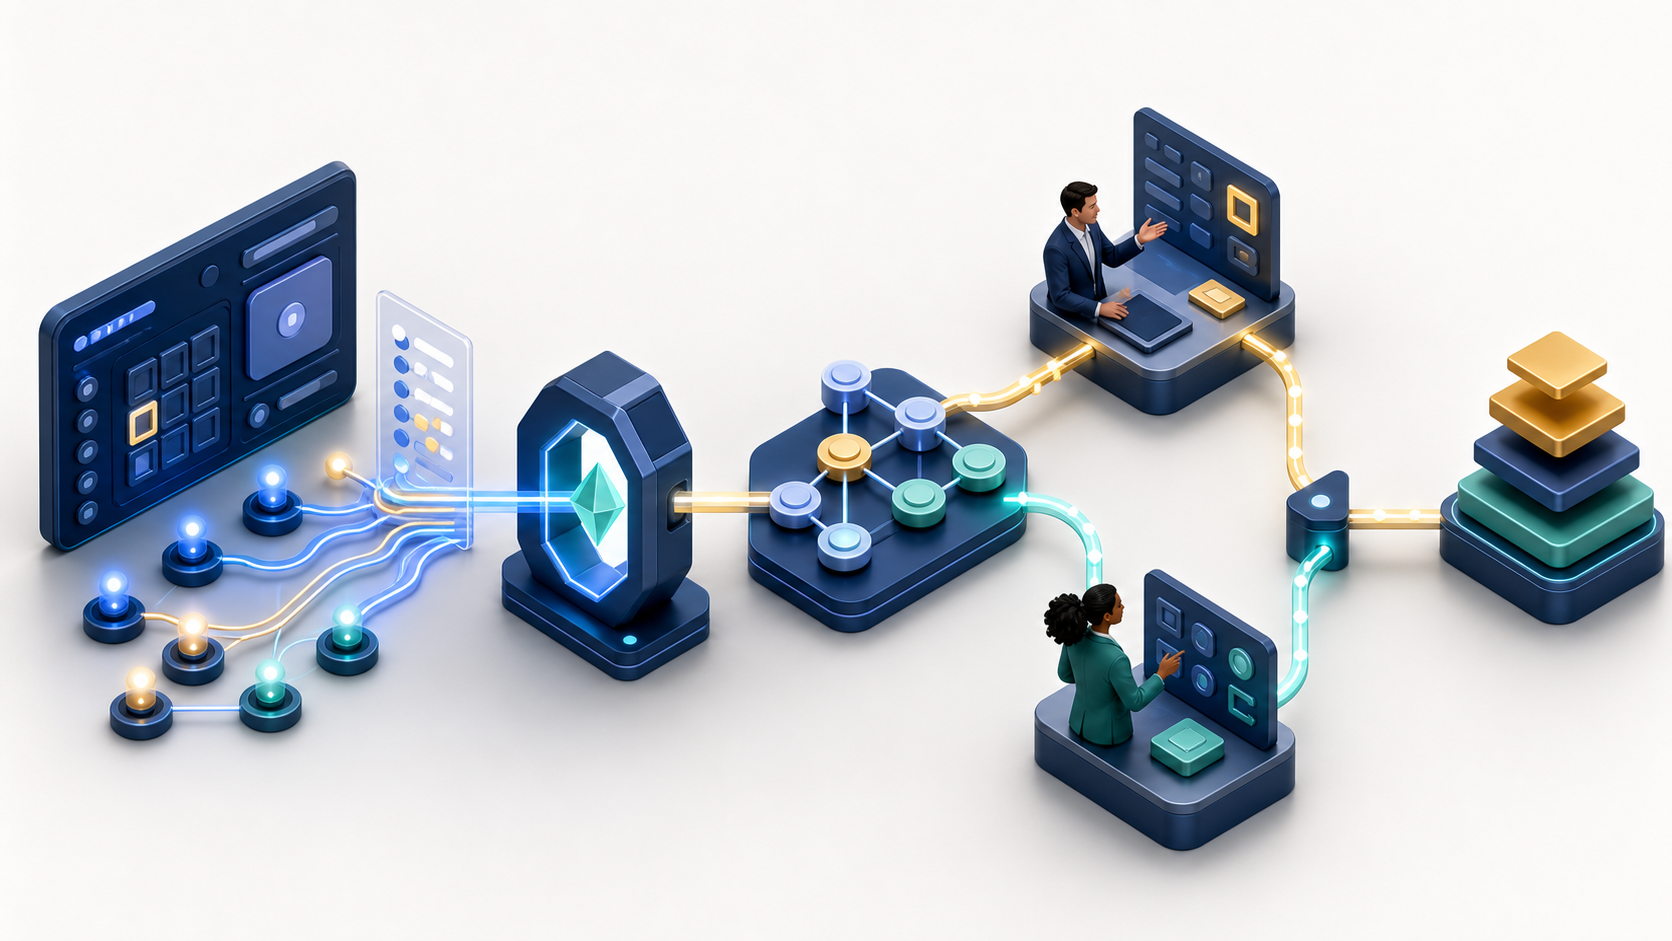
    The synthesis is a four-part loop: diagnose a meaningful behavior, select an intervention that fits the observed friction, define the intended outcome, and establish ownership for the work. No single conference session completes that loop. A talk may sharpen the hypothesis, a workshop may produce a prototype, an expert conversation may challenge the targeting logic, and a peer discussion may provide a useful benchmark.

    This framing also changes the standard for conference return on investment. The relevant question is not how many notes or feature ideas an attendee collected. It is whether the event improved a decision that can be tested against an activation, onboarding, or retention outcome.

    Begin with a constrained product growth question

    The Pendo author recommends defining explicit outcomes before booking the trip: one activation measure to improve, one source of onboarding friction to address, and one discovery practice to strengthen. That constraint is useful because it turns a large agenda into a decision filter. Sessions become relevant when they contribute evidence, methods, or execution support for the selected problem.

    Preparation should make the question concrete. The source advises bringing access to analytics dashboards and, where possible, a staging environment. An attendee could then inspect an event taxonomy, review a relevant session replay, or draft guidance for a defined segment while expert input is available. These activities are more actionable than collecting generalized advice because they expose assumptions about instrumentation, audience selection, and user context.

    The same discipline applies to office hours. According to the article, these appointments can fill quickly, and attendees should arrive with precise questions, such as an unexplained activation drop-off or uncertainty about a guide-targeting rule. A useful expert conversation should end with a clearer hypothesis or experiment, not merely a product demonstration.

    Match evidence, intervention, and measurement

    The strongest practice implied by the source is to keep diagnosis and intervention connected. Session replay, behavioral analytics, retention analysis, and journey mapping illuminate different parts of user behavior. In-app guides and tours are possible treatments, but they should not become automatic answers to every point of friction.

    Product growth questionRelevant conference inputUseful work product
    Where does progress break down?Behavioral analytics, retention analysis, journey mapping, or session replayAn evidence-backed problem statement
    What could reduce the friction?Guide and tour workshops, UX examples, or expert feedbackA testable intervention rather than an unprioritized idea
    Who should receive the intervention?Segmentation and targeting guidanceA defined audience, context, and trigger
    How will the team evaluate it?Activation and onboarding discussionsA success measure tied to the original problem

    This sequence helps prevent tool-first product management. If replay evidence suggests that users cannot understand an interface, contextual guidance might be appropriate. If the underlying workflow is structurally difficult, adding another tour could conceal rather than remove the problem. The conference contribution is therefore not just exposure to Pendo capabilities; it is the opportunity to examine when each capability fits the diagnosed need.

    The author reports applying workshop ideas to experiments and subsequently seeing faster time-to-value for new users. That is a useful practitioner account, but it is not presented as comparative evidence. Teams adopting the practice should still establish their own baseline, success measure, and evaluation method.

    Use a return-home cadence to preserve accountability

    Conference insights decay when they remain in personal notes. The source proposes a note structure containing the problem, supporting data, proposed intervention, and success measure. It also describes leaving the event with two prioritized experiments, named directly responsible individuals, and an execution-readiness checklist.

    1. Before the event: choose the activation measure, onboarding problem, and discovery practice that will guide agenda decisions.
    2. During sessions and workshops: record evidence and assumptions separately from proposed features or guidance.
    3. During expert and peer conversations: pressure-test the hypothesis, instrumentation, targeting logic, and execution constraints.
    4. Within 24 hours of a useful introduction: follow up with a concise summary and a specific next step, reflecting the networking practice recommended in the source.
    5. Within 48 hours of returning: hold the debrief described by the author, prioritize the experiment backlog, and agree on a shared activation or onboarding milestone.
    6. Across the next 30, 60, and 90 days: review whether ownership translated the selected insights into tests, decisions, and measurable learning.

    Intentional networking can support this cadence rather than sit outside it. The article recommends meeting peers with comparable metrics, product operations leaders, and solutions engineers. Their value is not simply expanding a contact list: each perspective can expose a different weakness in the plan, from an unrealistic benchmark to an instrumentation gap or an unresolved delivery dependency.

    Key takeaways

    • Anchor the event to a specific growth outcome and a defined source of user friction.
    • Use analytics, journey evidence, workshops, expert advice, and peer input as complementary parts of one decision process.
    • Select guides, tours, or UX changes only after diagnosing the behavior they are intended to change.
    • Capture every promising idea with supporting evidence, a success measure, and a responsible owner.
    • Use the post-event debrief and 30-60-90 day follow-through to turn conference learning into accountable experimentation.

    The durable opportunity is to make Pendomonium the start of a learning cycle rather than the end of an annual event. Teams that arrive with a narrow question and leave with an owned experiment can carry the conference’s value into their next product decision.

    References

  • Stop Support Tickets Before They Start: How AI Unsticks Users and Lifts Conversions

    Stop Support Tickets Before They Start: How AI Unsticks Users and Lifts Conversions

    Every moment of friction in a product carries a hidden cost: attention drifts, motivation wanes, and the next click becomes a support ticket—or worse, silent churn. Over the years, I’ve learned to treat “stuck” as an urgent product signal, not just an operational nuisance. When we unstick users in the flow, we protect revenue, brand trust, and the momentum that powers product-led growth.

    Learn how Amplitude’s Global Support team uses AI Assistant to reduce support tickets, prevent user churn, and increase conversions.

    I reference that line often because it captures a proven pattern: meet users where confusion peaks and resolve it instantly. In my practice, the formula is straightforward—pair behavioral analytics and session replay with a just-in-time AI Assistant, routed by clear driver trees. This transforms support from reactive firefighting into a proactive, in-product experience that accelerates onboarding and boosts user activation.

    Here’s how I operationalize it. First, I use Amplitude analytics and behavioral analytics to surface high-friction steps—pages with elevated drop-off, loops, or rage clicks. Session replay clarifies the “why” behind the numbers, while cohort and retention analysis reveal who’s most at risk. Then I deploy targeted in-app guides and tooltip design to preempt known pitfalls, while an AI Assistant handles real-time questions with context from our knowledge base and product docs.

    The AI Assistant is more than a chatbot. With well-structured AI workflows, it detects intent, pulls precise snippets from docs-as-code, and handles routine issues instantly. When complexity spikes, it executes a graceful handoff to consultative support via Intercom or a Zendesk integration—preserving conversation history and sentiment cues—so humans spend time where judgment matters. This hybrid model keeps response times low without sacrificing quality.

    To de-risk changes, I lean on A/B testing and feature flags. I measure time-to-value, activation rate, and funnel conversion as leading indicators, while tracking ticket deflection, CSAT, and NRR as trailing indicators. The goal isn’t just fewer tickets; it’s faster learning loops and a compounding improvement in user outcomes. When we see activation curves steepen and onboarding friction flatten, we know the system is working.

    Practically, I start with the top three friction points in onboarding, implement narrow in-app guides, and deploy the AI Assistant with strict guardrails and clear escalation paths. Weekly reviews align product, customer success, and solutions engineering around shared telemetry—so we tune prompts, content, and UI patterns together. Over time, I’ve seen ticket volume decline meaningfully, while conversion and retention rise as users experience fewer dead ends.

    If you’re evaluating where to begin, identify the moments where confusion compounds—pricing configuration, integrations, and data mapping are common culprits. Then introduce targeted, context-aware help right where users hesitate. You’ll not only prevent “every stuck user” from turning into a ticket—you’ll convert friction into confidence, and confidence into growth.


    Inspired by this post on Amplitude – Best Practices.


    Book a consult png image
  • Stop Forcing AI to Prove ROI: A Product Leader’s Playbook to Measure Real Business Value

    Stop Forcing AI to Prove ROI: A Product Leader’s Playbook to Measure Real Business Value

    Every planning cycle, I feel the drumbeat: “Show me the AI ROI—this quarter.” The pressure is real, especially when boards and CFOs expect immediate payback. Yet when I review stalled initiatives across teams and peers, the pattern is consistent: most companies treat AI like a feature to ship, not a system to manage. That mindset almost guarantees we measure the wrong things, declare victory (or failure) too early, and miss the durable value AI can create.

    Here’s the core problem I see: we leap to solution and skip the counterfactual. Without a baseline, a clear control, or a defined “what would have happened otherwise,” we’re guessing. We also fixate on lagging, financial KPIs that move slowly (revenue, cost, risk), then use outputs—not outcomes—as OKRs. If we don’t align on outcomes vs output OKRs upfront, the best team in the world can still optimize for activity over impact.

    My AI Strategy starts from a simple truth: value shows up along three vectors—revenue, cost, and risk—on different timelines. In the near term, we must validate leading indicators (adoption, engagement, activation) that ladder to those vectors through a transparent driver tree. Over time, those drivers compound into the lagging KPIs finance cares about. When we make the driver tree explicit, everyone can see how model precision, response time, and workflow integration roll up to conversion lift, case deflection, time-to-resolution, or reduced exposure.

    To make this rigorous, I run a five-step playbook. First, define the decision and business outcome in plain terms. Second, instrument the baseline with behavioral analytics on a unified analytics platform—tools like Amplitude analytics or Pendo help expose friction points we’ll later target. Third, create a counterfactual using A/B testing and specify a minimum detectable effect (MDE) so we know how long to run and how much traffic we need. Fourth, quantify costs (training, inference, integration, change management) and include AI risk management, privacy-by-design, and data governance up front. Fifth, lock a measurement plan that connects leading indicators to lagging ROI through the driver tree.

    Most AI initiatives don’t fail on model quality—they fail on adoption. If the workflow isn’t smoother, trust isn’t earned, or value isn’t obvious, users revert. That’s why I invest early in onboarding, in-app guides, product tours, and thoughtful tooltip design to reduce the time-to-first-value. Then I watch user activation, retention analysis, and task completion to ensure the assistive experience is not just novel—it’s habit-forming.

    For generative use cases, eval-driven development is non-negotiable. I maintain offline evaluations for accuracy and safety, and online evaluations for business impact. Retrieval-first pipeline health, context window management, and prompt engineering affect reliability; so do latency and grounding quality. We ship behind feature flags, measure guardrail effectiveness, and tighten feedback loops from human-in-the-loop reviews into model updates—continuously.

    On the business side, I avoid “AI theater” by structuring benefits like a CFO. Revenue: increased conversion or expansion driven by better recommendations, faster sales cycles, or higher trial activation. Cost: case deflection, agent time saved, fewer escalations, and lower rework. Risk: reduced exposure via automated checks, anomaly detection, and consistent policy application. If any claim can’t be tied to measured deltas—via A/B testing or strong quasi-experiments—it doesn’t go in the deck.

    Build vs buy deserves the same discipline. I map platform scalability, governance requirements, and total cost of ownership against time-to-impact. Teams often underestimate integration and maintenance drag; a pragmatic mix of bought components with thin custom layers can accelerate outcomes while keeping options open. The goal isn’t to own every layer—it’s to own the learning loop and the differentiated experience.

    I also remind teams that tooling should serve the strategy, not replace it. I’ve seen concise, effective messaging that captures the point: “Increase revenue, cut costs, and reduce risk with Pendo’s Software Experience Management platform. Optimize the entire software experience to drive adoption and improve engagement.” The words are compelling because they reflect the three-vector value model and the adoption imperative. The same standard should apply to any AI initiative we propose.

    If you’re under pressure to prove ROI, shift the conversation: lead with the driver tree, specify your counterfactual, and anchor on leading indicators you can move in weeks—not quarters. Then connect those to the lagging KPIs finance expects over time. When we manage AI like a product—grounded in evidence, experimentation, and user-centered adoption—we don’t have to force ROI. We compound it.


    Inspired by this post on Pendo – Perspectives.


    Book a consult png image
  • 5 powerful ways I use Pendo MCP to bring product analytics into ChatGPT, Claude, and Cursor

    5 powerful ways I use Pendo MCP to bring product analytics into ChatGPT, Claude, and Cursor

    I’ve wanted my product analytics to follow me into every conversation, doc, and code review. Now they do—and it changes how quickly I can move from question to insight to decision.

    Pendo is now available as an MCP (Model Context Protocol) server, easily accessible in Claude, ChatGPT, and Cursor.

    Practically, this means my core product analytics, segments, and qualitative feedback can be surfaced right where I plan sprints, refine opportunity solution trees, and write specs. Fewer context switches, tighter feedback loops, and faster product decisions.

    Here are five ways I put Pendo MCP to work across my day-to-day workflows—grounded in product management leadership habits and built for speed and clarity.

    1) Daily triage and decision support: In ChatGPT or Claude, I quickly query product analytics to spot anomalies, usage spikes, or drop-offs by segment. Prompts like “Highlight top features by week-over-week growth and flag statistically notable anomalies” help me focus standups on what matters, tightening the loop between observability and action.

    2) Continuous discovery prep: Before customer interviews, I pull recent NPS verbatims, feature adoption by persona, and journey mapping signals. In seconds, I have a concise brief that blends behavioral analytics with customer interviews, so I can ask sharper questions and validate assumptions faster—without leaving my AI workspace.

    3) Evidence-based prioritization: When shaping the roadmap, I bring in retention analysis, user activation metrics, and cohort views to weigh impact vs. effort. Using Pendo MCP inside Claude or ChatGPT, I translate insights into driver trees and a clear product strategy narrative that aligns stakeholders around outcomes, not output.

    4) Product-led growth and onboarding: I review onboarding funnels, identify friction in first-run experiences, and draft in-app guides and tooltip copy that meets users at the exact drop-off points. With Pendo MCP, the context for product tours and in-app guides is right where I’m writing, so iteration cycles stay tight and data-informed.

    5) Customer success and QBR prep: For account health and QBRs vs OKRs alignment, I generate succinct summaries of feature adoption, sentiment, and value realization—ready to paste into email, decks, or a CRM integration. This keeps sales-led and product-led growth motions unified, with a single source of truth visible in ChatGPT, Claude, or when I’m coding in Cursor.

    The net effect: higher-quality decisions, faster. By bringing product analytics into my AI workflows, I reduce context switching, improve context window management, and keep my team anchored to real user behavior. Wherever I’m working—ideating in Claude, drafting in ChatGPT, or reviewing code in Cursor—my Pendo context is right there with me.

    If you’re leading empowered product teams, this is a pragmatic way to operationalize continuous discovery, speed up alignment, and turn insights into outcomes. It’s a simple shift with outsized leverage.


    Inspired by this post on Pendo – Best Practices.


    Book a consult png image
  • Unlock High-Impact Mobile Engagement: Amplitude Guides & Surveys for iOS, Android, React Native

    Unlock High-Impact Mobile Engagement: Amplitude Guides & Surveys for iOS, Android, React Native

    Mobile engagement is most effective when it’s timely, contextual, and grounded in real user behavior. In my experience leading product teams, the fastest path to activation and retention comes from meeting users in the moment with relevant in-app guides and lightweight surveys that reduce friction and illuminate intent.

    Deploy behavioral-driven mobile engagement with Amplitude Guides and Surveys for iOS, Android, and React Native platforms.

    What excites me about this approach is how naturally it supports product-led growth. In-app guides and product tours streamline onboarding, while targeted micro-surveys surface the “why” behind user actions. The result: clearer journey mapping, fewer blind spots in the funnel, and a smoother path to user activation—all without adding engineering heavy-lift for each iteration.

    To optimize continuously, I pair behavioral analytics with A/B testing and retention analysis. This lets my team validate hypotheses quickly, localize friction by segment or stage, and tune messaging for different cohorts. With Amplitude analytics at the core, we can connect engagement nudges to downstream outcomes, not just clicks—so we’re improving time-to-value, not just surface metrics.

    My recommended starting point is simple: define a single activation moment, instrument the critical behaviors around it, and launch a focused guide plus one survey to test the narrative. Use journey mapping to identify the key decision points, then iterate weekly based on observed behavior, not opinions. This cadence keeps learning velocity high and ensures every change moves us closer to clear outcomes.

    From a leadership perspective, I coach product trios to own an activation or retention KPI, run small controlled experiments, and document learning with crisp before/after evidence. Cross-platform support across iOS, Android, and React Native means we can scale wins quickly, standardize patterns, and create a repeatable playbook for new features and markets—all while keeping the user experience coherent and respectful.


    Inspired by this post on Amplitude – Best Practices.


    Book a consult png image
  • Mastering NRR: How Great Customer Success Teams Drive Expansion, Crush Churn, and Scale PLG

    Net Recurring Revenue (NRR) is the cleanest truth-teller in my operating system. When I review NRR, I’m not just looking at whether we renewed accounts—I’m assessing whether our product and customer success motions are compounding revenue from our existing customers. Put simply: good CS teams protect revenue; great CS teams grow it through adoption, expansion, and durable retention.

    Here’s how I frame NRR with my teams: it reflects revenue from our current customers after expansion, downgrades, and churn. If it’s at or above 100%, the installed base is self-sustaining; if it’s materially above 100%, the base is funding growth without net-new sales. That’s the holy grail for product-led growth and the benchmark I use to separate good from great.

    At HighLevel, I’ve learned that you can’t “wish” your way to high NRR. You operationalize it. We align incentives, dashboards, and rituals so everyone—from PMs to CSMs to Solutions Engineering—owns the same outcome. Our “QBRs vs OKRs” discussions anchor on NRR drivers: activation rates, time-to-value, feature adoption depth, and expansion readiness. Those leading indicators tell me where we’ll land on lagging revenue results.

    The best Customer Success teams operate like product teams. They use behavioral analytics and retention analysis to segment customers by use case and maturity, then design journey mapping to move each segment from first value to habitual value. They proactively reduce risk while creating clear expansion paths—new seats, premium features, or higher-tier plans—based on real product usage, not guesswork.

    Onboarding is where great NRR trajectories begin. I focus on compressing time-to-first-value and time-to-second-value because those moments create the habit loops that underpin renewal and expansion. In practice, that means targeted in-app guides, contextual product tours, and nudges that drive user activation across the “sticky” features that correlate most with long-term retention.

    To make this scalable, we blend human and product-led touchpoints. CSMs run outcome-based playbooks, while the product experience handles education and reinforcement at scale. When usage signals an expansion opportunity—say, a team consistently bumps into plan limits—we generate a product-qualified expansion lead and equip the CSM with the exact value storyline and proof points to close it.

    Increase revenue, cut costs, and reduce risk with Pendo’s Software Experience Management platform. Optimize the entire software experience to drive adoption and improve engagement.

    I’ve seen this playbook move the needle. After instrumenting our key workflows and deploying targeted in-app guidance, we watched adoption of our highest-retaining features climb, risk flags surface earlier, and expansion conversations become far more data-driven. We didn’t chase shiny objects; we built a reliable pipeline of retained and expanded revenue directly from product usage.

    If you’re aiming to level up NRR, start with a crisp blueprint: define the critical events that predict renewal and expansion; set activation milestones per segment; deploy in-app guides and product tours to remove friction; give CSMs a single-pane view of risk and readiness; and review NRR weekly with the same seriousness you apply to new ARR. Consistency beats intensity here.

    Finally, keep the narrative simple. Your leadership story isn’t “we shipped features,” it’s “we created customer outcomes.” Tie every CS and product initiative back to NRR drivers—and make the wins visible. When teams see the direct line from great onboarding and adoption to measurable expansion, they naturally operate like a unified, product-led growth engine.

    NRR rewards rigor. Treat it as the top-line health metric for your installed base, make the software do more of the teaching, and empower CS to coach to outcomes. Do that well, and you won’t just separate the good from the great—you’ll build a compounding machine.


    Inspired by this post on Pendo – Best Practices.


    Book a consult png image
  • How to Turn MCP Product Data Into an Adoption System

    How to Turn MCP Product Data Into an Adoption System

    Your product data is available, but the people who need it still wait for an analyst, search through dashboards, or walk into a meeting with competing interpretations. Adding MCP access can shorten that path. It does not, by itself, make the resulting decisions consistent or useful.

    The real opportunity is to solve two adoption problems at once: get more people to use product data in their daily work, then use that data to improve customer adoption. That requires a repeatable operating system connecting activation, feature use, retention, customer feedback, account risk, qualified leads, packaging, and release adoption to named decisions and owned actions.

    Key takeaways

    • Treat every MCP prompt as a decision contract: define the metric, population, time window, comparison, expected action, and evidence standard.
    • Organize prompts around recurring product decisions, not around dashboards or data tables.
    • Require every answer to end with an owner, an action, and a plan for measuring what happens next.
    • Use stronger evidence for higher-consequence decisions. A churn-risk list or sales lead should face more scrutiny than a request to explore a feature funnel.
    • Start with one weekly decision loop. Expand only after people trust the definitions, joins, and recommendations behind it.

    Give every prompt a decision contract

    The most common failure is asking a broad question and expecting the model to infer the business decision. A request such as Why are users not activating? leaves too much unresolved. Which users count? What qualifies as activation? Which period matters? Is the goal to diagnose a problem, choose an experiment, or estimate its potential impact?

    A decision-grade prompt should specify eight elements:

    1. Decision: State what someone needs to choose after reading the answer.
    2. Metric: Name the behavioral outcome and use the agreed internal definition.
    3. Population: Identify eligible users or accounts, including relevant plans, personas, or lifecycle stages.
    4. Time window: Set the period and, when useful, the comparison period.
    5. Breakdown: Name the segments that could lead to different actions.
    6. Diagnosis: Ask for drop-offs, gaps, stalls, loops, themes, or regressions rather than a descriptive total alone.
    7. Prioritization: Define whether opportunities should be ranked by absolute impact, effort, risk, velocity, or another decision criterion.
    8. Evidence: Require assumptions, limitations, denominators, and statistical uncertainty where they matter.

    For example, replace the broad activation question with a request to show the activation funnel for small, mid-market, and enterprise customers over the last 90 days, identify the largest drop-off at each step, and estimate which improvement would produce the largest absolute increase in activated users. That framing gives a product leader something to prioritize. It also prevents a dramatic percentage change in a small segment from automatically outranking a modest change affecting many more users.

    The prompt cannot repair an ambiguous metric. Before operationalizing it, write down the activation event, the eligible population, the event sequence, the reporting window, and any excluded internal or test activity. Do the same for adoption, retention, time-to-value, product-qualified leads, and churn risk. If two functions use different definitions, the MCP response will make the disagreement faster, not make it disappear.

    A reusable prompt pattern looks like this: Analyze [behavior] for [population] during [window]. Break the result down by [segments]. Identify [decision-relevant pattern]. Quantify [impact]. Recommend [number and type of actions] ranked by [criterion]. Return the result with [owner-facing output], assumptions, limitations, and the evidence supporting each recommendation.

    Save that structure as a governed prompt template. Let teams change the business variables without removing the fields that make the answer auditable.

    Build the prompt system around lifecycle decisions

    A prompt library becomes unwieldy when it mirrors every report in the analytics stack. A smaller library organized around recurring decisions is easier to adopt because each prompt has a recognizable moment of use.

    DecisionQuestion the prompt should answerAction it should enable
    Improve activationWhere do small, mid-market, and enterprise users drop out of the activation funnel over the last 90 days?Choose the funnel step with the largest potential absolute lift.
    Increase feature adoptionWhich features are gaining usage fastest over the last 30 days, and which high-value features remain underused by a relevant persona?Select in-app guide placements and the audiences that should receive them.
    Improve retentionHow do 30-, 60-, and 90-day retention curves differ by plan and persona?Choose focused experiments for an early retention gap.
    Remove journey frictionWhere do users stall or repeat steps after onboarding, and which feedback themes explain the behavior?Change the journey, product tour, tooltip, or underlying product experience.
    Validate an interventionDid an in-app guide change activation or time-to-value, and how certain is the estimated effect?Keep, revise, expand, or stop the intervention.
    Manage revenue and account riskWhich accounts show declining use or sentiment, which users meet product-qualified-lead criteria, and which features correlate with movement between pricing tiers?Prioritize customer-success plays, contextual sales follow-up, and packaging tests.
    Learn from releasesWhat happened to adoption, feedback, and regressions across the last three releases?Choose one near-term correction and one larger product bet.

    Activation and time-to-value

    Start with the first customer outcome that matters, not with login or page-view volume. The activation funnel should show the sequence leading to that outcome and expose the step where each meaningful segment falls away. Once you identify the step, examine what users do immediately before and after it. Repeated steps, stalled paths, and abandoned onboarding flows tell you where to investigate.

    Time-to-value adds a second lens. Compare the time required for each persona to reach the key action, then examine the period before and after a tutorial or guide launch. A shorter path can matter even when the final activation rate has not yet moved. Keep the two metrics separate: one measures whether users reach value, while the other measures how long reaching it takes.

    Feature adoption and retention

    Feature adoption velocity helps you notice where behavior is changing, but velocity alone does not tell you what to promote. First decide which features are valuable for which personas. Then find the gap between expected use and observed use. A specialized feature can be healthy with a small eligible audience, while a broadly important feature can be in trouble despite a larger raw user count.

    Do not assume every adoption gap is a discoverability problem. Combine behavioral paths with NPS comments, support tickets, and in-app survey responses. Users may be unable to find the feature, unable to understand it, blocked by a prerequisite, or unconvinced of its value. Those causes demand different responses. A tooltip can address a hidden control; it cannot repair an unreliable workflow.

    Retention analysis should then connect early behavior to continued use. Compare 30-, 60-, and 90-day curves by plan and persona, but ask whether the gaps are statistically credible before allocating a roadmap around them. The useful output is not a collection of curves. It is a small set of testable explanations for why one group returns and another does not.

    Account risk, qualified leads, and packaging

    Commercial prompts sit closer to customer relationships, so their outputs need tighter review. A churn-risk prompt can combine declining feature use, reduced login frequency, and support sentiment, then rank accounts and propose customer-success plays. A lead prompt can identify users who cross agreed usage thresholds, map them to CRM opportunities, and draft follow-up based on demonstrated feature interest.

    Keep scoring separate from execution. The first operational output should be a reviewed queue, not an automatically sent message. A false positive in an exploratory feature report is inconvenient. A false positive that triggers an irrelevant sales or retention outreach reaches the customer.

    Packaging questions require the same discipline. Analyze usage distributions across pricing tiers and look for features associated with upgrades, but do not treat an association as proof that a feature caused the upgrade. Use the pattern to form a packaging hypothesis and an in-product nudge, then measure the resulting behavior.

    Make every answer end in an owned action

    Product data adoption stalls when an MCP response ends with an insight. An insight is only an intermediate artifact. The operating loop is complete when the answer changes a decision, someone acts, and the next analysis measures the result.

    1. Ask: Run a governed prompt tied to a recurring decision.
    2. Inspect: Check definitions, segment sizes, joins, assumptions, and uncertainty.
    3. Decide: Record the chosen action and the alternatives that were rejected.
    4. Assign: Name one accountable owner and a review point.
    5. Intervene: Change the product, journey, guide, customer-success play, sales follow-up, or experiment.
    6. Measure: Rerun the relevant analysis using the agreed success metric.
    7. Publish: Share the outcome so the prompt library accumulates organizational learning rather than disconnected answers.

    Standardize the answer as carefully as the prompt. Each response should contain the observation, supporting evidence, business implication, recommended action, owner, measurement plan, and known limitations. This makes the output usable in a product review, customer-success meeting, release review, or executive update without someone having to reinterpret it from scratch.

    Ownership should follow the action rather than the data system:

    • Product owns the choice of funnel step, journey change, experiment, or roadmap response.
    • Engineering owns instrumentation gaps and product regressions that prevent a reliable decision.
    • Customer success owns reviewed account plays prompted by usage decline and support sentiment.
    • Sales owns follow-up to qualified leads after CRM matching and account review.
    • Marketing owns persona-specific education when the issue is understanding or positioning rather than product usability.

    A weekly executive summary can reinforce this behavior if it remains selective. Limit it to the three most consequential product insights. For each one, name the KPI involved, the decision required, the owner, and the next action. Do not turn the summary into a longer dashboard delivered through a conversational interface.

    My rule is simple: if a finding has no owner or no plausible action, it is not ready for the executive summary.

    Earn trust before automating the cadence

    MCP makes analysis easier to request, which means weak definitions and broken joins can spread faster. Trust therefore has to be designed into the workflow. Check the following before a prompt becomes part of a recurring operating cadence:

    • Metric consistency: The prompt, dashboard, and operating review use the same definition.
    • Population integrity: Eligible users and accounts are explicit, and internal or test activity is handled consistently.
    • Segment denominators: Every rate or comparison exposes how many users or accounts it represents.
    • Identity joins: Product, support, survey, and CRM records map to the intended user or account without silent duplication.
    • Evidence strength: Descriptive patterns, pre/post comparisons, and randomized experiments are labeled differently.
    • Traceability: Feedback themes can be checked against the underlying verbatims, tickets, or survey responses.
    • Human review: Customer-facing or commercially consequential recommendations are approved before execution.

    For an A/B test of an in-app guide, ask for the observed lift, a confidence interval, and the minimum detectable effect assumptions used to plan the analysis. The minimum detectable effect is not the lift that occurred; it is the smallest effect the experiment was designed to detect under its assumptions. If the data cannot support a reliable conclusion, the correct response is to say so rather than manufacture certainty.

    Treat a pre/post comparison with more caution. If activation or time-to-value changed after a tutorial launched, the tutorial may have contributed, but other product, traffic, or customer changes may also explain the difference. Use the result as directional evidence unless the design supports a stronger causal claim.

    Roll out the operating system in a narrow sequence:

    1. Choose one recurring decision with a clear owner, such as improving a specific activation funnel.
    2. Write the metric contract and prompt together.
    3. Run the MCP analysis alongside the existing manual analysis until the numbers and interpretations agree.
    4. Adopt a fixed response format with evidence, action, owner, and measurement plan.
    5. Review the result in the existing weekly operating cadence rather than creating a separate AI meeting.
    6. Record the intervention and rerun the relevant analysis at the next appropriate review point.
    7. Add the next lifecycle decision only after people can explain and trust the first one.

    Do not measure the rollout by prompt volume. Measure whether recurring decisions have usable data coverage, whether answers turn into owned actions, whether teams return to measure those actions, and whether the underlying activation, time-to-value, feature adoption, retention, or commercial outcome moves.

    Your first move is not to publish a large prompt catalog. Pick the product decision that causes the most recurring debate, define its metric contract, and turn it into one weekly question with one accountable owner. When that loop reliably moves from evidence to action to measurement, MCP has become part of the product operating system rather than another interface people try once.

    References

  • Stop Losing Customers: Predict Churn with Digital Analytics and Act Before It’s Too Late

    Stop Losing Customers: Predict Churn with Digital Analytics and Act Before It’s Too Late

    I stopped treating churn as a postmortem and started treating it as a forecasting problem. When we instrument our product, connect the dots across journeys, and embed those signals into our daily operations, churn becomes predictable—and preventable. This shift has been one of the most impactful product strategy moves my teams have made for product-led growth and retention analysis.

    "Discover why and how CS teams can use digital analytics to take a proactive, predictive approach to churn, stopping it before it happens." That is exactly the mindset I bring to customer success and product collaboration: anticipate risk, intervene with precision, and demonstrate measurable impact.

    The practical work starts with leading indicators. I look at user activation milestones, time-to-first-value, feature adoption depth, frequency and recency of key events, account-level coverage (are multiple users active or just one champion?), usage volatility, and friction signals like repeated errors or stalled onboarding. These behavioral inputs are stronger predictors of churn than survey sentiment alone.

    From there, I create a churn risk score. Early on, a transparent rules-based model is usually enough to separate healthy from at-risk accounts. Over time, we can layer in supervised learning if the data supports it. I rely on Amplitude analytics, Pendo, or a unified analytics platform to tag events, build cohorts, and compute risk in near real time. This is where we consistently see the patterns that matter—especially around user activation and sustained adoption.

    Signals without action won’t save a customer, so I connect the model to our systems of engagement. Through CRM integration, at-risk accounts trigger clear playbooks for CSMs and lifecycle marketers. Inside the product, in-app guides address gaps exactly where they occur—guiding users to the next best action, unblocking onboarding, or showcasing the value hidden behind underused features.

    Because not every nudge works for every segment, we treat intervention design as a product problem and run A/B testing on copy, timing, channel, and offer. We test whether a contextual tooltip outperforms an email sequence, whether a short product tour beats a knowledge base link, and which incentives accelerate onboarding without cannibalizing expansion.

    Operationally, this is a team sport. Product, CS, and marketing meet in product trios to review risk cohorts, prioritize root-cause fixes, and tune playbooks. We run a weekly risk review to turn insights into decisions, and we use monthly business reviews to connect leading indicators to lagging outcomes like retention, expansion, and NRR.

    Measurement is non-negotiable. We pair retention analysis with qualitative feedback to understand whether our interventions truly change behavior. The goal is to close the loop: when a risk cluster improves, we codify the playbook; when a tactic underperforms, we learn, adjust, and try again. Over time, the organization builds a muscle for proactive, data-informed customer health management.

    If you’re getting started, begin by instrumenting events tied to value moments, define a simple health score, and stand up a basic alerting workflow. Pilot one or two interventions, measure lift, and iterate. Within a single quarter, you’ll have enough signal to prioritize product improvements and scale the practices that reliably reduce risk.

    Churn rarely surprises teams that listen to their data and respond in real time. With disciplined analytics, thoughtful in-product guidance, and tight alignment across CS and product, we can move from reacting to predicting—and keep more customers succeeding with far less effort.


    Inspired by this post on Amplitude – Perspectives.


    Book a consult png image
  • The Customer Feedback Playbook: AI-Powered Tactics I Use to Make Better Product Decisions

    The Customer Feedback Playbook: AI-Powered Tactics I Use to Make Better Product Decisions

    Customer feedback is the most reliable compass I have for product strategy and execution. Over the years leading product at HighLevel, I’ve built and refined a system that turns raw signals from users into clear, prioritized decisions our teams can confidently ship.

    A practical guide to collecting and using product feedback in product management (from AI tools to early-stage tactics) for better product decisions.

    My playbook starts with continuous discovery. I keep a steady flow of insights from sales calls, customer support threads, community forums, and in-product behavior so I can triangulate patterns rather than chase loud anecdotes. This mix of quantitative and qualitative data helps me separate urgent noise from strategically meaningful trends.

    On the quantitative side, I rely on product analytics to ground the conversation. Amplitude analytics gives me activation, retention cohorts, and feature engagement, while controlled experiments and A/B testing validate whether an idea actually moves a target metric. Tying these signals to specific customer segments helps me see where product-led growth is working—and where it’s stalling.

    For qualitative insight, I combine in-app guides and lightweight surveys (via tools like Pendo) with structured interviews and support escalations (often surfaced through platforms like Intercom). I map problems using the Kano Model to understand which requests are basic expectations, which are performance drivers, and which are potential delights. This keeps our roadmap focused on outcomes, not just outputs.

    AI now accelerates the synthesis step. With LLMs for product managers in my AI product toolbox, I summarize interview transcripts, cluster themes across thousands of notes, and quantify sentiment without losing nuance. I still review raw artifacts to avoid hallucinations and preserve context, but AI reduces the time from signal to insight dramatically—freeing me to spend more energy on judgment and storytelling.

    In early-stage contexts, I bias toward speed and proximity to users. I schedule founder- or PM-led discovery calls weekly, instrument product tours early, and launch scrappy in-product prompts to validate demand before over-investing. When data is sparse, I focus on high-signal channels (power users, churned customers with qualified use cases) and document crisp problem statements that connect directly to activation, retention analysis, and revenue outcomes.

    Prioritization ties everything together. I translate insights into hypotheses aligned to outcomes vs output OKRs, then pressure-test them with feasibility and strategic fit. We run small, measurable experiments, track deltas in activation and retention, and adjust the product roadmapping and sprint planning cadence based on what the data and customers teach us.

    This approach builds trust with stakeholders and creates empowered product teams. By grounding decisions in a transparent trail of feedback, analytics, and experiments, we reduce thrash, move faster, and—most importantly—ship product moments that customers value.

    If you’re refining your own feedback engine, start by instrumenting the basics, set a weekly discovery rhythm, and let AI handle the heavy lifting on aggregation and synthesis. The compounding effect is real: better insights lead to better bets, which lead to better outcomes for your users and your business.


    Inspired by this post on Product School.


    Book a consult png image
  • Why Codeless Product Analytics Wins: Faster Insights, Fewer Bottlenecks, Bigger PLG Results

    Why Codeless Product Analytics Wins: Faster Insights, Fewer Bottlenecks, Bigger PLG Results

    Every quarter, I watch product teams move from gut feel to data-informed decisions—until instrumentation bottlenecks slow them to a crawl. That’s why I’ve become an advocate for codeless analytics: it removes the dependency on engineering sprints for basic event tracking and lets teams answer product questions in hours, not weeks.

    We explain what codeless analytics are, why (and how) Pendo supports them, plus responses to the top three myths about low-code/no-code solutions.

    Here’s how I frame it with my teams: codeless analytics enables product managers, designers, and customer success to tag features visually, track interactions, and analyze adoption without shipping code. The goal isn’t to replace engineered events; it’s to accelerate discovery, speed up iteration, and reduce context-switching for developers. In practice, this means cleaner prioritization, faster validation of hypotheses, and tighter product-led growth loops.

    Why Pendo? In my experience, Pendo’s codeless model shortens the distance from question to insight. Visual tagging makes event setup accessible, in-app guides and product tours let us experiment with onboarding and activation, and governance controls ensure data remains trustworthy across teams. The result is a unified analytics approach where we reserve custom instrumentation for complex logic while using codeless tracking for everyday product questions.

    Let’s address the top three myths I hear most often. Myth 1: “No-code is only for simple use cases.” In reality, most decisions we make weekly—feature adoption, path analysis, funnel drop-offs, and retention analysis—do not require custom code. Codeless analytics handles these well, and when we need deeper context (like server-side events), we complement it with engineered tracking. It’s a both/and, not an either/or.

    Myth 2: “Codeless data isn’t accurate.” Accuracy comes from governance, not the method. I set clear standards: naming conventions, tagging reviews, ownership, and periodic audits. With disciplined process, codeless tracking yields consistent, decision-grade data. The added benefit is visibility—non-technical stakeholders can validate the instrumentation themselves, reducing misalignment.

    Myth 3: “Engineers must instrument everything to scale.” Engineering time is precious; we should spend it on differentiated capabilities, not on routine click tracking. Codeless analytics scales by empowering product teams to self-serve, while engineering focuses on back-end, performance, and edge cases. When paired with a unified analytics platform and clear data contracts, this model scales cleanly across product lines.

    For teams adopting this approach, I recommend a simple operating model: define your core product questions up front, tag features aligned to those questions, connect insights to in-app guides for experiments, and measure user activation and retention continuously. Whether you run Pendo alongside Amplitude analytics or within a broader unified analytics platform, the key is to keep the insight-to-action loop tight.

    The future of product analytics is codeless because it puts insights where they belong—directly in the hands of the people designing the experience. When we remove bottlenecks, we learn faster, ship smarter, and drive measurable PLG impact. That’s how we turn product analytics from a reporting function into a competitive advantage.


    Inspired by this post on Pendo – Best Practices.


    Book a consult png image
  • AI-Powered Growth Loops: Transform Your PLG Product into a Self-Optimizing Engine

    AI-Powered Growth Loops: Transform Your PLG Product into a Self-Optimizing Engine

    Across my teams and portfolio, I’m watching AI fundamentally reshape product-led growth—from static funnels and one-off playbooks to adaptive, compounding growth loops that learn in real time. The shift isn’t just technological; it’s an operating model change that rewards continuous discovery, rigorous instrumentation, and outcome-driven product strategy.

    "Learn how AI is transforming PLG with a new generation of growth loops that can turn your product into a self-optimizing platform." That line captures what I’ve been building toward: systems that sense user intent, decide the next best action, act contextually, and learn to improve the loop with every interaction.

    Here’s the core pattern I rely on. First, sense: unify product analytics and behavioral signals (think Amplitude analytics, Pendo events, Intercom conversations) into a single, queryable, privacy-safe layer. Second, decide: apply AI Strategy—LLMs for product managers, rules, and retrieval—to segment users by intent and probability of success. Third, act: deliver in-app guides, product tours, tooltips, or personalized nudges that accelerate user activation and time-to-value. Finally, learn: run A/B testing with a clear minimum detectable effect (MDE), then feed outcomes back into the model for continuous optimization.

    Activation is where the gains start compounding. With gen ai, I can auto-generate tailored onboarding checklists, dynamic walkthroughs, and contextual help that adapts to the user’s role, data maturity, and current friction points. We’ve moved from generic product tours to precision guidance that updates based on real-time behavior—often lifting first-week activation and shortening time-to-first-value without adding support load.

    Experimentation is the governor that keeps speed and quality in balance. I instrument every growth loop end to end and pair eval-driven development with A/B testing to confirm incremental impact. Amplitude analytics gives me cohort views and path analysis; Pendo or Intercom can deliver in-app variants; a unified analytics platform closes the loop on retention analysis so I’m not optimizing for click-through at the expense of long-term value.

    Retention and expansion are where AI shines as a compounding engine. Retrieval-first pipeline patterns allow instant, contextual support that deflects tickets and boosts perceived product competence. Agentic AI can orchestrate next-best actions—prompting power users toward advanced features, surfacing value moments, or timing expansion prompts when success signals appear. The result is a virtuous cycle: better guidance drives deeper adoption, which improves model accuracy, which unlocks more relevant guidance.

    None of this works without guardrails. I bake in AI risk management from the start: strict data governance, privacy-by-design, human-in-the-loop review for high-impact actions, transparent user consent, and continuous drift monitoring. The goal is reliable automation that users trust—augmented by clear fail-safes when confidence drops.

    Operationally, I anchor the work in empowered product teams and product trios, focus on outcomes vs output OKRs, and practice continuous discovery to validate problems and solutions before scaling. The baseline metrics I watch: activation rate, time-to-value, week-four retention, PQL/PQA conversion, expansion revenue, and support deflection—each tied to a specific growth loop hypothesis.

    If you’re starting fresh, begin with the highest-leverage loop: user activation. Instrument your onboarding journey, define the critical path to value, ship two to three personalized interventions, and measure impact with a precommitted MDE. Scale what wins, drop what doesn’t, and iterate weekly. Once activation is compounding, extend the same approach to adoption depth, collaboration features, and expansion triggers.

    In practical terms, AI-powered PLG is less about flashy features and more about disciplined feedback loops. Build the sensing fabric, keep the decision layer auditable, ship small actions quickly, and treat learning as the product. Do that, and your product doesn’t just grow—it becomes a self-optimizing platform.


    Inspired by this post on Product School.


    Book a consult png image
  • I Built a ‘Pendo Wrapped’ in 10 Minutes with Pendo MCP to Boost Adoption and Delight Users

    I Built a ‘Pendo Wrapped’ in 10 Minutes with Pendo MCP to Boost Adoption and Delight Users

    I set out to create a lightweight, high-impact “Pendo Wrapped” experience for our users—and I did it in under 10 minutes with Pendo MCP. As a VP of Product Management, I’m constantly looking for fast, pragmatic ways to turn product insights into moments that drive engagement. This experiment was about transforming raw analytics into a concise, celebratory year‑in‑review that motivates customers to explore more value. When I say “Pendo Wrapped,” I mean a simple, narrative-style summary of usage highlights: what got adopted, which moments mattered, and where value showed up most clearly. Framed well, that story reinforces product‑led growth by reminding users why they chose us, nudging them toward the next best action, and strengthening activation and retention without heavy development work. My approach was straightforward: define a clear objective (celebrate milestones and prompt the next step), choose a focused set of metrics (adoption, engagement, and activation), and target relevant segments. Then I layered the narrative on top of existing analytics using in‑app guides and product tours to deliver the experience where it matters most—inside the product. The reason it took minutes, not hours, is that Pendo MCP let me work with what we already had—segments, saved reports, and proven guide templates—so I could spend time on the story, not the scaffolding. No code, minimal configuration, and a crisp call to action made it feel polished without being heavy. Increase revenue, cut costs, and reduce risk with Pendo’s Software Experience Management platform. Optimize the entire software experience to drive adoption and improve engagement. If you want to replicate this quickly, start by selecting one user segment and three metrics that matter to them, write a two‑sentence narrative that connects those metrics to outcomes, and ship a short in‑app guide with a single, purposeful CTA. That’s enough to deliver a personalized year‑in‑review feel and spark immediate exploration—no new infrastructure required. What surprised me most was how a small, story‑driven touch created outsized alignment across customers and internal teams. It turned analytics into advocacy, reminded our users of the value they’re already getting, and opened the door to deeper adoption. If you’re pursuing product‑led growth, a fast “Pendo Wrapped” is one of the highest‑leverage experiments you can run this week.

    Inspired by this post on Pendo – Perspectives.


    Book a consult png image