
Quantitative metrics tell the story in numbers; qualitative ones whisper why it matters. Both shape how products grow. Here’s what you need to know.
In my day-to-day, I rely on quantitative metrics to surface what’s changing in the business and where we need to focus. Activation rate, conversion through the onboarding funnel, feature adoption, retention analysis, and LTV/CAC give me a precise read on performance. I also keep an eye on DORA metrics to understand delivery health and deployment frequency, but I never mistake those for customer outcomes. Numbers spotlight signal—but they rarely explain causality on their own.
That’s where qualitative analysis earns its keep. Customer interviews, usability studies, win/loss debriefs, support transcripts, and community feedback give me the context behind the charts. Tools like Pendo help me layer in in-app guides and micro-surveys to capture intent and friction in the flow. This combination turns raw data into decisions that actually move the product strategy forward.
My operating cadence is simple: weekly dashboards to monitor quantitative metrics, ongoing continuous discovery to collect qualitative insight, and a monthly synthesis to reconcile both with our outcomes vs output OKRs. The aim is to move from opinions to evidence, and from anecdotes to patterns. When quant and qual agree, we execute confidently; when they diverge, we design the smallest experiment to learn fast.
I use a three-question decision tree to choose the method. First, are we exploring or validating? Exploration leans qualitative; validation leans quantitative. Second, do we have enough volume for statistical power? If yes, I’ll run A/B testing with a clear minimum detectable effect (MDE) to avoid false positives. If not, I’ll rely on targeted qualitative discovery until we can instrument a meaningful test. Third, will this decision meaningfully impact our product-led growth or user activation goals? If it will, we invest in both measurement and discovery to reduce decision risk.
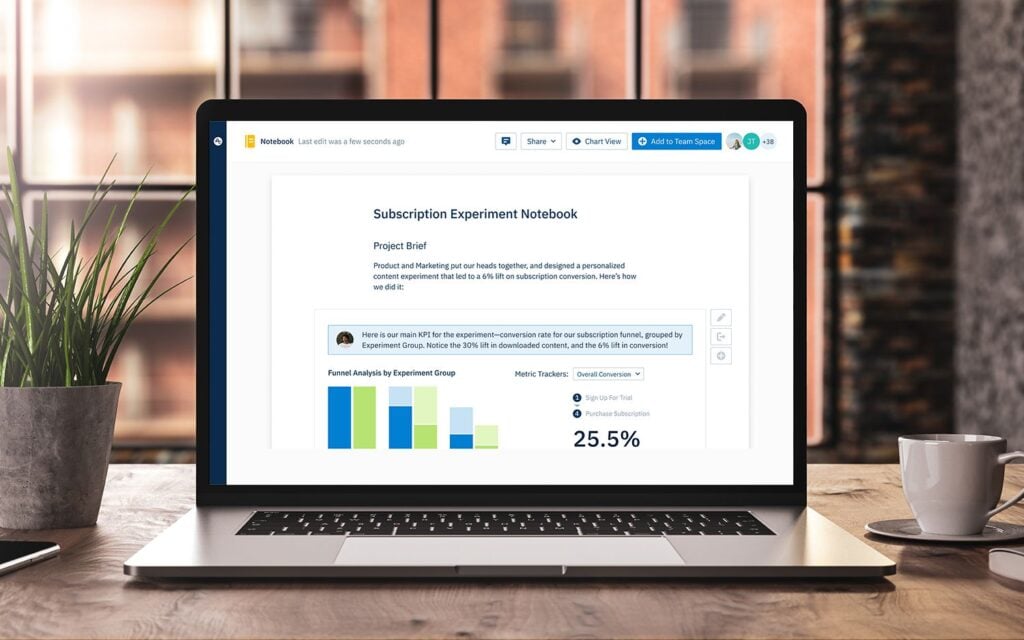
Here’s a concrete example. We once saw a sudden drop in user activation. The quantitative dashboard flagged a step-function change at onboarding step three, but it couldn’t explain why. A quick round of qualitative interviews revealed that our tooltip design buried a critical permission request. We shipped a Pendo-powered in-app guide variant and ran an A/B test to validate the fix. Activation rebounded within a week, and 30-day retention followed suit.
There are common pitfalls I actively avoid. Chasing vanity metrics that don’t ladder up to outcomes. Conflating shipping speed with customer value by over-indexing on DORA metrics. Overfitting with A/B testing when the MDE is unrealistic for our traffic. And on the qualitative side, mistaking a compelling anecdote for a representative sample without triangulating evidence.
If you’re looking to tighten your practice, start with a lightweight playbook: instrument core events in Amplitude analytics; define a small set of outcomes vs output OKRs; schedule recurring customer conversations as part of continuous discovery; tag qualitative insights so patterns surface over time; and pair every material UX change with either a well-powered experiment or a clear qualitative learning goal. This creates a unified analytics and discovery loop that compounds.
Ultimately, quantitative metrics help me prioritize with clarity, while qualitative analysis helps me decide with confidence. When you weave them together, you not only ship faster—you ship the right thing, for the right reason, at the right time.
Inspired by this post on Product School.


Leave a Reply