Inside-out or outside-in thinking? I choose both. The strongest product strategies fuse a bold internal vision with relentless customer evidence, creating a flywheel that lifts adoption, engagement, and revenue while reducing risk.
When I lead with inside-out thinking, I articulate a clear product thesis, technical roadmap, and platform leverage. This is where we define points of parity and differentiation, sharpen our value proposition, and ensure our architecture scales. It’s disciplined, outcomes-first, and anchored in product positioning—not output checklists.
Outside-in thinking ensures that vision stays honest. I listen to customers, analyze friction in onboarding, instrument user activation, and study retention analysis to validate whether our promises translate into real user value. This is where product discovery, A/B testing, and in-app signals tell me what’s working, what needs refinement, and what we should stop doing.
In practice, I operationalize this balance through Software Experience Management. “Increase revenue, cut costs, and reduce risk with Pendo’s Software Experience Management platform. Optimize the entire software experience to drive adoption and improve engagement.” That promise captures the core of how I align strategy with reality inside the product, not just around it.
Concretely, I combine product analytics with in-app guides and product tours to accelerate onboarding and improve user activation. I run targeted experiments to de-risk decisions, and I iterate quickly based on what users actually do—not just what they say. The result is a product-led growth engine that compounds over time.
This approach also builds trust with finance and go-to-market partners. Inside-out clarity gives us confident, sequenced bets; outside-in data provides proof that those bets pay off. When engagement expands and adoption climbs, the business case writes itself.
If you’re deciding where to start, begin with three moves: define activation events aligned to your value proposition, instrument the experience end-to-end, and ship one high-impact in-app guide to remove a known onboarding blocker. Then measure, learn, and iterate—quickly.
The truth is, great products emerge when conviction meets evidence. Inside-out sets the vision. Outside-in earns the right to scale it.
In product reviews and roadmap debates at HighLevel, I come back to a simple truth: great products start with great user research—but even seasoned teams fall into the same traps. After leading product discovery across empowered product teams and product trios, I’ve learned that a few avoidable mistakes consistently derail speed, quality, and outcomes.
Learn how to avoid the top five UX research pitfalls. Discover how AI and qualitative insights can help teams uncover the why behind user behavior.
The “why” behind user behavior is where durable growth lives. When we pair qualitative insights with analytics and a clear AI Strategy, we don’t just validate a solution—we de-risk the roadmap, improve user activation, and increase retention. Here are the five pitfalls I watch for and how I coach teams to avoid them.
Pitfall 1: Treating opinions as insights. Early in my career, I mistook strong stakeholder opinions for customer truth. Now I insist on a clear research question, a decision we will make with the evidence, and a hypothesis we’re trying to falsify. A/B testing is great for measuring impact when you’ve defined minimum detectable effect (MDE), but discovery research demands explicit learning goals and unbiased inputs.
How to avoid it: Write the decision statement first (“We will proceed with X if we learn Y”), then design the research. Keep a visible decision log so insights connect directly to product roadmapping and sprint planning, not to the loudest opinion in the room.
Pitfall 2: Leading questions and flawed methods. I still see interview guides that telegraph the desired answer. This corrupts the signal. Instead, I push teams to pilot guides with a product trio, remove solution language, and focus on behaviors. We complement interviews with in-app guides, targeted surveys, and session reviews using tools like Pendo and Intercom to capture moments of friction in-context.
How to avoid it: Ask neutral, behavior-first questions (“Tell me about the last time you…”) and validate with artifacts (screenshots, workflows). Pilot every guide with a colleague, then refine for clarity and neutrality.
Pitfall 3: Over-indexing on quantitative data and ignoring the why. Amplitude analytics and retention analysis tell me what happened; they rarely tell me why it happened. When teams chase dashboards without pairing them with qualitative interviews, we optimize for surface-level metrics and miss underlying jobs, anxieties, and unmet needs.
How to avoid it: Pair funnels and cohorts with a short round of qualitative interviews. Use Generative AI to summarize transcripts, cluster themes, and highlight contradictions, then validate themes against Amplitude analytics and CRM integration data. The synthesis is where insight emerges.
Pitfall 4: Recruiting bias—talking only to superfans or the most vocal detractors. If we only hear from power users, we build for edge cases; if we only hear complaints, we over-index on blockers. The result is a lopsided roadmap that misses mainstream value.
How to avoid it: Recruit across segments—new users, churned users, evaluators who never converted, and adjacent personas. Balance the sample and document who you didn’t talk to. For sensitive segments, lean on privacy-by-design practices and data governance so participants feel safe sharing candid feedback.
Pitfall 5: Weak synthesis and no path to action. Research often ends with a beautiful report that gathers dust. Insights must translate into choices: what we will do, what we will not do, and what we must learn next. Without this, research slows delivery without improving outcomes.
How to avoid it: Convert findings into atomic insights with evidence, confidence, and impact. Tie each insight to outcomes vs output OKRs, then schedule a decision review with the product trio. If you can’t articulate the decision, you haven’t finished the research.
How I use AI without losing the plot: I rely on LLMs for product managers to speed the busywork, not to replace judgment. Gen AI helps me transcribe, tag, and cluster themes; extract Jobs to Be Done; detect hesitation and sentiment; and draft UX writing variants for follow-up surveys. With a ChatGPT connector or similar tools, I can map qualitative themes to Amplitude analytics events and Pendo paths, revealing the narrative behind the numbers.
Guardrails matter: I apply AI risk management and privacy-by-design principles—no sensitive data in prompts, clear consent, and human-in-the-loop validation. AI is a force multiplier when the prompts are grounded in a solid research plan and the outputs feed a real decision.
A quick checklist I share with teams: define the decision and hypothesis; recruit a balanced sample; use neutral, behavior-first questions; triangulate quant with qual; synthesize into atomic insights; and link every insight to a concrete action or OKR. Do this, and you compress time-to-learning without sacrificing rigor.
When we respect the craft of research and thoughtfully apply AI, we consistently uncover the why behind user behavior—and build products that users adopt, love, and keep. That’s the fastest path to product-led growth and durable differentiation.
Inspired by this post on Amplitude – Perspectives.
Time to value is the most reliable early indicator of long-term user retention I know. When customers experience meaningful product impact fast, they stick around, expand, advocate, and cost less to support. Over the years leading product teams, I’ve learned that speed-to-impact isn’t a nice-to-have—it’s the engine behind sustainable product-led growth and efficient go-to-market.
Accelerate retention by reducing time to value. Learn how faster product impact drives growth, reduces costs, and keeps users engaged in the long term.
Practically, I define time to value as the duration from first touch (or first login) to the moment a user achieves their “aha” outcome—something tangibly useful aligned to their job-to-be-done. The shorter that journey, the higher the likelihood of user activation, trial conversion, and durable engagement. This is why I obsess over onboarding, in-app guides, product tours, and the clarity of our value proposition.
My first move is to map the Minimum Path to Value (MPV): the smallest set of actions needed to deliver a real result for a new user. I strip away everything non-essential in that path—fields, clicks, choices, and jargon. Opinionated defaults, smart templates, sample data, and single-player workflows let customers succeed in minutes, not days. The goal is to reduce cognitive load while making the next best action unmistakably clear.
Instrumentation turns TTV from a hunch into a system. I track activation events, cohort retention, and conversion using platforms like Amplitude analytics and Pendo, with timely nudges through Intercom when users stall. I look at the distribution of TTV (not just the average), correlate it with retention analysis, and set explicit targets such as “new users reach first value within 10 minutes.” Those targets become team-level outcomes—not outputs—and we review them weekly.
Experimentation is how we iterate toward the fastest path to value. I rely on A/B testing to compare onboarding flows, progressive profiling to delay non-critical inputs, and opinionated setup wizards to remove guesswork. Auto-generated example projects, pre-configured integrations, and guided checklists accelerate user activation without sacrificing flexibility for advanced users.
Content and guidance matter as much as UX. Tooltips, contextual in-app guides, and short product tours should be timely, skippable, and laser-focused on the outcome, not the feature. I pair these with a concise knowledge base and short explainer videos that reinforce the same value narrative a user sees inside the product.
Cross-functional alignment is essential. Product, marketing, sales, and customer success must rally around the same activation metric and TTV target. That alignment ensures our trial messaging, onboarding emails, and CS playbooks don’t compete—they compound. When everyone points to the same first-value moment, friction drops and adoption rises.
Pricing and packaging can also accelerate time to value. Free trials should be long enough for users to credibly reach first value; usage-based gates should never block the MPV. I prefer to unlock everything needed to hit the “aha” moment, then meter after the value is viscerally felt—this respects the user’s time and reinforces trust.
There’s a cost story, too. Faster time to value reduces tickets, shortens onboarding cycles, and lowers cost-to-serve. It also clarifies product discovery: when we see where users stall, we don’t guess at roadmap priorities—we let the data guide our next bet.
In my experience at HighLevel, I’ve repeatedly seen activation rates jump when we cut time to value from days to minutes. The specific tactics vary by product, but the pattern holds: when the first outcome is undeniable and fast, retention follows—and so does efficient growth.
If you’re looking for a starting point, try this: define one activation event that clearly signals value, instrument it end-to-end, design a Minimum Path to Value that gets new users there in under 10 minutes, and run weekly experiments until you consistently hit the target. Do that, and you won’t just improve onboarding—you’ll build a product that earns loyalty from the very first session.
Inspired by this post on Amplitude – Best Practices.
Every market-winning product I’ve helped build started with a positioning statement that was clear, defensible, and memorable. When I lead new initiatives at HighLevel, Inc., I treat positioning as a product decision—because it sets the guardrails for what we prioritize, how we execute, and how we tell the story across the entire go-to-market engine.
Your product positioning statement decides if you stand the test of time. Learn how other expert products do it and how to write one that sticks.
At its core, a positioning statement is the sharpest articulation of who we serve, the problem we solve, the category we compete in, the value proposition we deliver, and why we win. It is not a tagline or a pitch deck sentence; it’s the decision calculus that aligns product, marketing, sales, and customer success so we can move fast in one direction.
Here’s the simple template I use and coach teams on: For [target customer/segment] who [urgent need or job-to-be-done], [product name] is a [category or frame of reference] that [core value proposition]. Unlike [primary alternative or status quo], it [competitive differentiation and reasons to believe]. When this fits, everything from roadmaps to demos becomes easier—and conversions tend to follow.
Start with the target segment. Be precise about who you are for. I triangulate with retention analysis and behavioral data (e.g., Amplitude analytics) to find the cohorts that activate quickly, retain well, and expand. If you cannot name the segment in one line, you’ll struggle to land positioning anywhere else.
Next, define the customer outcome. Tie the promise to measurable “outcomes vs output OKRs.” Customers buy progress, not features. State the job-to-be-done in their language and anchor it to a business result they already track.
Choose your category and points of parity. Category is a cognitive shortcut; it tells buyers where you sit on their mental map. Points of parity are table stakes you must match to be considered. If you skip parity, you look incomplete; if you skip category, you look confusing.
Then sharpen your competitive differentiation and value proposition. What do you do uniquely well that competitors can’t easily copy? Back it up with reasons to believe—proof points like speed-to-value, measurable ROI, data governance, or privacy-by-design and cybersecurity commitments. Credibility turns claims into confidence.
Validate the statement through rigorous A/B testing. I pressure-test the language across landing pages, onboarding flows, in-app guides, sales call talk tracks, and nurture sequences. Tools like Pendo, Intercom, and HubSpot make it easy to instrument message experiments and see what actually moves activation, conversion, and expansion.
Operationalize the winning statement across go-to-market strategy and product-led growth motions. Bake it into onboarding, product tours, pricing pages, and demo narratives. A strong positioning statement should shape prioritization in the roadmap as much as it shapes the headline on your website.
Beware common pitfalls. Don’t confuse vibe marketing for positioning. Avoid vague superlatives that any competitor could claim. Don’t aim for universal appeal; specificity sells. And never let the statement drift—revisit it after major launches, new segments, or shifts in competitive dynamics.
Here’s an example using the template: For revenue teams at mid-market SaaS companies who need faster, more predictable pipeline creation, SignalFlow is a unified analytics platform that turns product usage signals into qualified opportunities. Unlike generic CRMs and static lead scoring, it surfaces intent in real time and automates outreach, improving conversion by 22% within 30 days.
If your team debates features more than outcomes, it’s time to revisit your positioning. In my experience, one crisp sentence can unlock alignment, accelerate execution, and make your message stick. Write it, test it, and make it the north star for every decision you ship.
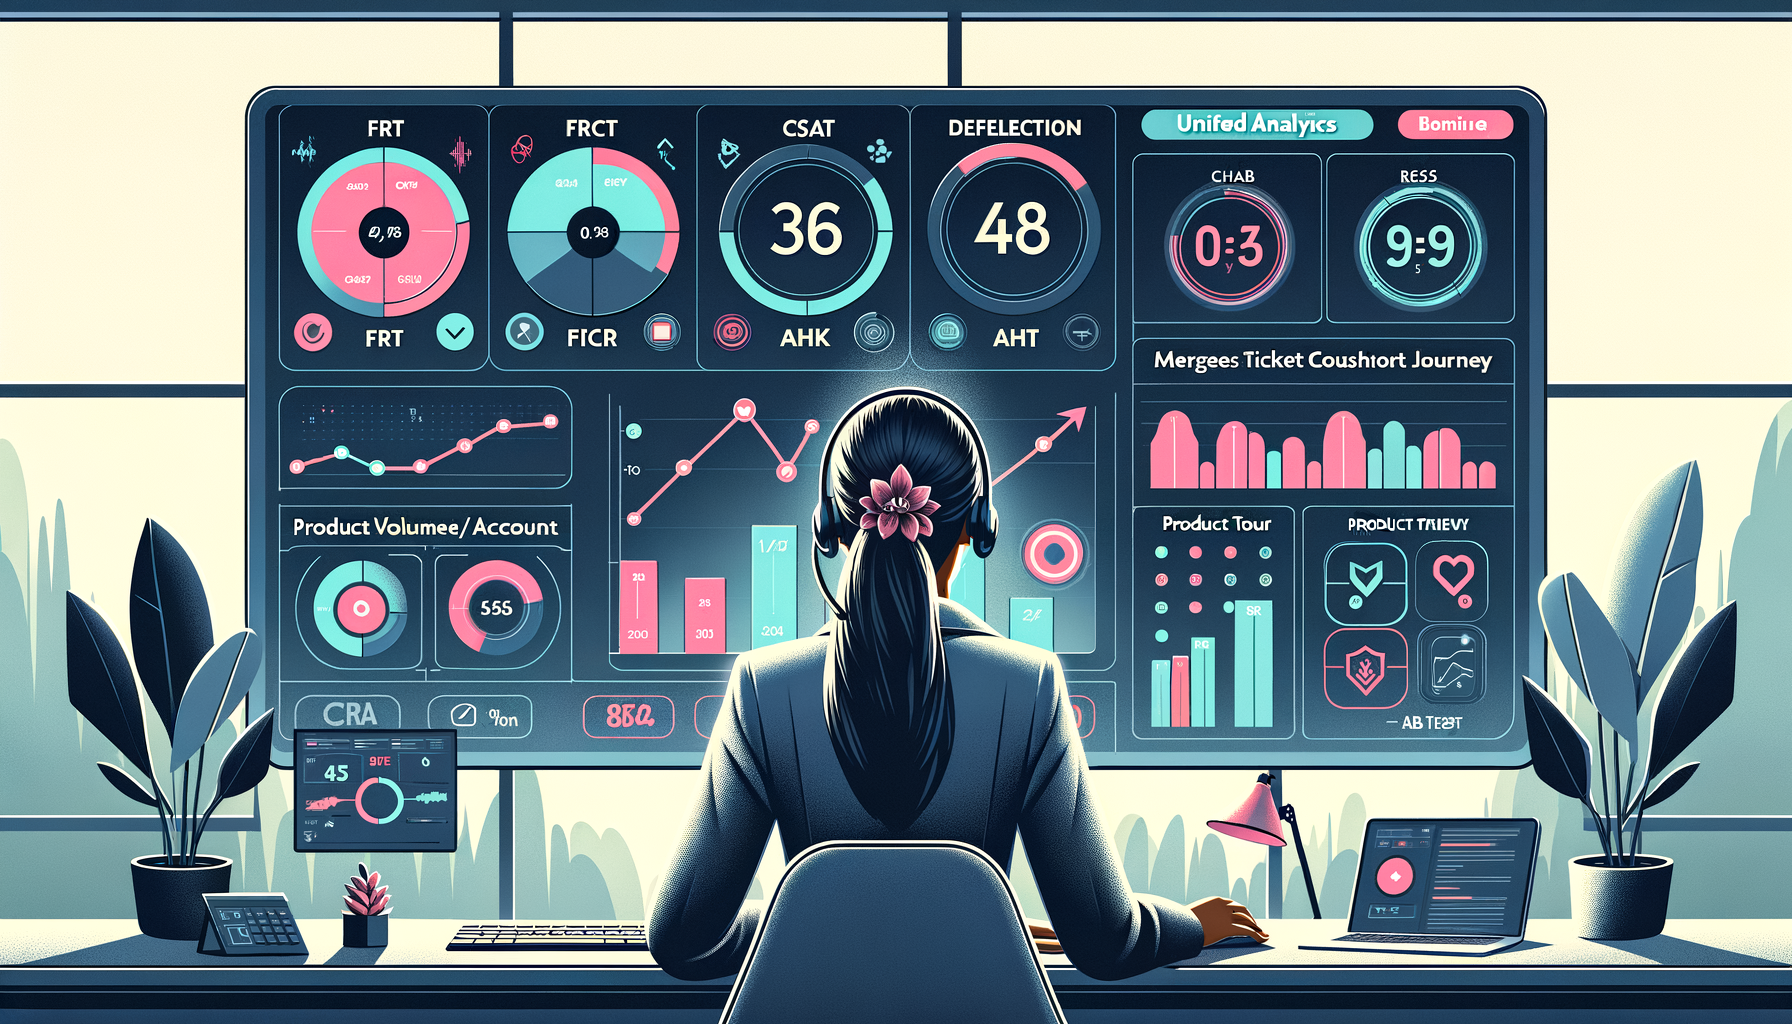
I treat agent performance analytics as a strategic product lever, not a back-office metric. When I combine Pendo’s product signals with Agent Analytics from our support systems, I get a unified view of where users struggle, how agents intervene, and which in-app experiences accelerate resolution. That visibility lets my team drive product-led growth and improve customer experience while lowering support costs.
Increase revenue, cut costs, and reduce risk with Pendo’s Software Experience Management platform. Optimize the entire software experience to drive adoption and improve engagement.
In practice, I build a clear scorecard that blends both product and support KPIs: first response time, resolution rate, first contact resolution, CSAT, containment/deflection rate, average handle time, ticket volume per active account, onboarding completion, user activation, and time-to-value. This balanced view ensures we reward not just speed, but durable outcomes that reduce repeat contacts and improve retention.
To make the data actionable, we connect our CRM integration, ticketing events, and Pendo product analytics in a unified analytics platform. That gives me cohort-level clarity—who needed help, what they were doing before opening a ticket, how agents responded, and whether users stayed engaged afterward. With clean instrumentation and consistent taxonomies, Agent Analytics becomes a reliable operating system for both product and support leadership.
I then use in-app guides, tooltips, and product tours to proactively address the top friction points that drive ticket volume. Through A/B testing, we compare cohorts exposed to guided workflows versus control groups, measuring deflection, faster task completion, and downstream conversion. When a guide meaningfully reduces tickets for a given workflow, we promote it from experiment to standard onboarding, and we feed those learnings back into our roadmap.
The real unlock comes from tying outcomes to business impact. I track how improvements in resolution quality and self-serve adoption influence expansion revenue, support cost per account, and risk signals like churn propensity. Retention analysis helps us validate whether reduced friction and better agent coaching translate into sustained engagement and healthier accounts.
Operationally, Agent Analytics helps me coach teams with precision. I spotlight high-performing behaviors, identify knowledge gaps, and standardize winning playbooks directly in the product via in-app guidance. This approach empowers agents, shortens onboarding for new hires, and keeps our best practices current as the product evolves.
None of this works without trust. We apply privacy-by-design principles and strong data governance, ensuring that analytics, coaching, and automation respect user consent and data minimization standards. With that foundation, we can scale confidently—experiment faster, learn from every interaction, and continuously improve the software experience.
If you’re getting started, begin by baselining your agent and product KPIs, ship one high-impact guide to deflect a top ticket driver, and review results weekly. Within a quarter, you’ll have a repeatable loop: diagnose friction, test an in-app solution, measure deflection and satisfaction, and reinvest the gains into the next set of improvements.
When I think about the difference between a roadmap that moves the business and one that simply ships output, impact analysis is the habit that changes everything. It gives me and my product trios a disciplined way to forecast value, align stakeholders, and de-risk bets before a single sprint starts. Over the years, I’ve seen great ideas fail not because they were bad, but because we couldn’t articulate, test, and track their true impact. That’s the problem impact analysis solves.
Impact analysis, in practice, is a structured method for predicting how a proposed change will influence user behavior and business outcomes—and then validating those predictions with data. Uncover what impact analysis is, why it matters, and how to do it with proven methods and clear steps for product teams. When done well, it translates strategy into evidence-backed choices that strengthen our value proposition and accelerate product-led growth.
I use impact analysis at three key moments: during product discovery to vet opportunities, in product roadmapping and sprint planning to prioritize, and post-launch to confirm that outcomes beat expectations. It is equally useful for net-new features, UX improvements, pricing changes, and even enablement like in-app guides or product tours.
Step 1: Define the outcome with precision. I anchor every proposal to outcomes vs output OKRs, choose one primary success metric, and record the current baseline. If we plan to experiment, I estimate the minimum detectable effect (MDE) to ensure our A/B testing can actually validate the expected lift. This protects us from investing in ideas that are too small to measure or too broad to manage.
Step 2: Map the causal chain. I translate the idea into a simple impact map: feature change → user behavior (activation, frequency, conversion, retention) → business outcome (revenue, cost, risk, satisfaction). This clarifies what must change in user behavior and why users would care—forcing us to revisit our value proposition if the link feels thin.
Step 3: Size the upside and reach. I estimate who will be exposed (reach), how often (frequency), and the expected behavior change (conversion delta). I complement this with RICE (reach, impact, confidence, effort) or cost of delay to compare options. The goal isn’t perfect math; it’s consistent, transparent assumptions that we can pressure test with data.
Step 4: Evaluate risk, complexity, and dependencies. I assess technical effort, privacy-by-design considerations, data governance needs, and cross-team sequencing. This is where stakeholder management becomes essential—aligning Engineering, Design, GTM, and Security early so we don’t discover hidden blockers mid-sprint.
Step 5: Design the evidence plan. For changes where causality matters, I prefer A/B testing with the right MDE and guardrail metrics. I instrument events and set up dashboards in a unified analytics platform (Amplitude analytics, Pendo, or a homegrown stack) so we can monitor leading indicators quickly. If experiments aren’t feasible, I use sequential rollouts, synthetic controls, or pre-post analyses with clear caveats.
Step 6: Communicate the decision. I share a one-page impact brief that summarizes objectives, hypotheses, metric choices, expected lifts, risks, and the test plan. This reduces debate time, improves stakeholder trust, and enables empowered product teams to move faster with clarity.
Step 7: Ship, monitor, and learn. After launch, I track leading indicators within days and validate lagging outcomes over weeks. I run retention analysis and cohort reviews to confirm that behavior change sticks, and I write a short learning memo—especially when we miss—so future bets get sharper.
On a recent initiative, our team debated whether to build a new onboarding flow or invest in targeted in-app guides. The impact analysis showed the guide approach would reach 3x more users in the next quarter, require half the effort, and be easier to A/B test end-to-end. We shipped the guides, saw a measurable lift in activation, and then recycled those insights to inform the broader onboarding redesign. The analysis didn’t just pick a winner—it created a faster path to compounding outcomes.
Common pitfalls I watch for: chasing vanity metrics, assuming linear impact at scale, ignoring confidence and variance, and skipping instrumentation. Another trap is treating impact analysis as a heavyweight doc—keep it lightweight, comparable across initiatives, and tightly tied to decision-making.
My lightweight template: one sentence on the desired outcome and OKR; a causal chain with the key behavior change; a simple sizing with reach, impact, and confidence; risk and dependency notes; the experimentation plan; and the decision. If we can’t write that in one page, we probably don’t understand the bet well enough to pursue it yet.
The next time you review your roadmap, pick your top three bets and run this playbook. You’ll sharpen your prioritization, increase stakeholder confidence, and give your team a clear line of sight from product discovery to measurable outcomes. That’s how we build momentum, quarter after quarter.
Too many teams still celebrate what they ship rather than what they change. I’ve learned—sometimes the hard way—that the most expensive mistake in product management is confusing outputs with outcomes. Understand the key differences between output vs. outcome in product management — and how to keep your team focused on what really drives results.
Here’s how I draw the line: outputs are the features, tickets, and releases we produce; outcomes are the measurable changes in user behavior and business performance we create—activation rates, retention, expansion, and time-to-value. If an initiative doesn’t move a metric that matters, it’s output without impact. That’s how feature factories are born.
The confusion is costly because it distorts incentives. Teams optimize for velocity, story points, or deployment frequency and mistake motion for progress. Engineering excellence and DORA metrics matter, but they’re not substitutes for product outcomes. When OKRs drift into task lists, we ship more and learn less. I’ve seen ambitious roadmaps hit every delivery date and still miss the market because we didn’t change customer behavior.
To break that cycle, I anchor planning and reviews to outcome-based OKRs. A good objective might be: increase new-account user activation from 28% to 45% this quarter. The anti-pattern is: ship onboarding redesign v2. The former sets a clear behavioral target; the latter constrains creativity and locks us into a solution before discovery. This is the practical heart of outcomes vs output OKRs.
From there, I define leading indicators that predict the desired outcome—time-to-first-value, completion of core actions, day-7 retention—and instrument them early. Tools like Amplitude analytics help us see whether an experiment is unlocking behavior change or just producing activity. I also set guardrail metrics (support volume, performance, and NPS) so we don’t “succeed” by creating a new failure mode.
The delivery model matters, too. Empowered product teams—built as product trios of product, design, and engineering—own the problem and the outcome. We invest in product discovery to validate assumptions, size opportunities, and find the minimum viable change that moves the metric. A/B testing with a clear minimum detectable effect (MDE) makes our experiments faster, cheaper, and more conclusive.
Roadmaps then become strategic bets rather than feature lists. Each bet articulates the opportunity, the hypothesized solution, the expected outcome, and the evidence that would change our mind. In sprint planning, we slice increments to learn sooner, not just to deliver sooner. CI/CD accelerates shipping; outcome instrumentation accelerates learning.
Stakeholder conversations shift as well. Instead of debating which features to build, we align on the customer problem, the value proposition, and the measures of success. QBRs showcase what changed—activation, adoption, retention—not just what shipped. This is how we move from feature requests to outcome commitments and sustain product-led growth.
I’ve found that outcomes-first execution energizes teams. Clarity of purpose invites creativity, and the autonomy to experiment fuels ownership. When we celebrate behavior change over backlog burn-down, we stop playing to the roadmap and start playing to win the market.
If your team is stuck in output mode, start small: rewrite one key objective as an outcome, instrument a leading indicator, and run a scoped experiment. When the metric moves, let that win reset the culture. Momentum follows outcomes.
I obsess over why users do what they do. When I connect the dots between behavior and emotion, product decisions get clearer, roadmaps get sharper, and outcomes improve fast. Customer sentiment analysis is the discipline that helps me bridge that gap between numbers and nuance—turning scattered feedback into a focused narrative that drives product-led growth and retention.
Want to understand the thoughts and feelings that drive user actions? This guide to customer sentiment analysis shows you how to listen and respond.
At its core, customer sentiment analysis blends quantitative signals (usage telemetry, conversion, churn) with qualitative insight (support conversations, reviews, in-app feedback) to reveal why users behave the way they do. I use it to pinpoint friction in onboarding, accelerate user activation, and reinforce the value proposition across the journey. The result is a product experience that not only performs but also resonates.
Here’s how I listen at scale. I aggregate inputs from support tickets and call transcripts, in-app feedback widgets, community posts, and social listening; I supplement them with product analytics from Amplitude analytics, guidance and event data from Pendo, and conversation and engagement patterns from Intercom. With strong CRM integration to HubSpot and a unified analytics platform, I can tie sentiment to accounts, lifecycle stages, and revenue impact—so every signal is actionable, not anecdotal.
On the analysis side, I segment feedback by journey stage (onboarding, activation, adoption, expansion, churn risk) and classify it by theme (usability, reliability, pricing, time-to-value). Gen ai and LLMs for product managers help me summarize large volumes of text, cluster topics, and score sentiment with speed, while I maintain guardrails through data governance, privacy-by-design, and clear AI risk management policies. The aim isn’t just a score—it’s a storyline I can act on.
Closing the loop is where sentiment turns into outcomes. If I see negative sentiment around first-run complexity, I streamline onboarding, add contextual product tours and in-app guides, and refine tooltip design and UX writing. I then validate improvements with A/B testing, watch minimum detectable effect (MDE) thresholds, and track movement on activation, NPS/CSAT, and early retention. This rhythm creates a durable feedback-to-feature pipeline that compounds over time.
Operationally, I run a recurring sentiment review with product trios and cross-functional leaders. We connect insights to outcomes vs output OKRs, pressure-test bets through product discovery, and prioritize work that measurably reduces friction. When sentiment and behavior point to the same problem, it moves to the top of the roadmap. When they diverge, we dig deeper before we build.
If you’re getting started, begin with the highest-value surfaces: onboarding and activation. Instrument the journey, centralize feedback, and label themes consistently. Use small, targeted experiments to address the loudest pain points, then scale what works. Over a few cycles, you’ll see clearer insights, faster decisions, and a product experience that feels intuitively “right” to your users—because it’s grounded in their words and their behavior.
I obsess over retention because it tells me the truth about product-market fit, value delivery, and revenue durability. In my role leading product strategy at HighLevel, I’ve learned that sustainable growth comes less from adding users and more from keeping the right ones engaged, successful, and expanding. The fastest way to get there is through a disciplined view of the right customer retention metrics.
Struggling to keep users? These customer retention metrics reveal what’s working, what’s not, and where to focus to reduce churn.
When I assess a product’s health, I look for a clean story across acquisition, activation, engagement, and expansion—then I validate that story against revenue outcomes. If those lines don’t reconcile, churn is coming. That’s why I track a core set of signals that expose value gaps early, guide product-led growth, and align go-to-market with actual customer outcomes.
Here are the 15 signals I rely on to diagnose retention risk and prioritize roadmaps: logo churn rate, gross revenue retention (GRR), net revenue retention (NRR), cohort retention by signup month, activation rate, time-to-value (TTV), feature adoption rate, DAU/WAU/MAU and stickiness (DAU/MAU), session frequency and duration, expansion revenue rate, contraction/downgrade rate, customer lifetime value (CLV), onboarding completion rate, customer health score, and support tickets per account with time to resolution. Together, these metrics show whether customers realize value quickly, keep finding more value over time, and are willing to grow with the product.
Here’s how I use them in practice. If activation rate or time-to-value slips, I invest in onboarding clarity, in-app guides, and product tours to remove friction and accelerate first success. If GRR weakens, I re-examine renewal messaging, pricing fairness, and critical feature gaps. If NRR stalls, I revisit packaging, discovery-driven upsell paths, and the expansion moments that naturally occur after users unlock initial value.
A unified analytics platform connecting product usage, lifecycle events, and CRM integration is essential. I pair cohort analysis in Amplitude analytics with qualitative insights from Intercom, then use Pendo to instrument in-app nudges and measure feature adoption lift. A/B testing helps me validate which interventions move the metrics that matter, not just vanity engagement.
Cadence matters. I review leading indicators weekly (activation, TTV, feature adoption), lagging indicators monthly (GRR, NRR, CLV), and cohort retention every quarter to ensure improvements compound. This rhythm keeps teams aligned on outcomes vs output and focuses energy where it reduces churn fastest.
If you adopt only one habit, make it this: tie every roadmap bet to a specific movement in these retention metrics, then measure relentlessly. When we do this well, our product doesn’t just acquire users; it earns loyal advocates—and that’s the most efficient growth engine there is.
What if your customer feedback loop is the reason you're stuck? Learn how to build one that fuels real growth and changes your product for the better.
I’ve seen talented teams spin for months because their customer feedback loop was noisy, slow, or misaligned with outcomes. The result is predictable: roadmaps packed with output, not impact. When we design feedback loops that are intentional, instrumented, and closed with customers, the product starts compounding value—and the business moves from reactive to product-led growth.
My definition of a strong customer feedback loop is simple: capture the right signals, synthesize them quickly, prioritize against outcomes, experiment to de-risk, and close the loop visibly with customers. If any link is weak, the whole system underperforms. More feedback isn’t better—better feedback is better.
Start with who you listen to. Segment feedback by persona, account tier, lifecycle stage, and “jobs to be done.” A founder’s feature request, a new user’s onboarding friction, and a power user’s edge case should not be weighted the same. This is the foundation of credible product discovery.
Instrument your product so qualitative and quantitative signals reinforce each other. I rely on funnel and cohort views in Amplitude analytics to see where activation or retention breaks, then layer in interviews, support tickets, and community threads for context. When telemetry and narrative align, the signal gets unmistakable.
Capture feedback where the user is. In-app guides and lightweight surveys via Pendo or Intercom surface timely prompts during key journeys (onboarding, activation, adoption, renewal). Pair those with structured inputs from sales notes and customer success reviews so you don’t bias toward only the most vocal users.
Standardize how you synthesize. Tag every item by problem statement, persona, job, and affected step in the journey. Roll these up into weekly themes your product trios can act on. The discipline here turns anecdotes into addressable opportunities.
Prioritize against outcomes, not volume. If your OKRs are outcomes vs output OKRs, tie each opportunity to a measurable product outcome like user activation rate, adoption depth, conversion, or retention. A thousand upvotes mean less than a clear path to move a core metric.
De-risk with evidence, not opinion. Frame hypotheses, define success metrics, and run A/B testing with a clear minimum detectable effect. Guardrail metrics matter—never trade a short-term click lift for a long-term retention drop. Experiments should accelerate learning, not justify pet projects.
Fold learning into product roadmapping and sprint planning. I expect prioritized feedback themes to map to roadmap bets with clear owners, milestones, and expected impact. This is how product management leadership signals what we will do—and what we will not do—based on evidence.
Close the loop, every time. Tell customers what changed because of their input—release notes, in-app messages, CSM follow-ups, or community updates. When people see their voice shaping the product, engagement and loyalty rise. This is also how you earn higher-quality feedback next time.
Set a cadence and governance that sticks. A weekly Voice of Customer review for the product trio, a monthly synthesis for cross-functional stakeholders, and a quarterly lookback tying changes to retention analysis creates organizational memory. Feedback isn’t a meeting; it’s a muscle.
Beware common failure modes. Don’t overweight loud accounts, confuse feature requests with problems, or ship one-off fixes that fragment your value proposition. Avoid vanity dashboards that show activity without decision-making power. If your loop doesn’t routinely change priorities, it isn’t a loop—it’s a suggestion box.
If you’re starting from scratch, keep it simple: define your core outcomes, instrument the top journeys, establish two capture channels (in-app and human-led), create a shared taxonomy, and commit to a weekly synthesis ritual. In a few cycles, you’ll see cleaner insights, tighter bets, and faster learning.
Done right, customer feedback loops are a competitive advantage. They sharpen product discovery, accelerate user activation, and compound retention—exactly what a modern, product-led organization needs to grow with confidence.
In fast-moving product organizations, the skills that got us here won’t carry us through the next wave of change. I’ve learned that future-proofing a team is less about hiring unicorns and more about deliberately growing the skills we already have—and doing it with intention.
Upskilling and reskilling aren’t the same. Knowing the difference can help you build smarter teams and avoid costly missteps in your L&D strategy.
Here’s how I frame it with my leaders: upskilling deepens capability in the role someone already holds—think strengthening discovery, data fluency, or stakeholder management inside an existing lane. Reskilling pivots talent into a new lane—say, a support engineer into data engineering or a product marketer into product operations. Both are essential to building empowered product teams, but they solve different problems.
Deciding which path to take starts with the roadmap and strategy. If your outcomes vs output OKRs signal a need for better execution in current domains, upskilling is the lever. If your strategy introduces new bets—gen AI, privacy-by-design, or a shift to platform architecture—reskilling becomes a strategic investment. I run a simple gap analysis: inventory current skills, map them to near-term outcomes, and identify high-leverage gaps by team.
When I upskill, I prioritize learning in the flow of work. That means structured practice—not just courses—embedded into product discovery, product trios rituals, and code reviews. Shadow sessions, lightweight playbooks, and in-app guides turn new concepts into repeatable muscle memory. For new managers, I add targeted coaching for the IC to manager transition, because role clarity and feedback fundamentals compound quickly.
When I reskill, I treat it like a product launch. There’s a clear charter, staged milestones, a mentor, and onboarding tailored to the new role. I timebox practice projects, use product tours and internal sandboxes, and pair people with forward deployed engineers or senior PMs to accelerate context. The goal is confidence and competence, not just completion.
Measurement keeps the investment honest. I track time-to-productivity during onboarding, deployment frequency and DORA metrics for engineering-heavy paths, and retention analysis for people outcomes. For product and design, I look at decision quality in discovery, reduced cycle time from insight to iteration, and the clarity of written strategy. All of it rolls up into OKRs so learning is tied to business outcomes, not just activity.
The AI wave has made this even more urgent. I’m deliberately upskilling PMs on LLMs for product managers, responsible AI Strategy, and data governance, while reskilling a subset of engineers and analysts into applied gen AI roles. We cover prompt design, evaluation frameworks, and privacy-by-design basics, then ship small internal tools to turn theory into practice.
Culture makes or breaks all of this. I set explicit learning budgets, protect focus time, and model the behavior—publishing my own learning roadmaps and post-mortems. Stakeholder management matters too: I align expectations in QBRs vs OKRs, broadcast progress, and celebrate skill gains the same way we celebrate product wins. When people see that growth is visible and valued, momentum builds.
One example that sticks with me: we reskilled a cross-functional cohort into analytics and experimentation while simultaneously upskilling our existing PMs in discovery synthesis. Within a quarter, decisions got crisper, experiments shipped faster, and collaboration across product trios felt effortless. The compounding effect was unmistakable.
If you’re starting from zero, keep it simple: map the skills you have, the outcomes you need, and choose one upskilling and one reskilling initiative you can deliver in the next 90 days. Make learning visible, measure what matters, and iterate. The teams that master this discipline won’t just keep up—they’ll set the pace.
I’ve learned the hard way that growth isn’t about dashboards crowded with vanity metrics. When I evaluate whether a product is poised to scale, I start with one question: are new users truly activating? If not, everything else is noise.
"Forget vanity metrics. User activation is the compass that shows if your product or organization is lost or scaling."
When I say user activation, I mean the precise, observable milestone where a new user experiences core product value—often within their first session or first week. That might be launching a first campaign, connecting a CRM integration, or completing the key workflow that makes the product indispensable. Activation rate then becomes my primary KPI, far more meaningful than signups or pageviews because it ties directly to retention, expansion, and long-term revenue.
Why does activation predict scale? Because it’s a leading indicator of sustained product-market fit. High activation correlates with stronger retention curves, higher feature adoption, and healthier unit economics. If activation improves, cohorts decay more slowly and customer value compounds. If activation stalls, no amount of top-of-funnel spend or go-to-market strategy will save you from churn.
Here’s how I operationalize activation. First, I define the activation event from first principles, grounded in our value proposition and product positioning. I pressure-test that definition with real users through product discovery, then codify it as a measurable event so it’s unambiguous and auditable across teams.
Second, I instrument the end-to-end journey. Using a unified analytics platform with tools like Amplitude analytics and Pendo, I track time-to-value, drop-off points, and the exact steps users take before and after the activation milestone. I design experiments with a clear minimum detectable effect (MDE) so A/B testing yields decisions, not debates.
Third, I build onboarding that accelerates value realization. In-app guides, contextual product tours, and thoughtful tooltip design reduce friction while keeping users focused on the critical path to activation. Every element in onboarding earns its place by improving activation rate or shortening time-to-value—otherwise, it goes.
Finally, I align the organization around outcomes, not outputs. I set outcomes vs output OKRs tied to activation, run weekly reviews with empowered product teams and product trios, and ensure our product-led growth motion reinforces the activation moment. This creates a shared language from product to sales to customer success.
When activation rises, the path forward gets clear: retention strengthens, expansion opportunities emerge, and scaling becomes a matter of capacity rather than guesswork. When activation falters, it’s a signal to pause, refine the value narrative, and fix the experience. Either way, activation tells the truth. If you want to build a product that truly scales, make user activation your north star.