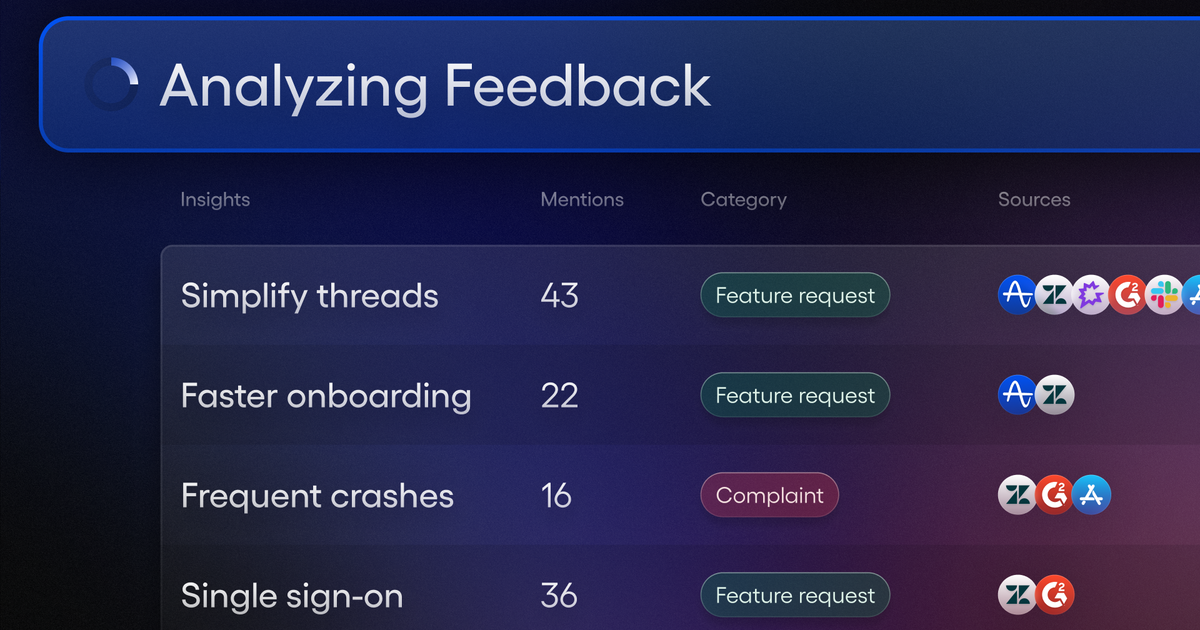
In fast-moving product cycles, weak signals slow teams down and let avoidable issues linger. I’ve been leaning on Session Replay to strengthen those signals and align stakeholders faster, especially when we’re balancing roadmap bets with day-to-day reliability fixes.
Discover how frustration analytics, error analytics, and shareable filters in Session Replay help you spot problems faster and collaborate more effectively.
Frustration analytics has become my shortcut to the moments that truly matter. Instead of sifting through countless replays, I start where friction peaks and focus on the sessions that best represent real user pain. In one onboarding flow, these insights pointed us to a confusing step that was suppressing user activation; a simple adjustment to the layout and copy led to higher completions and fewer support tickets.
Error analytics turns anecdotes into evidence. By pairing error trends with conversion and retention analysis in Amplitude analytics, we isolate the defects with the highest customer and revenue impact. That clarity helps my team sequence fixes in sprint planning with confidence—and it gives leadership a clean narrative for why certain issues deserve priority now.
Shareable filters have been a quiet superpower for cross-functional collaboration. I create saved views for specific cohorts—first-time users, power users, or high‑value accounts—so engineering, design, and support can reproduce exactly what I’m seeing in Session Replay. No more screen recordings in Slack or back-and-forth on “what filters did you use?” Everyone starts from the same context and moves to decisions faster.
This workflow fits naturally into how our product trios practice continuous discovery. We pick one question each week, open a shared filter, and review a handful of targeted sessions together. Within the same unified analytics platform, we connect what we observe to metrics that matter, then translate insights directly into product roadmapping and sprint planning without losing momentum.
If your goal is sharper detection of issues and stronger collaboration across stakeholders, these capabilities deserve a place in your toolkit. They compress time-to-insight, improve stakeholder management, and fuel product-led growth by focusing attention where it delivers the most customer value.
Inspired by this post on Amplitude – Best Practices.
I’m constantly looking for ways to collapse the distance between product questions and trustworthy answers. When behavioral data shows up in the tools I already use, my team moves faster, aligns better, and makes higher-confidence calls. That’s exactly why Amplitude MCP caught my attention—and why it’s quickly becoming essential to my AI Strategy and day-to-day Product Management practice.
Discover how Amplitude MCP brings behavioral context to AI tools like Claude and Cursor, enabling data-driven decisions in your existing workflows.
In practice, this means I can ask Claude, Cursor, or even Claude Code about activation cohorts, retention analysis, funnel drop‑offs, and feature adoption—and get responses grounded in Amplitude analytics without tab-hopping. By bringing our unified analytics platform into the flow of work, I keep momentum high and decision latency low, especially during fast-moving discovery and delivery cycles.
This approach elevates LLMs for product managers from clever assistants to reliable copilots. During continuous discovery, I can interrogate segments, compare behaviors across personas, and pressure-test hypotheses in minutes. In product-led growth environments, that behavioral context turns prioritization into a repeatable, outcomes-first ritual rather than a debate fueled by anecdotes.
Equally important, MCP helps me protect the integrity of our metrics. With consistent definitions flowing into AI tools, I reduce shadow analysis, preserve governance, and support privacy-by-design. Stakeholders—from engineers to design to GTM—see the same truths, which improves trust and accelerates alignment across the organization.
Getting started is straightforward: connect your workspace, ensure your event taxonomy is clean, and align key properties with CRM integration so segments and journeys remain attributable. I also curate an AI product toolbox of prompts for common workflows—say, exploring A/B testing outcomes or checking the minimum detectable effect (MDE) before a new experiment—so the team can move quickly without reinventing the wheel.
The payoff is immediate: fewer context switches, faster iteration loops, and sharper decisions where they matter most—inside the tools we already rely on. If you’re charting your gen ai roadmap, consider how Amplitude MCP can infuse behavioral insight into every conversation and commit. For me, it’s a pragmatic step toward an intelligent, data-informed product practice that scales.
Inspired by this post on Amplitude – Best Practices.
I’ve spent enough time in the trenches of product management to know the hardest part isn’t collecting feedback—it’s separating signal from noise. When every channel is buzzing, the real question becomes: what should we build next, and why? That’s where Amplitude AI Feedback has changed how I work. It gives me a disciplined, data-informed way to turn messy qualitative input into clear, defensible roadmap decisions.
Learn how Amplitude AI Feedback leverages AI to transform massive volumes of customer feedback into actionable product insights.
In practice, this means I can synthesize input from support tickets, NPS responses, user interviews, sales notes, and reviews—then connect those insights to product behavior data from Amplitude analytics. The result isn’t just a list of requests; it’s a ranked problem set grounded in evidence, which makes product discovery and continuous discovery faster, clearer, and less biased.
A recent example: we were hearing recurring complaints about onboarding friction, but it wasn’t obvious which steps truly mattered. By pairing feedback themes with activation and retention signals, I could zero in on the first-session setup tasks that correlated with drop-off. That clarity guided product roadmapping and sprint planning decisions we could stand behind, and it accelerated user activation without bloating the backlog.
My workflow is straightforward: aggregate feedback, cluster themes, validate with behavioral metrics, and translate insight into outcomes. I look for patterns tied to user activation, retention analysis, and moments that drive product-led growth. When the evidence shows a request is both frequent and high-impact, it earns a place on the roadmap; when it’s loud but low-impact, it becomes a targeted experiment rather than a default commitment.
What I appreciate most is the confidence this brings to stakeholder conversations. Instead of debating opinions, we review the evidence: quantified themes, clear user stories, and measurable KPIs. That turns “Finally, Signal That Tells You What to Build” from a slogan into an operating principle, and it helps empowered product teams move faster with fewer reversals.
If you’re building your AI Strategy or exploring LLMs for product managers, this is one of the highest-leverage moves you can make: use a unified analytics platform to connect qualitative feedback with quantitative behavior. It sharpens prioritization, improves time-to-learning, and keeps the team focused on outcomes—not outputs.
Inspired by this post on Amplitude – Best Practices.
I build products at scale, and I write about how we make them successful. When I need a clear, evidence-based perspective on what actually drives outcomes, I turn to the Amplitude Blog. It’s a dependable source for sharpening my thinking on "digital analytics, product strategy, and product-led growth"—and it consistently helps me translate analytics into business impact.
What keeps me coming back is the way practical, well-structured guidance meets real-world constraints. Whether I’m refining our event taxonomy in Amplitude analytics, evaluating a unified analytics platform approach, or aligning stakeholders on the right success metrics, I find concrete patterns I can apply immediately. The content connects data literacy with product management leadership, the exact combination required to navigate complex roadmaps and high-stakes decisions.
Here’s how I apply these insights day to day. I anchor our experiments in A/B testing best practices and set a minimum detectable effect that matches our traffic realities. I guide teams to prioritize user activation and retention analysis over vanity metrics, and I frame plans with outcomes vs output OKRs so we stay focused on customer and business value. In parallel, I reinforce continuous discovery and product discovery habits—feeding learning back into product roadmapping and sprint planning without losing speed.
The payoff shows up in the details: better funnel instrumentation, cleaner cohorts, and faster hypothesis cycles that reduce rework. When we operationalize these ideas—tying activation to onboarding flows, clarifying value moments, and aligning cross-functional owners—we see measurable lifts without bloating scope. That’s the discipline I expect from a modern, product-led growth motion: rigorous analytics paired with empowered execution.
If you’re scaling a team or modernizing your analytics practice, make the Amplitude Blog part of your weekly ritual. Use it to pressure-test your strategy, level up experimentation, and build a shared language for data-informed decisions. The right "tips and examples" can save months of trial and error—and, more importantly, help you ship products that customers return to again and again.
Inspired by this post on Amplitude – Best Practices.
I’ve felt the drag of data bottlenecks firsthand—PMs waiting on a reporting queue, engineers guessing at success metrics, and stakeholders making decisions with partial context. The “Add Data to Cart” mindset changed the game for me: make high-quality data as easy to request, enrich, and consume as dropping an item into a shopping cart.
Learn how Ankorstore’s teams make autonomous decisions, leveraging enriched data from Amplitude to accelerate feature delivery and drive topline growth.
Here’s what resonates with me and how I apply it in practice. When teams get self-serve access to a unified analytics platform like Amplitude analytics, decision autonomy becomes the default. Product trios operate with clarity, discovery cycles tighten, and we ship with confidence because the evidence is visible to everyone, not buried in a backlog.
The foundation is a clean, shared event taxonomy. I prioritize naming conventions, consistent properties, and governance so we can enrich events once and reuse them across A/B testing, retention analysis, and user activation dashboards. This lets product managers answer critical questions—Who’s activating? Which cohorts retain? Which journeys convert?—without waiting on an analyst, while still preserving data quality.
In my teams, “Add Data to Cart” means we treat data like a product. If a feature team needs a new event or property, they can request it with clear definitions, privacy requirements, and owners. We standardize the instrumentation pattern, ship it through CI/CD, document the event, and surface it in curated Amplitude reports. The result is faster feature delivery and fewer ad-hoc asks.
The payoff shows up in everyday decisions. Product managers run A/B tests with a minimum detectable effect (MDE) they can justify, analysts focus on deeper insights instead of ad-hoc tickets, and engineers get immediate feedback loops post-release. It’s a blueprint for product-led growth: know what moves activation, double down on the paths that retain, and sunset the work that doesn’t move outcomes.
Governance matters as much as speed. I pair data governance with privacy-by-design so teams can move quickly without risking compliance or eroding trust. That means documented event definitions, role-based access, and well-labeled dashboards that steer people to the right sources of truth.
If you’re starting from scratch, begin small: instrument a single critical flow end to end, publish three core dashboards everyone can find, and hold weekly readouts where teams share what changed because of the data. Within a few sprints, the habit forms—questions get sharper, hypotheses improve, and the roadmap shifts from output to outcomes.
“Add Data to Cart” isn’t just a catchy phrase; it’s a practical way to empower product teams. With enriched data in Amplitude, autonomous decisions become the norm, discovery accelerates, and growth compounds because every iteration is informed by what customers actually do.
Inspired by this post on Amplitude – Best Practices.
Engagement starts with a single, repeatable moment: activation. Over the years, I’ve learned that when we obsess over activation, everything downstream—retention, expansion, and product-led growth—gets easier and more predictable. As I often remind my teams, "Discover how winning teams drive engagement by obsessing over activation. Learn to define, measure, and improve the moments that keep users coming back."
When I say activation, I mean the specific behavior that reliably predicts long-term value for a new user or account. In different products, the activation moment could be connecting a data source, inviting a teammate, sending the first campaign, or completing an initial automation. My first move is to define that moment precisely, set an activation threshold (for example, “within 7 days of signup”), and align the team around it as a primary outcome.
From there, I track three core metrics: activation rate (the percentage of new accounts that hit the activation threshold), time-to-activation (how quickly they get there), and early retention curves by cohort. Cohort-based retention analysis gives me the most honest read on whether our activation definition truly predicts stickiness or if we’re celebrating vanity milestones. Tools like Amplitude analytics and Pendo make it straightforward to instrument these events, segment users, and visualize the funnel from first touch to activation and beyond.
Instrumentation quality is non-negotiable. I map the activation journey into discrete events, add clear event properties (role, plan, channel, use case), and validate tracking end-to-end before I trust any dashboard. A strong unified analytics platform lets me slice activation by persona, acquisition source, and onboarding path, so we can see where friction lives and where momentum builds.
Improving activation is where design and data meet. I lean heavily on in-app guides, product tours, and contextual tooltips to reduce cognitive load at the exact moment a user needs help. We run A/B testing with a minimum detectable effect in mind, prioritize experiments that remove steps or shrink time-to-value, and iterate quickly based on user feedback gathered through continuous discovery. The goal is simple: shorten the distance from curiosity to value.
Onboarding is the frontline of activation. I favor progressive disclosure, crisp checklists tied to the activation moment, and “just-in-time” education rather than dumping documentation up front. Clear wayfinding—what to do next, why it matters, and how success is measured—pushes users toward that first “aha” moment with confidence.
Cross-functionally, I align activation to outcomes vs output OKRs so everyone—from product and design to marketing and customer success—pulls in the same direction. For example, lifecycle emails and in-app messaging should reinforce the same activation path that product guides inside the app. This harmony lowers friction, speeds time-to-activation, and compounds engagement.
As we scale, I keep a living experiment backlog focused on activation levers: simplifying setup, removing form fields, auto-detecting configurations, and pre-populating defaults. Each change gets measured against activation rate and time-to-activation, with guardrail metrics to protect quality and retention. Over multiple releases, these small wins stack into durable growth.
I’ve seen teams unlock double-digit improvements by treating activation as a product, not a project. When we define the right moment, instrument it well, and iteratively remove friction with data-informed design, engagement rises naturally—and sustainably. That’s the power of an activation-obsessed culture.
Inspired by this post on Amplitude – Best Practices.
I’ve spent the last year pressure-testing where marketing analytics is really headed, not just in slide decks but in the messy reality of product roadmaps, stakeholder management, and revenue targets. From my seat leading product teams and partnering closely with CMOs and growth leaders, I see 2026 as the year analytics stops being a rearview mirror and becomes a real-time operating system for growth.
Start 2026 off with a bang with exclusive insights and predictions from some of marketing analytics’ most influential voices. See what they have to say.
Prediction 1: The unified analytics platform becomes non-negotiable. Fragmented dashboards and manual spreadsheet reconciliation will give way to an integrated, privacy-by-design measurement layer that stitches product, marketing, and revenue data. Expect tighter CRM integration (think HubSpot), product analytics (Amplitude analytics, Pendo), and revenue systems in one source of truth. The practical upside: faster decision cycles, cleaner attribution, and a shared language for product-led growth.
Prediction 2: Gen ai and agentic AI move from novelty to necessity. Analysts and product managers will deploy AI Strategy playbooks that pair retrieval-first pipeline patterns with governance to answer open-ended questions and trigger actions safely. “Agent Analytics” will summarize trends, generate experiments, and draft stakeholder updates, while LLMs for product managers become standard tooling. The bar is explainability: every AI-assisted insight must show its lineage and assumptions.
Prediction 3: Experiments scale, rigor deepens. We’ll treat A/B testing as a system, not an event—standardizing guardrails like minimum detectable effect (MDE), pre-registration, and sequential testing where appropriate. As teams embrace continuous discovery, we’ll graduate from single-page tests to multi-surface learning agendas spanning pricing, onboarding, and lifecycle activation. The goal isn’t more tests; it’s faster time-to-learning with lower decision risk.
Prediction 4: Causality beats correlation in measurement. Last-click and naive attribution will yield to incrementality testing, holdouts, and lightweight MMM for channels that don’t click. Retention analysis gains prominence as the north star for sustainable growth, linking value proposition clarity to user activation and downstream LTV. Outcomes vs output OKRs will force teams to track what truly moves customer behavior.
Prediction 5: Activation loops go real-time. Unified analytics will trigger in-product nudges, product tours, and contextual in-app guides the moment a signal crosses a threshold. This closes the loop between insight and action, shrinking the distance from analysis to impact. Teams that instrument these loops well will win on speed and compounding effects.
Prediction 6: Governance becomes a growth enabler. Data governance and privacy-by-design aren’t just compliance—they’re a competitive advantage. Clear definitions, consent-aware pipelines, and transparent AI risk management will increase trust in insights, accelerate deployment, and reduce rework. When stakeholders trust the data, they make bolder, faster decisions.
Prediction 7: Go-to-market precision improves. With cleaner signal and shared context, we’ll price with confidence (SaaS pricing and, in many cases, consumption SaaS pricing), sharpen product positioning, and focus spend where incrementality is provable. Expect fewer vanity metrics, more revenue-linked scorecards, and tighter integration between product roadmapping and sprint planning and growth experiments.
What to do now: 1) Audit your stack for a unified analytics platform and eliminate redundant tools. 2) Invest in first-party instrumentation and CRM integration to future-proof measurement. 3) Operationalize experimentation: document MDE, power, and decision rules. 4) Deploy gen ai responsibly with clear governance and retrieval-first context. 5) Build activation loops that turn insights into targeted in-app actions. Teams that execute on these fundamentals in 2025 will set the pace in 2026.
Inspired by this post on Amplitude – Best Practices.
I love when a bold platform bet translates into tangible product impact. Watching a team commit to a unified analytics platform and then operationalize it across the business is a master class in strategic focus and change management. That’s exactly what this story captures—and why it resonates with my own experience leading complex analytics migrations.
Learn how Dan Grainger led Haven's migration to Amplitude, focusing on user-friendly analytics and data governance for non-technical teams.
That single sentence distills what matters most: if analytics aren’t accessible to non-technical teams, you won’t get the adoption needed to drive outcomes. “User-friendly analytics” isn’t window dressing; it’s the linchpin for empowered product teams and true product-led growth. When teams can ask and answer their own questions—without waiting on analysts—velocity and quality of decision-making improve immediately.
From a product management lens, two elements stand out. First, the choice of Amplitude analytics as the central system of insight—consolidating scattered tools into a unified analytics platform—creates one source of truth for activation, adoption, and retention analysis. Second, a rigorous approach to data governance ensures that trust in the data scales alongside usage, especially for non-technical stakeholders who need clarity, not caveats.
Execution matters. In my playbook, these transformations succeed when you treat them as product initiatives, not IT projects. I partner early with stakeholder management champions, form product trios to define the measurement plan, and use in-app guides, product tours, and targeted onboarding to drive behavior change. The goal is simple: shorten time-to-insight for frontline teams while keeping the instrumentation robust and consistent.
Data governance is the quiet force multiplier. Clear tracking plans, consistent event taxonomies, role-based access, and privacy-by-design guardrails prevent entropy. When everyone speaks the same analytics language, you avoid “metric du jour” debates and keep the focus on outcomes vs output OKRs. That’s where scalable impact comes from.
Measurement closes the loop. I’ve found that when non-technical teams can self-serve retention analysis, funnel drop-off, and user activation patterns, they start running continuous discovery by default—asking better questions, testing smarter hypotheses, and accelerating learning cycles. Amplitude’s strength is not just visualizing what happened, but making it easy to connect behavior to outcomes teams care about.
The broader leadership lesson is straightforward: choose a platform that your broadest set of contributors can and will use daily, invest early in governance, and build enablement into your rollout plan. That’s how a migration becomes a multiplier. When the right platform meets the right operating model, the win is less about a tool and more about a learning culture that compounding value over time.
If your analytics stack feels fragmented or underused, this is your nudge. Align on a unified analytics platform, meet teams where they are with user-friendly analytics, and let governance do the heavy lifting behind the scenes. The payoff—in speed, alignment, and smarter bets—comes faster than most teams expect.
Inspired by this post on Amplitude – Best Practices.
I’m stepping into 2026 with a practical playbook for marketing analytics—one forged at the intersection of product management, go-to-market strategy, and AI Strategy. My lens is simple: connect data to decisions, decisions to outcomes, and outcomes to revenue. If you’re serious about product-led growth, this is the year to turn your unified analytics platform into a true competitive advantage.
Start 2026 off with a bang with exclusive insights and predictions from some of marketing analytics’ most influential voices. See what they have to say.
The biggest shift I expect is from channel-centric dashboards to journey-centric systems that stitch together product usage, CRM integration, and campaign performance. When Amplitude analytics or Pendo data sits alongside HubSpot pipeline metrics, we stop arguing about attribution models and start instrumenting the full revenue motion. That’s how marketing, product, and sales align around one truth: activation, engagement, and expansion drive sustainable growth.
I’m betting on deeper adoption of A/B testing with a rigorous minimum detectable effect (MDE) discipline and cohort-led retention analysis. Vanity metrics won’t cut it. Teams that operationalize outcomes vs output OKRs and tie experiments to LTV, CAC, and payback will outperform. The win is not more tests—it’s better tests that translate into compounding user activation and retention.
Gen AI will supercharge analysis, but not replace analytical thinking. I see LLMs for product managers accelerating root-cause analysis, surfacing anomalies, and explaining drivers behind conversion shifts. The craft moves from “pulling reports” to “asking higher-quality questions,” then validating with sound statistical methods. The highest-leverage teams will pair gen ai with strong taxonomies, clean event schemas, and clear definitions of North Star metrics.
Data governance becomes a growth enabler, not a compliance cost. With privacy-by-design, consented data, and well-documented schemas, your models become more accurate and your campaigns more resilient. When governance is strong, personalization sharpens, lookalike models improve, and executive confidence in the numbers rises—unlocking faster, bolder bets.
Product-led growth analytics will mature from “feature usage” to “value moments.” I’m focusing my teams on measuring time-to-value, depth-of-use, and expansion signals embedded in in-app guides, product tours, and contextual tooltips. The companies that make value visible earlier—and measure it precisely—will see outsized improvements in trial-to-paid and expansion.
Operationally, I expect tighter cadences between discovery and delivery. Product trios will partner with marketing to run continuous discovery on messaging, onboarding friction, and pricing signals. When insights flow directly into campaign creative and in-product experiments, learning cycles compress and the cost of delay drops.
If you’re building your 2026 roadmap, here’s my short list: consolidate tools into a unified analytics platform, standardize event taxonomies across web, product, and CRM, formalize MDE for every A/B test, and align OKRs to activation and retention milestones. Do this, and you’ll turn fragmented data into a durable growth engine—one that compounds every quarter.
Inspired by this post on Amplitude – Perspectives.
Customer expectations have never been higher. People expect fast, accurate, and effortless support, every time—and across industries, from ecommerce to financial services to healthcare, customer experience has become one of the most strategic levers for achieving durable competitive advantage.
Here’s the challenge I’ve seen again and again: you can’t improve what you can’t see. For years, most support organizations have been making decisions based on only a tiny slice of their customer interactions, captured through surveys that reach only the most motivated (or frustrated) voices. In my own program reviews, the most revealing insights often hid in the conversations that never made it into CSAT or NPS.
We created CX Score to change that. CX Score gives teams a complete view of the customer experience across every meaningful conversation—no CSAT or NPS surveys required. I wanted a signal that reflected reality, not just a vocal minority.
After launching CX Score, we saw many teams immediately use it to understand performance trends, highlight experience issues, and surface gaps across support operations. That early momentum validated the approach and showed us where to go deeper.
As adoption grew, new opportunities emerged. CX leaders found value from CX Score—but they also wanted the model to capture more nuance and identify the specific drivers leading to negative or positive scores, giving them clearer direction on where to focus. I heard the same ask from my own leadership peers: make it explainable and actionable.
That’s what we’ve built into the latest iteration of CX Score. If you’ve been using CX Score for a while and have noticed it shift recently, that’s an expected evolution. A recent shift in scores does not mean your support quality has dipped or that Fin or your team is performing worse than before—this one-time shift reflects a more advanced, more complete model that understands customer experience more deeply with even greater coverage.
Why CX Score needed to evolve
In the initial release, CX Score evaluated each conversation using a combination of sentiment, resolution, and support quality signals. It provided strong early insight and surfaced experience trends that were previously invisible. But as we analyzed real-world conversations across thousands of companies, it became clear that even these combined signals didn’t fully capture the nuance of how customers actually experience support—especially in moments where the outcome was technically correct, but the path to get there involved unnecessary friction, repeated explanations, or unresolved product limitations.
This evolution of CX Score builds on that foundation. It incorporates deeper contextual understanding of the entire interaction, creating a more complete and accurate reflection of the customer experience. As a product leader, that depth matters because it turns a lagging metric into a coaching and prioritization system.
How CX Score has evolved: deeper, more actionable insights
We expanded the CX Score evaluation criteria. CX Score now looks beyond just how your team replied, and into the broader context of the customer’s experience—including reasons that may be outside your support team’s direct control but still influence how your customers feel.
Alongside core support quality signals, we’ve introduced several new dimensions that capture what customers are actually reacting to:
Answer quality (Fin): How well Fin answered the customer’s queries—were responses clear, accurate, and able to resolve the issue without contradiction or repeated clarification?
Answer quality (Teammate): How well a human teammate answered the customer’s queries, using the same criteria: clarity, accuracy, and resolution without contradiction or repeated clarification.
Customer effort: How much effort the customer had to put in to get help (e.g. repeating themselves, multiple handovers, chasing follow-ups).
Strong emotion: Whether the customer expressed strong positive or negative emotions (e.g. joy, gratitude, frustration, anger).
The new CX Score adds context to every conversation: a donut chart surfaces drivers like policy feedback and effort, while a side panel explains why this interaction earned a 3 based on signals from an AI agent chat.
Product/Service feedback: Whether the customer praised or criticized the product (e.g. features, bugs, design gaps, etc.) or the service (e.g. delivery, reliability, onboarding, performance, etc.).
Policy feedback: Whether the customer praised or criticized a company policy (e.g. refunds, returns, account rules, limits, eligibility, etc.).
Broader coverage: more of your support volume now contributes to CX Score
Previously, some conversations couldn’t be scored reliably, especially short, simple, or low-context exchanges—which meant your CX Score was based on only a subset of your total support volume. With this update, CX Score now uses a wider set of criteria to evaluate each interaction. The result: more conversations qualify for scoring, fewer gaps in coverage, and a CX Score that reflects your true support mix—not just the longest or most detailed threads.
Greater transparency with richer, more informative summaries
We’ve made it much clearer why each conversation received the score it did. Right inside the product, every scored conversation now surfaces the specific reasons that influenced its rating—things like high customer effort, strong negative emotion, or product feedback. This added visibility makes it much easier to understand what’s driving your CX Scores, build trust in how they’re calculated, and confidently use them in reporting, coaching, and decision-making.
On top of that, conversation summaries now weave these reasons together with context from the customer’s original query. Instead of scanning the full thread, you can quickly see what happened (the core issue and how it was handled) and why it was scored that way (the key signals that impacted the rating). In my workflow, this shift lets me move from reading transcripts to taking action much more quickly.
From visibility to taking action
As customer experience becomes one of the clearest ways businesses can differentiate, teams need more than visibility—they need clarity on where to invest their time and how to improve. With deeper context and clearer reasoning behind every score, CX leaders can quickly identify what’s working, what needs fixing, and what to prioritize. CX Score moves from being a measurement tool to a system for continuous improvement.
What this unlocks for CX teams: Automatically flag conversations for review. Route threads with high customer effort, strong negative emotion, or low answer quality to QA, team leads, or specialists. Auto-forward product feedback to the right teams. Send conversations with product or policy criticism directly to Product, Engineering, or Ops channels, with no manual triage required. Spot operational issues such as handoff loops, unclear answers, or inconsistent workflows. Share transparent, explainable insights directly with leadership.
The future of CX measurement
CX Score isn’t just another metric. It’s becoming a new standard. Some customers have already chosen to replace CSAT entirely, using CX Score as their primary measure of experience quality because of the broader coverage, deeper context, and clearer paths to action it offers. This reflects a broader shift across the industry: as new competitors emerge and product differentiation narrows, customer experience is becoming one of the most strategic ways to stand out; measuring it accurately and understanding it deeply is now essential.
Our focus going forward is to help teams diagnose issues faster, prioritize with confidence, and improve at scale. This is the foundation we’ll continue to build on: turning every conversation into insight, and every insight into action.
The new CX Score is rolling out gradually to all customers and will be in your workspace by December 3rd.
Want to see CX Score in your workspace? Get started →
I’ve learned the hard way that the fastest, lowest-risk growth lever is hiding in plain sight: reactivating the users we already earned. When our team prioritized win-back programs over new acquisition, we unlocked higher net revenue retention, shorter payback periods, and stronger product-market signal—with a fraction of the spend.
"Discover why reactivating dormant users delivers better ROI than new acquisition. Learn how to identify and bring back at-risk users via targeted campaigns." That insight matches what I see daily: win-back campaigns compound value because they capitalize on existing familiarity, prior data, and stored intent.
Here’s the ROI logic I use. New acquisition burns budget on education and trust-building before value is realized. Reactivation, by contrast, taps into latent demand and prior setup, which means lower effective CAC, faster time-to-value, and higher LTV recapture. In retention analysis, these programs often outperform prospecting by a wide margin because the user already knows how to get value—they just need a relevant nudge.
To find the right users to re-engage, I start with leading indicators of risk: declines in weekly active use, feature decay (e.g., key workflows not triggered), shrinking session depth, and unresolved outcomes. Amplitude analytics or a unified analytics platform help me segment cohorts by recency, frequency, and monetary signals, then rank accounts by churn propensity. I also track intent proxies like billing pauses, reduced seat utilization, and cooling support contact.
I group users into three practical tiers: “at-risk” (recent value decay), “dormant” (no critical events in the past 30–60 days), and “churned-eligible” (post-cancel window with a viable path back). Each tier gets a distinct message strategy, incentive structure, and time horizon. The goal is to match the intervention to the activation friction each group faces.
For creative strategy, I anchor on the outcome they originally hired us to deliver. I lead with the value proposition they care about, not the features. A strong win-back narrative reminds users of the job-to-be-done, showcases what’s improved since they last engaged (new capabilities, performance, integrations), and offers an effortless next step—often a guided “return-to-value” flow or a one-click way to pick up where they left off.
Channel orchestration matters. I use Intercom and Pendo to deliver contextual nudges, in-app guides, and lightweight product tours that meet users at the precise moment and screen of friction. With CRM integration, we coordinate email and SMS for timely follow-ups, then reinforce success in-product with progressive tooltips and checklists. The best-performing sequences pair a personalized message, a sharp call-to-outcome, and a low-friction path back to activation.
Experimentation is non-negotiable. I run A/B testing on subject lines, offers, and in-product prompts, and size tests with a minimum detectable effect (MDE) that’s realistic for each segment. We personalize content by prior feature use, industry, and plan tier to avoid generic blasts that underperform. Over time, the library of proven treatments compounds, and the system becomes predictively better at catching risk earlier.
Measurement should be unambiguous. I define “reactivation” as the return to a qualifying level of usage that mirrors healthy customers (e.g., core event completion in a set window), not just a login. I track reactivation rate, time-to-reactivation, reactivated revenue, payback, and LTV uplift versus holdout cohorts. Cohort views in Amplitude analytics reveal whether improvements are persistent, and whether we’re driving true behavior change or short-term spikes.
Trust is part of the strategy. We build privacy-by-design into all outreach and respect user preferences. Clear value exchange (why this message, why now, how to opt out) consistently improves response rates and strengthens long-term relationships—win-backs should feel helpful, not harassing.
Operationally, I pair product-led growth with lifecycle marketing: product teams ship the “return-to-value” experiences; growth teams run the orchestration; customer success brings context from the field; and analytics sets guardrails and success criteria. When executed as a system, win-backs turn from occasional campaigns into a durable, compounding growth engine.
If you’re chasing growth in a tight market, start here. Your next quarter’s ARR may be sitting in dormant cohorts that are one relevant nudge—one fast path to value—away from coming back.
Inspired by this post on Amplitude – Best Practices.
I build products with equal parts intuition and instrumentation. When a campaign’s purpose is to spark a feeling, I still demand proof that those moments translate into measurable outcomes. Learn how you can use Amplitude to better track your vibe marketing initiatives in part 2 of our 3-part series.
Vibe marketing works when emotion and evidence move in lockstep. In my practice, I rely on Amplitude analytics as a unified analytics platform to connect the emotional resonance of a message to product-led growth—tracking how a compelling story influences user activation, retention, and revenue. The goal is simple: feel something, measure everything.
I start by instrumenting the journey around the vibe itself. That means a clean event taxonomy and consistent properties that capture the creative theme, channel, audience segment, and context (for example: campaign_id, creative_theme, entry_channel, audience_mood, landing_variant). Good data governance is non-negotiable—if the data isn’t trustworthy, neither are the insights. With this foundation, I can attribute emotional narratives to downstream behaviors with confidence.
From there, I map the funnel and define activation with intent. I track how vibe-forward touchpoints influence key milestones—first value moments, time-to-activation, and early feature engagement—then ladder those signals into retention analysis. Cohorting users by creative theme or channel helps me see which vibes convert initial curiosity into durable product habits, and which only produce short-lived spikes.
Experimentation is where the rigor shows. I use A/B testing to isolate the impact of a specific narrative, headline, or creative treatment, and I size tests based on minimum detectable effect (MDE) to avoid underpowered decisions. Guardrail metrics (activation, retention, and NPS) protect the experience while I iterate. When the numbers are tight, I supplement with directional reads—session quality, content depth, and return visits—while staying honest about causality.
Operationally, my team lives in shared Amplitude dashboards and notebooks. We annotate launches, align on outcomes vs output OKRs, and review weekly trendlines with our GTM partners. This cadence keeps empowered product teams focused on what matters: which vibes accelerate onboarding, deepen engagement, and ultimately improve unit economics. When a story resonates, the data should echo it across the funnel.
The biggest pitfalls I see are vanity metrics and disconnected systems. To avoid them, I link campaign data to product behavior, unify identifiers across tools, and ensure CRM integration so we can follow the customer journey end-to-end. The payoff is clarity: I can tell a creative team exactly which narrative unlocked user activation and which one stalled—then iterate with speed and precision.
Vibe marketing isn’t soft; it’s strategic. When we respect the craft of emotion and the discipline of measurement, we build experiences that people love and businesses depend on. If you’re ready to upgrade how you track the intangibles, Amplitude gives you the instrumentation to turn feelings into forward motion.
Inspired by this post on Amplitude – Best Practices.