You may know how to prompt a model and still feel unprepared to own an AI product. That gap is real. Producing a plausible response is easy; deciding what should be built, how to evaluate it, when to trust it, and whether it improved the user journey requires a broader product skill set.
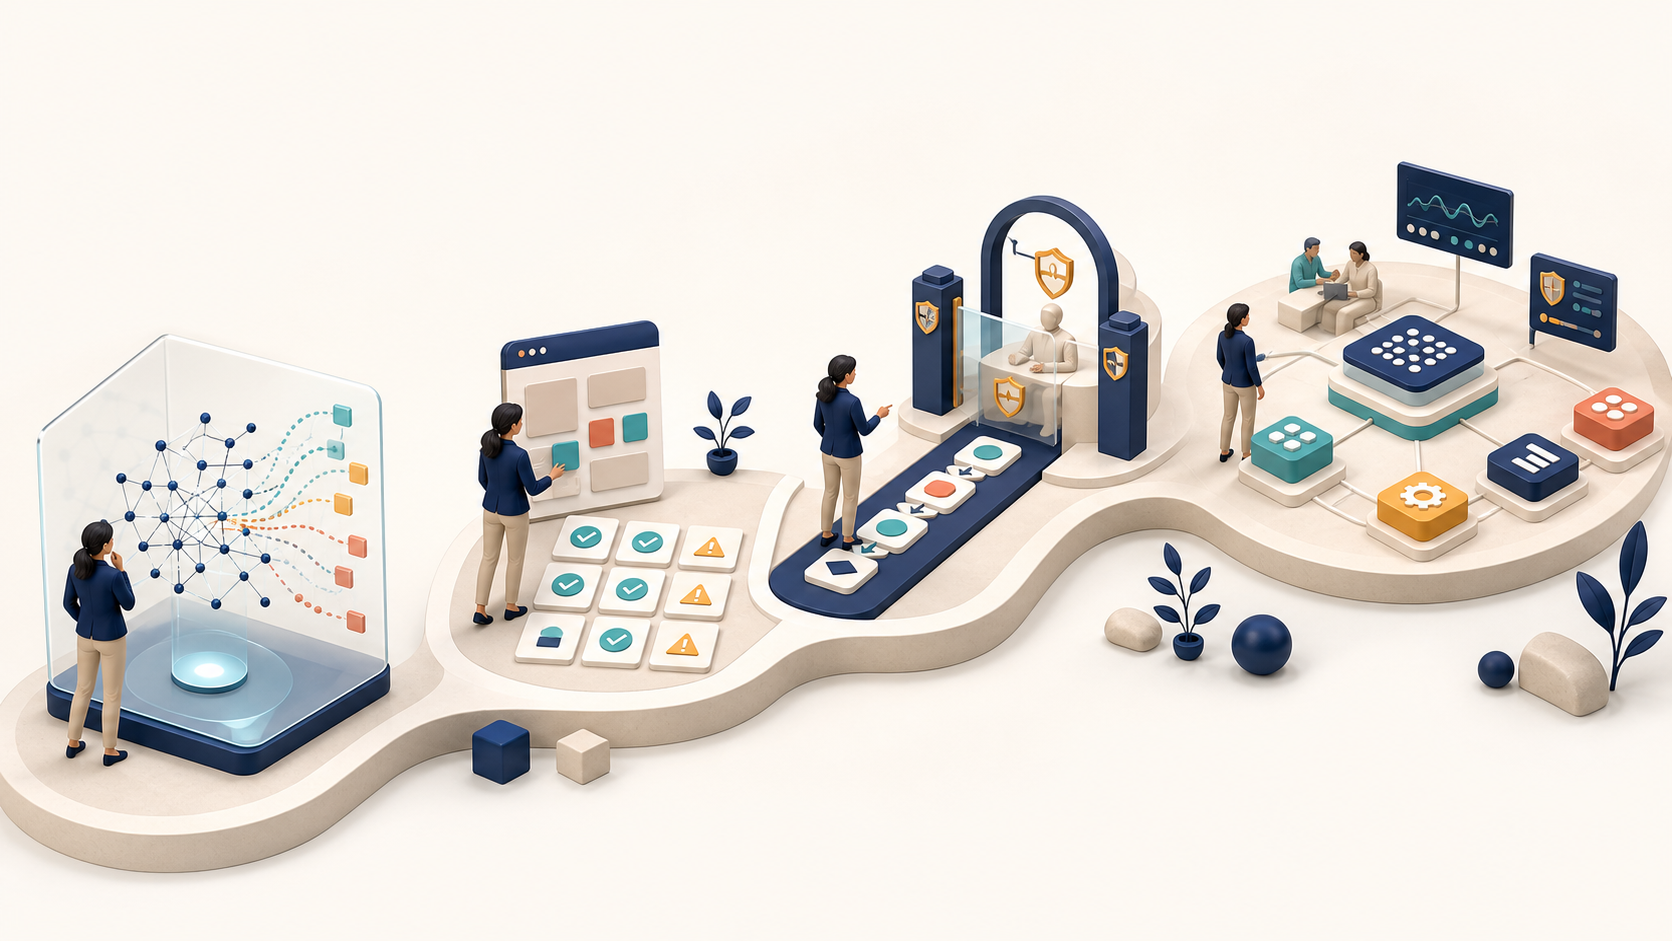
The useful roadmap is not a queue of courses or tools. It is a sequence of increasingly consequential work: understand model behavior, turn ideas into testable artifacts, ship a bounded workflow, and then build the operating system that lets more teams do it responsibly.
What you should be able to do after 12 months
An AI product manager does not need to become a machine-learning engineer. You do need enough technical judgment to frame a feasible problem, challenge an architecture, inspect failures, define an evaluation, and make a release decision with engineering and design.
The 12-month progression from foundations to governed scale works because each phase produces evidence needed by the next one. You learn model constraints before promising a user experience. You build evaluations before exposing the system to real customers. You prove one workflow before standardizing it across a product organization.
Key takeaways
- Months 1-3: Learn model behavior, context management, prompting, retrieval, privacy, and data governance. Apply them to product discovery.
- Months 4-6: Build prototypes and an evaluation system. Instrument activation and retention before treating the feature as ready.
- Months 7-9: Ship a bounded AI-enabled workflow with safeguards, monitoring, recovery paths, and clear human control.
- Months 10-12: Standardize evaluation gates, analytics, discovery practices, roadmapping, and outcome-based reporting.
Treat these as capability gates, not calendar milestones. If you cannot explain why a prototype failed in month six, more production infrastructure will not fix the problem. If you cannot show that users received value in month nine, scaling the feature will only distribute uncertainty.
By the end of the roadmap, your portfolio should contain operating artifacts rather than course certificates: an AI product brief, a prompt and retrieval pattern, a reusable evaluation set, an instrumented production workflow, a risk checklist, and a scale playbook. Those artifacts demonstrate that you can move from possibility to accountable product performance.
Months 1-3: Learn enough AI to make sound product decisions
Your first objective is not technical fluency for its own sake. It is learning where model behavior changes a familiar product decision. A deterministic feature is expected to return the same result for the same state. A generative feature can produce different, incomplete, or confidently incorrect outputs. That changes acceptance criteria, testing, interface design, and the meaning of “done.”
Build an operator’s mental model
Work through four capabilities in order:
- Model behavior and constraints: Learn what the model receives, what it produces, where variability enters, and which failures matter to the user. You should be able to distinguish a capability problem from a context, instruction, or workflow problem.
- Context window management: Decide which information belongs in the model’s working context, which information is stale, and which information should never be sent. More context is not automatically better context. Irrelevant material can obscure the evidence the task actually requires.
- Prompting as product specification: Write reusable instructions that state the task, relevant context, constraints, required output, and quality criteria. Save the prompt with examples of both acceptable and unacceptable behavior. A prompt library is useful only when another person can reproduce and assess the result.
- Retrieval-first design: For tasks that depend on changing or proprietary knowledge, learn the basic pipeline: retrieve relevant approved information, give that information to the model, generate an answer, and preserve enough traceability to investigate failures. This is a product choice as much as an architecture choice because it determines what the experience can reliably know.
Pair these capabilities with privacy-by-design and data governance from the beginning. Before using customer or company information, write down which data classes are permitted, who can access them, where they may be retained, and what must be removed or masked. If those answers are unclear, use synthetic or explicitly approved material until the policy is settled. Avoiding sensitive data at the prototype stage is safer than trying to remove it after it has spread through prompts, logs, and evaluation files.
Apply the foundations to product discovery
Discovery gives you a low-risk place to practise. Use generative AI to summarize research, cluster feedback, compare recurring needs, or sharpen a value proposition. Keep the model in an assistive role: every synthesized theme should remain traceable to the underlying customer evidence. If you cannot inspect the feedback behind a cluster, you cannot tell whether the model found a pattern or flattened important differences.
Create an AI product brief for one candidate problem. Include:
- The user and the job they are trying to complete.
- The decision or work the model will assist with.
- The inputs the system may use and the inputs it must reject.
- The expected output and the conditions that make it useful.
- The consequence of a wrong, missing, or delayed output.
- The point at which a person reviews, edits, approves, or overrides the result.
- The product signal that would show improved user behavior.
You are ready for the next phase when you can explain the proposed experience without hiding behind model vocabulary. You should be able to identify the necessary context, name the important failure modes, explain whether retrieval is needed, and show how the user remains in control.
Months 4-6: Prototype the experience and build its evaluation system
A prototype is valuable when it tests uncertainty, not when it merely looks polished. Use generative AI to accelerate UX mocks, PRDs, in-app guidance, and alternative interaction flows, but spend the saved time on the questions that determine whether the product deserves to ship.
Prototype the entire decision loop. Show where the user supplies context, how the result is presented, what happens when the answer is weak, how the user corrects it, and whether that correction improves the next step. The error state is part of the primary AI experience; hiding it until engineering integration creates false confidence.
Use evaluation as a development method
Eval-driven development turns a vague judgment such as “the answers seem good” into a repeatable product decision. Build the evaluation alongside the prototype:
- Define the task boundary. State what the system is expected to do and what remains outside its responsibility.
- Collect representative cases. Include normal inputs, ambiguous inputs, missing information, adversarial behavior, and cases where the correct response is to stop or ask for clarification.
- Write a scoring rubric. Assess the properties the user actually needs, such as correctness, relevance, completeness, appropriate tone, traceability, or compliance with a constraint.
- Record a baseline. Compare the proposed experience with the current workflow or a simpler non-AI alternative. A model output is not valuable merely because it exists.
- Inspect failure patterns. Separate prompt failures, missing-context failures, retrieval failures, model limitations, interface confusion, and policy violations. Each category points to a different remedy.
- Set a release gate. Decide which failures block launch, which require human review, and which are tolerable in the intended use case. The gate should reflect the consequence of error, not enthusiasm for the feature.
Keep the evaluation set versioned with the product. When you change the prompt, model, retrieval logic, or available tools, rerun the same cases. Otherwise, an apparent improvement in one example can conceal regressions elsewhere.
Instrument behavior before launch
Quality evaluation and product analytics answer different questions. An evaluation tells you whether the system behaved acceptably on known cases. Behavioral analytics tells you whether customers reached value in the product.
Define the journey in Amplitude or your existing analytics system before exposing the prototype broadly. Capture the moment a user encounters the feature, supplies enough information, receives an output, accepts or edits it, completes the downstream task, returns to use it again, abandons it, or escalates to a person. That sequence gives you activation and retention signals rather than a vanity count of generations.
If you run an A/B test, choose the minimum detectable effect before launch. The decision matters because an experiment that cannot detect a product-relevant change may produce an inconclusive result even when the dashboard looks busy. Define the primary outcome, guardrail metrics, exposure rule, and analysis plan before looking at the results.
Move forward when the prototype solves a defined task, the evaluation catches meaningful failures, the events expose the user journey, and the experiment can answer a decision. A persuasive demo without those four elements is still a demo.
Months 7-9: Ship a bounded workflow, not an open-ended assistant
The production phase is where product judgment becomes visible. Start with a workflow that has a recognizable beginning, end, and owner. Customer-support, CRM, and guided-onboarding workflows are useful patterns because the AI can sit inside an existing user journey rather than asking customers to invent a use case from a blank chat box.
Screen the workflow before committing engineering capacity:
- Is the user’s job clear enough to define a successful completion?
- Does the system have access to approved, relevant context?
- Can you observe whether the user accepted, corrected, ignored, or escalated the output?
- What happens to the customer if the system is wrong?
- Can a consequential action be paused, reviewed, or reversed?
- Is a generative system materially better than a rule, search result, template, or conventional workflow?
Use agentic AI only when the job genuinely requires several connected steps, tool use, or changing plans. Additional autonomy also creates more places for permissions, context, and actions to go wrong. Begin with the narrowest useful boundary, then expand it when production evidence supports the change.
Map the production loop before building it
A product trio should be able to trace the complete workflow on one page:
- Trigger: What user action or system event begins the workflow?
- Context: Which profile, conversation, account, or knowledge records are retrieved?
- Generation or decision: What does the model produce, classify, recommend, or plan?
- Tool action: Which systems can it read from or write to, and under whose authority?
- Human checkpoint: Which output can be edited, rejected, or approved before it changes customer data or sends an external message?
- Recovery: How does the product handle low confidence, missing data, tool failure, timeouts, or a user correction?
- Learning signal: Which feedback updates the evaluation set, product decision, or workflow design?
Place safeguards at the point of consequence. Restrict the data and tools the workflow can access. Require explicit approval before a high-impact external action. Preserve a record of the inputs, retrieved context, output, action, and user response so a failure can be investigated. If an action cannot be safely reversed, keep it behind human review until the risk has been addressed.
Threat detection and response also need a product playbook. Define what counts as suspicious input or abnormal behavior, who receives the alert, how the workflow is disabled or contained, what evidence is retained, and how affected users are handled. The escalation path should exist before the first serious incident, not be improvised during it.
Monitor the experience at four levels
- User outcome: Did the customer complete the intended job with less effort or fewer avoidable handoffs?
- AI quality: Are the evaluation scores and failure categories changing after releases?
- Workflow health: Are retrieval, model, and tool steps completing as expected, and can the team locate the failing stage?
- Risk: Are users overriding outputs, escalating cases, encountering policy violations, or triggering suspicious behavior?
Track deployment frequency because a team that can release safely can also learn faster. Do not confuse release frequency with customer value, though. The useful loop connects a deployment to a quality change, a behavior change, and a decision about what to do next.
Months 10-12: Turn one successful product into a repeatable system
Scaling is not copying the same AI feature into every surface. It is making the successful practices reusable while preserving room for different user risks and workflow requirements.
Codify the operating assets that reduced uncertainty during the earlier phases:
- An intake template that starts with the user problem, current workflow, expected outcome, and consequence of error.
- A continuous-discovery practice that keeps generated themes connected to original customer evidence.
- A retrieval-first architecture template for products that depend on approved or changing knowledge.
- A shared prompt library with owners, versions, expected behavior, and known limitations.
- An evaluation gate covering representative cases, blocking failures, human-review requirements, and regression checks.
- A production checklist covering permissions, privacy, observability, recovery, threat response, and user control.
- A monitoring cadence that connects product behavior, AI quality, workflow health, and risk.
Do not impose one universal quality threshold on every AI feature. A low-consequence drafting aid and a workflow that changes a customer account do not carry the same downside. Use the same evaluation process across teams, but set release gates according to the task, affected user, reversibility, and consequence of failure.
Use common analytics without erasing product context
A unified analytics model lets leadership compare lift across products without forcing every team to use an identical funnel. Standardize the basic meanings of exposure, meaningful use, successful task completion, correction, abandonment, escalation, and return usage. Then let each product define the events that represent those states in its own journey.
This is also where roadmapping and sprint planning should move from output commitments to outcome-based decisions. “Ship an AI assistant” is an output. A useful objective describes the customer behavior or business result that should change. The roadmap can then contain competing ways to produce that change, including improvements that do not require AI.
Use a consistent stakeholder narrative:
- What shipped: The workflow or capability placed in users’ hands.
- What moved: The user, product, quality, and risk signals that changed.
- What was learned: The assumptions confirmed, rejected, or still unresolved.
- What happens next: The decision to expand, revise, contain, or stop the work.
That structure prevents activity from masquerading as progress. It also gives executives a clear basis for funding decisions: evidence of value, evidence of control, and a specific next bet.
Start this week with one recurring user decision. Write its AI product brief, run the workflow manually with permitted data, and save the successful and failed cases as the beginning of an evaluation set. If you cannot define a good result or the consequence of a bad one, stay in discovery. If you can, you have a concrete first artifact and a reason to proceed to a prototype.