I spend a meaningful portion of my week helping teams operationalize AI workflows, and one theme comes up over and over: how to share context files and skills seamlessly across devices and with colleagues. Hosting Claude Code office hours has only reinforced it—sharing context and skills is the single biggest blocker to reliable, repeatable outcomes.
I hear from leaders driving AI adoption who have built robust, high-signal context systems and carefully crafted skills. Their challenge isn’t creating value—it’s distributing it. They need a way to make the same trusted workflows available to teammates and to keep everything in sync across laptops, desktops, and phones.
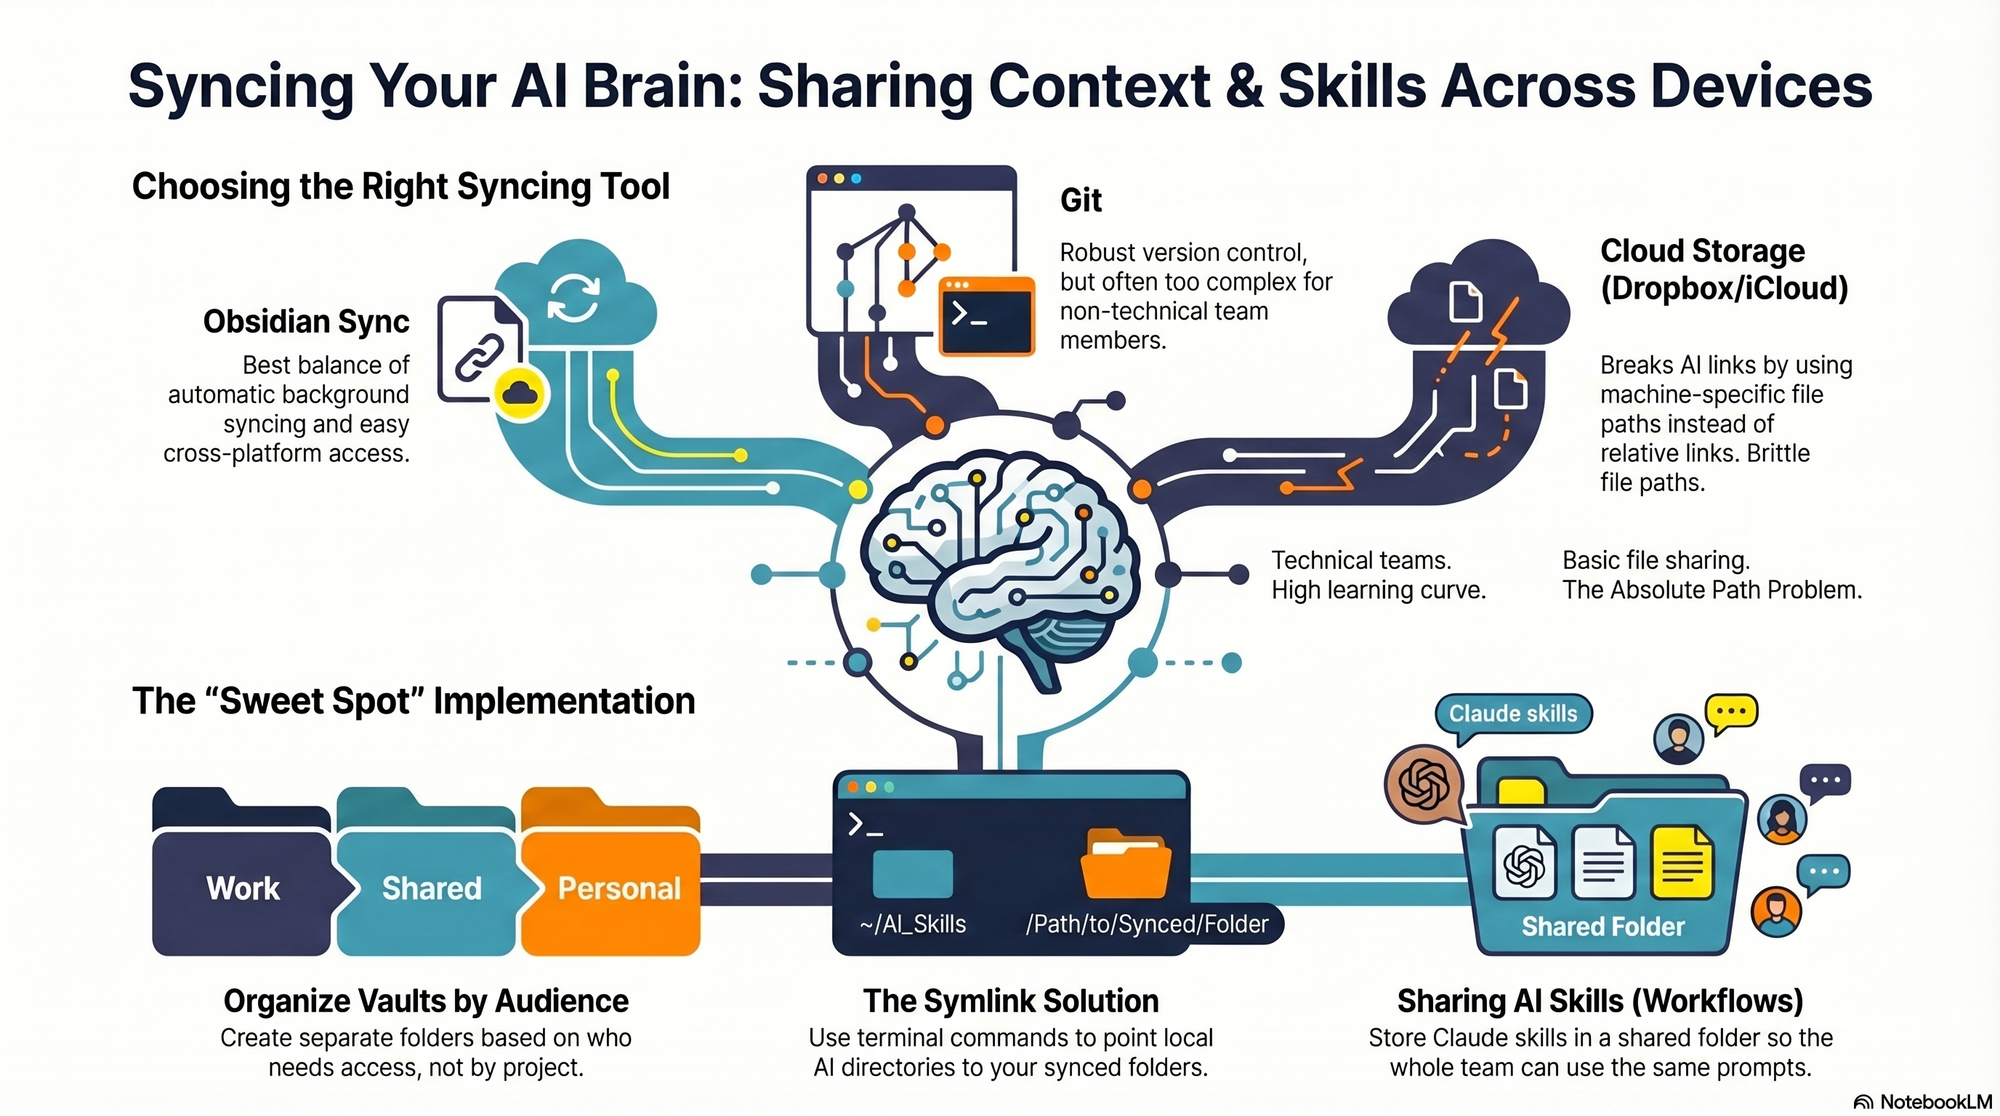
I hit the same wall myself. I work across multiple devices (a Mac Mini for day-to-day, a MacBook Air on the road, and an iPhone) and I collaborate with a full-time admin. I wanted my context and skills to be consistent everywhere, for both of us. In this piece, I’ll share my setup—what I store where, how I share it across devices and with my team, the trade-offs of each option, and how I keep everything current. We’ll cover four different syncing services: git/GitHub, Obsidian Sync, Dropbox and iCloud.
If you’re new to this series, this is the eighth installment. Earlier pieces provide foundational context: Claude Code: What It Is, How It's Different, and Why Non-Technical People Should Use It; Stop Repeating Yourself: Give Claude Code a Memory; How to Use Claude Code Safely: A Non-Technical Guide to Managing Risk; How to Choose Which Tasks to Automate with AI (+50 Real Examples); How to Build AI Workflows with Claude Code (Even If You're Not Technical); How to Use Claude Code: A Guide to Slash Commands, Agents, Skills, and Plug-ins; and Context Rot: Why AI Gets Worse the Longer You Chat (And How to Fix It).
The day it really hit me was right before my interview with Claire Vo on How I AI. I was staying in an AirBnB with only my laptop, and I planned to demo my /today command along with my context file structure. Minutes before the session, I realized the latest version of my /today command wasn’t on that machine. I was able to remote into my Mac Mini and grab it—crisis averted—but it was a wake-up call. I needed a more reliable, shareable approach for syncing context and skills across devices and with my admin.
I started by testing the tools I already used—Dropbox, iCloud, and GitHub—to see what might fit. Each got me partway there, but each also introduced friction that mattered in daily use.
First, absolute file paths don’t travel well. I began with Dropbox but quickly ran into cross-linking headaches. Good context systems rely on rich interlinking—index files point to other context files, and those context files link to each other. When Claude creates a link from one context file to another, it tends to use the full file path: /Users/ttorres/Library/CloudStorage/Dropbox. That worked on my Mac Mini and MacBook (same user name), but not on my phone—and not for my admin. I tried to force relative links (~/Dropbox), but couldn’t get Claude to do it consistently, which led to broken links. This isn’t unique to Dropbox; Claude prefers full paths because they’re reliable on a single machine, but they’re brittle across devices and useless when sharing with colleagues. Claude is trained to use relative file paths when working within a git repository, but I struggled to get it to work reliably in Dropbox.
Second, skills live in a user directory by default. By default, skills live in ~/.claude/skills. Most sync services aren’t designed to share your ~/ folder. iCloud is the exception, but then you’re limited to Apple devices—no Windows or Android. There is a workaround: set up a claude folder in Dropbox and create a symlink from ~/.claude to your synced claude folder, so all skills, commands, and settings live in Dropbox. Then, on each device (yours or a colleague’s), you set up a symlink to that folder so Claude can find the files. This works, but I was running into another limitation that made Dropbox a poor fit.
Third, Obsidian on iOS doesn’t sync cleanly with Dropbox. I rely on Obsidian’s file browser alongside my notes to navigate context quickly. Storing vaults in Dropbox gave me parity across my Mac Mini and MacBook Air, but I couldn’t get the iOS Obsidian app to reliably load my Dropbox vaults. That friction was a dealbreaker for on-the-go work.
At that point, I explored git/GitHub. GitHub is cloud storage for git repositories. A git repository is a folder of shared files used so engineers can collaborate on the same code base. Each person clones a local copy, works locally, then pushes changes back to the hosted repo on GitHub; others pull to update. Git’s merge and conflict tooling is excellent. Git is the powerhouse of file syncing and version control. It easily handles syncing context and skills, Claude behaves better with relative links in a git repo, and I can open the repo in my IDE with a clean file browser. For me, that checked all the boxes—until I factored in my admin. Git has a learning curve, requires manual pull/push hygiene, and often assumes an IDE workflow. That overhead was too heavy for a non-technical collaborator.
The turning point was Obsidian Sync. A colleague suggested it, and it ended up being the sweet spot. Obsidian is a markdown reader; files are stored locally in a normal folder you can open in Finder or File Explorer. There’s no proprietary format—you can read files with any text editor, and Claude can access them via bash commands. Obsidian Sync is simpler than git: open a note and it syncs in the background. I can access the same vaults across my Mac Mini, MacBook Air, and iPhone, and I can share a vault with my admin so we can both create and access notes.
Because we’re in different time zones and rarely edit the same note simultaneously, limited conflict handling hasn’t been an issue. Obsidian’s internal link notation also means one note can link to another and those links just work across devices. Claude can follow these links, so the brittle file path problem disappears.
Here’s where I landed. After a lot of trial and error, I have a setup that works across my devices and for my admin, who uses both a Windows desktop and a Mac laptop. I keep my core context in Obsidian vaults synced with Obsidian Sync, which preserves portability, link integrity, and ease of use. For skills, I avoid scattering files in machine-specific locations and instead centralize what Claude needs to reference in shared, human-readable folders. If you require advanced version control with branching and reviews, git/GitHub is excellent. If your priority is low-friction, cross-device access for non-technical teammates, Obsidian Sync is a practical, reliable choice. And if you must use Dropbox or iCloud, consider symlinks and be vigilant about relative paths—just know that absolute paths won’t travel well.
Lately, I keep hearing a familiar question: with AI making it so easy to generate ideas and build products, do we still need product managers? My answer is unequivocal—yes. Tools accelerate delivery, but they don’t build trust, reconcile competing incentives, or create the shared understanding teams need to ship outcomes. Product work is relationship work.
I recently listened to “Product Work Is Relationship Work – All Things Product with Teresa & Petra,” and it echoed what I see every day in high-performing product organizations. If you prefer to watch, here’s the episode on YouTube: https://www.youtube.com/embed/d-0f8uAfc8w?feature=oembed
Listen to this episode on: Spotify | Apple Podcasts
While AI can help build things faster, it can’t replace the relationship work required to align stakeholders, navigate competing priorities, and create shared understanding across teams. That’s the hard, human part of product management—and it’s not going away.
In my experience, product teams stall when collaboration becomes transactional. We jump to negotiation (“What can you commit by Friday?”) before establishing context (“What problem are we solving and why now?”). When I slow down to get curious—about constraints, incentives, and assumptions—momentum actually increases because we’re rowing in the same direction.
Stakeholder alignment often breaks down when we conflate advocacy with exploration. We argue our viewpoint as if it were the only lens that matters, rather than making space to surface how others see the system. I’ve found the distinction between “dialogue vs. discussion,” rooted in work by Chris Argyris and elaborated in The Fifth Discipline by Peter Senge, to be a powerful reset. Dialogue builds shared understanding; discussion decides. You need both, in the right order.
Language matters in the room. The improv principle “Yes, and” is deceptively simple but transformative. When a designer, engineer, or executive feels heard (“Yes”) and we build on their idea (“and”), we create psychological safety without sacrificing critical thinking. I use “Yes, and” to explore perspectives before we converge on decisions—especially with product trios and senior stakeholders.
Here are the moves I rely on to keep collaboration relational and outcomes-focused. First, we align on outcomes before solutions. I explicitly separate outcomes vs output OKRs so we’re clear on what success looks like, independent of the features we ship. That clarity reduces rework and speeds up decision-making later.
Second, we operationalize curiosity with continuous discovery. I schedule recurring, lightweight touchpoints with customers and internal stakeholders so insights compound. When learning is continuous, debates quiet down—evidence does the heavy lifting.
Third, we invest in relationship rituals. Regular 1:1s with key partners, stakeholder maps that capture motivations, and pre-reads that frame trade-offs all prevent misalignment from surfacing in the last mile. These small habits pay huge dividends in trust and speed.
Fourth, I’m explicit about mode-switching in meetings: are we advocating a position or exploring perspectives? Calling the mode out loud prevents people from mistaking questions for opposition and keeps the conversation productive.
Fifth, we use “Yes, and” to move from possibility to practicality. We explore generously, then converge rigorously—ranking options by impact, effort, and risk so decisions are transparent and fair.
If stakeholder alignment, team dynamics, or product “politics” slow your team down, this conversation offers a practical reframe. You’ll move faster when you build the relational tissue first—because alignment is an accelerant, not a tax.
Resources & Links:
Follow Teresa Torres: https://ProductTalk.org
Follow Petra Wille: https://Petra-Wille.com
Mentioned in this episode:
Petra’s Coaching Packages
Work by Chris Argyris on organizational learning and dialogue vs. discussion
The Fifth Discipline: The Art and Practice of the Learning Organization by Peter Senge
Improv principle “Yes, and”: Saying “Yes, and” — A principle for improv, business & life and Yes, and …
Have thoughts on this episode or examples from your team? Leave a comment below—I’d love to learn what’s working (and what’s not) in your stakeholder landscape.
You have customer interviews, support tickets, sales objections, funnel dashboards, and a backlog full of requests. Yet activation is still stalled, retention remains uneven, and every team has a different explanation for why.
The problem is rarely a shortage of feedback. It is the absence of a reliable path from customer evidence to a self-serve product experience. You need an insight system that identifies the real obstacle, proves that it matters to the right segment, and scales the solution without making every customer depend on a call, a CSM, or a custom implementation.
Start with the growth outcome, not the feedback inbox
A customer insight is not a quote, a feature request, or a chart. It is an evidence-backed explanation of why a defined group of customers is or is not reaching an outcome.
That distinction matters in product-led growth. A request can be sincere and still point toward the wrong solution. A funnel can reveal a drop-off and still tell you nothing about the customer’s intent. An insight connects the customer’s job, observed behavior, friction, and business consequence closely enough to support a decision.
Begin with the outcome you need to understand:
Activation: Are new customers completing the behavior that represents first value?
Adoption: Are activated customers using enough of the core workflow to make the product part of their routine?
Retention: Are the right customers continuing to receive value after the novelty and onboarding assistance disappear?
Expansion: Is deeper usage creating a credible path to more seats, more workflows, or additional capability?
Build a driver tree beneath that outcome. If activation is the target, its branches might include setup completion, successful data connection, first completed workflow, and collaboration. If expansion is the target, the branches might include activation depth, feature breadth, additional users, and new use cases. The tree gives customer evidence a destination. An observation that cannot be tied to a growth outcome or one of its drivers may still be interesting, but it is not ready to shape the roadmap.
Define each metric before gathering evidence around it. Product teams often use terms such as activation, onboarding, and first value as if they were interchangeable. They are not. A dependable metric catalog specifies the formula, behavioral event, cohort, time window, exclusions, owner, and lineage. Without that contract, two teams can analyze the same customer journey and reach incompatible conclusions because they silently measured different things.
Capture each candidate insight in a standard record:
The target segment and use case.
The job the customer is trying to complete.
The expected growth outcome and driver-tree branch.
The observed behavior, including where the journey changes or stops.
The customer’s stated friction, goal, or workaround.
The consequence for time-to-value, adoption, retention, or expansion.
The evidence supporting the interpretation and the evidence still missing.
The next decision the insight is meant to inform.
Keep observation, interpretation, and decision separate. “Customers abandon setup after reaching permissions” is an observation. “They do not trust the permission model” is an interpretation. “Redesign the permissions screen” is a decision. Combining all three in one sentence makes an assumption look like evidence.
Move insights through three levels of leverage
Product-led growth does not require you to avoid high-touch customer work. It requires you to learn from that work without making high-touch intervention the permanent delivery model.
I use three levels to manage that transition: close customer diagnosis, repeatable internal operations, and customer-facing product. Each level answers a different question.
Diagnose the problem in context. Work closely enough with a customer to see the entire job: the intended outcome, existing process, product configuration, behavior path, workaround, and point of failure. The objective is learning, not merely satisfying the account’s request.
Turn the diagnosis into a repeatable internal workflow. Standardize the inputs, analysis, output, and recommended action so customer success, sales, or support can apply the learning to other relevant accounts. This stage tests whether the insight travels beyond the original customer.
Promote the proven pattern into the product. Give customers the diagnosis, recommendation, or improved workflow directly. The product must work reliably across its intended audience without a specialist interpreting every result.
The first version can be deliberately manual. One customer automation analysis took more than half a day to prepare and visualize. It predicted a 70% automation rate for that customer, which the customer then achieved. A single match does not prove that the method generalizes, but the manual work exposed a useful taxonomy and a measurable hypothesis. That taxonomy could then be operationalized across more customers before becoming customer-facing.
The lesson is not that every manual analysis deserves automation. Manual work is a discovery instrument. It lets you identify the variables, edge cases, and next actions before engineering a permanent system around them.
Use a promotion gate before moving an insight from one level to the next:
Problem repeatability: The same underlying job and obstacle appear across the intended segment, even if customers describe them differently.
Diagnostic stability: Different people can use the same inputs and reach a consistent interpretation.
Action repeatability: The recommended intervention helps customers take a recognizable next step rather than producing an interesting report.
Outcome visibility: You can observe whether the customer completed the behavior the intervention was meant to change.
Bounded exceptions: You understand where the method fails, which configurations require special handling, and when a human must intervene.
Product leverage: Self-service delivery creates enough customer value to justify product complexity, maintenance, and support.
Stopping at the internal-workflow level can be the correct decision. If an analysis is valuable only for a narrow set of complex accounts and still requires expert judgment, forcing it into a universal feature can make the product harder to understand. Productization is earned through generalization; it is not the automatic reward for discovering a customer problem.
Combine customer language, behavior, and commercial impact
No single signal can carry a product decision. Interviews reveal goals and reasoning but not prevalence. Behavioral data reveals sequences and drop-offs but not intent. Support and sales conversations expose recurring friction but overrepresent customers who chose to speak. Revenue data shows consequence but rarely identifies the mechanism.
Signal
What it can tell you
What it cannot establish alone
Customer interview or workflow observation
The job, desired outcome, constraints, vocabulary, and workaround
How common the problem is or whether a proposed change will alter behavior
Product behavior
Where users stop, repeat actions, take alternate paths, or differ by cohort
Why the behavior occurred or what outcome the user expected
Support, success, and sales conversations
Recurring confusion, implementation blockers, objections, and unmet expectations
The rate among all customers exposed to the same experience
Commercial outcomes
Which segments expand, contract, renew, or leave
Which product mechanism caused the result
Experiment or staged intervention
Whether a defined change moves a specified behavior for the eligible cohort
Why every customer responded as they did or whether the effect will persist indefinitely
Triangulation means linking these signals at the level of a segment and use case, not dropping them into one large feedback pile. Segment retention and adoption by plan, customer size, and use case. Then compare customers who reached the target outcome with customers who encountered the suspected obstacle.
A practical investigation sequence looks like this:
Define the eligible cohort using the metric contract.
Locate the behavioral inflection: the step, sequence, or period where successful and unsuccessful journeys diverge.
Inspect the surrounding support conversations, implementation notes, and known configuration differences.
Talk with customers from both sides of the divergence. Ask them to reconstruct what they were trying to do, what they expected, and what they did next.
Write the narrowest explanation consistent with the evidence, including plausible alternatives.
Specify the behavior that should change if the explanation is correct.
For example, suppose customers complete a technical connection but do not proceed to the collaborative part of a workflow. The evidence does not yet justify “build better team invitations.” Customers may not understand the next step, may not need collaborators for that use case, may lack permission to invite them, or may not have received enough value to involve colleagues. Each explanation implies a different solution and a different test.
This is also where AI-assisted analysis either becomes valuable or produces confident noise. An agent can help retrieve related conversations, run a defined funnel, compare cohorts, and assemble prior experiment results. It cannot compensate for contradictory activation definitions or an event taxonomy that nobody owns. A retrieval-first system grounded in canonical metrics, event definitions, cohort logic, dashboards, and versioned analysis gives the agent something stable to reason from.
Preserve provenance. Every generated synthesis should retain links to the customer evidence, metric definition, query, and decision record behind it. Apply the same permissions and PII controls used for the underlying systems. Faster synthesis is useful only when a product manager or analyst can inspect how the conclusion was formed.
Prioritize customer problems by leverage, not request volume
The loudest request is not necessarily the largest opportunity. Enterprise accounts generate detailed feedback because they have access to account teams. New self-serve users often leave silently. A raw count therefore measures how feedback entered the company as much as it measures customer need.
Frequency without a denominator is especially misleading. “This appeared in many tickets” is weaker than “this appears among customers who attempted this workflow.” Always compare the affected group with the population exposed to the same experience, then keep the result segmented by use case and customer type.
Before assigning a score, run each opportunity through six questions:
Outcome: Which activation, adoption, retention, or expansion driver does this problem obstruct?
Segment: Does it affect the customers and use cases the product is designed to serve?
Evidence: Do customer language and observed behavior support the same explanation?
Consequence: Does the friction delay value, block a core job, increase dependency on assistance, or precede contraction?
Leverage: Can a reusable product change solve the problem without recreating a custom service for every account?
Testability: Can you define the eligible cohort, expected behavior change, observation window, guardrail, and decision rule before shipping?
If an opportunity fails the outcome or evidence question, investigate it rather than prioritizing it. If it fails the leverage question, consider an internal tool, implementation playbook, or targeted service. If it fails testability, improve the instrumentation before making a broad release.
Write the opportunity without embedding the preferred feature:
For [segment] trying to [complete a job], [observable friction] prevents or delays [customer outcome]. This appears in [customer evidence] and [behavioral or commercial evidence]. If the explanation is correct, changing [part of the experience] should move [leading behavior] while preserving [guardrail].
That statement gives design and engineering room to find the smallest appropriate intervention. The answer may be clearer positioning, contextual education, a better default, a repaired workflow, a new capability, or a human-assisted path for exceptional cases.
Do not use in-app guidance to wallpaper over a missing capability. Guides, tours, and contextual tooltips can make the next value-producing action clearer when the product already supports the customer’s job. They cannot make an irrelevant or broken workflow valuable.
Define success before implementation. Name the primary behavior, eligible cohort, measurement window, and guardrails. If you run an A/B test, establish the minimum detectable effect and decision criteria in advance. If the eligible population cannot support a reliable experiment, use a staged release and cohort evidence, but do not describe an observational difference as causal proof.
Make customer learning part of the operating cadence
A strong insight repository can still become a graveyard if it is separated from planning and growth reviews. Put customer learning into the cadence where trade-offs are made.
Use a weekly driver-tree review for operating decisions. Review movement in the relevant outcome by segment, newly triangulated insight records, active tests, and results from prior interventions. Every item should leave the meeting in a named state: gather evidence, test a hypothesis, operationalize internally, productize, monitor, or stop. Record the owner, missing evidence, next action, and reason for the decision.
Keep strategic and execution cadences distinct. QBRs are useful for examining value realized, retention risks, and expansion paths with customers. OKRs translate the resulting priorities into owned cross-functional work. The weekly review manages learning and experiments between those larger checkpoints. This prevents a quarterly customer conversation from becoming an isolated presentation with no route into product execution.
Assign clear responsibilities:
Product owns the problem framing, decision record, and promotion between levels of leverage.
Research and design protect the customer’s context, job, language, and workflow.
Data protects metric validity, cohort logic, instrumentation, and the distinction between correlation and causation.
Customer success, support, and sales contribute evidence with account and use-case context rather than forwarding unqualified requests.
Engineering identifies technical constraints, edge cases, observability needs, and the ongoing cost of operating the solution.
Close the loop in three places. Tell participating customers what was learned or changed without promising that every request will ship. Tell internal teams why the opportunity advanced or stopped. Feed the result back into the insight system so future decisions can retrieve the hypothesis, intervention, and observed outcome.
If AI helps operate that system, evaluate it as a product rather than trusting plausible prose. Useful quality dimensions include faithfulness to metric definitions, numerical accuracy, latency, and actionability. Log accepted answers, material edits, and overrides. Those signals reveal where retrieval, taxonomy, permissions, or evaluation cases need improvement.
Key takeaways
Anchor customer evidence to a defined growth outcome and driver tree before discussing solutions.
Treat feature requests as entry points for investigation, not as validated insights.
Combine customer language with behavioral and commercial evidence at the segment and use-case level.
Move learning from close diagnosis to a repeatable internal workflow before making it a universal product feature.
Prioritize problems that are consequential, repeatable, measurable, and suitable for self-service delivery.
Use a weekly decision cadence so each insight advances, gathers evidence, or stops.
At your next growth review, choose one stalled outcome and trace it to one customer segment, one behavioral inflection, and the conversations surrounding that moment. Write the insight record before proposing a feature. Then decide whether the next move is deeper diagnosis, an internal workflow, or a product experiment.
That small discipline changes the purpose of customer feedback. It stops being material for a backlog and becomes a system for helping more customers reach value on their own.
I set out to solve a deceptively simple problem: help our teams ask product questions in plain English and get trustworthy, analysis-grade answers—fast. That required more than a powerful model; it demanded agents that genuinely understand the language of product analytics, from behavioral analytics nuances to the messy reality of event taxonomies, funnels, and cohorts. In this post, I share how we engineered agentic AI that speaks our domain fluently and turns questions into decisions.
The core challenge wasn’t data volume or dashboard sprawl; it was semantics. Different teams said “activation,” “onboarding,” or “first value” and meant overlapping but distinct things. Our PMs, analysts, and engineers navigated a maze of synonyms across Amplitude analytics, Pendo, and our unified analytics platform. Generic LLMs stumbled on these nuances, so we built a shared ontology—driver trees anchored to a clear North Star—with canonical definitions for activation, retention, and conversion, plus consistent event naming and cohort logic.
We started with a rigorous metric catalog: every KPI linked to its drivers, exact formulas, cohorts, and time windows; every event mapped to a product taxonomy; every dashboard and SQL snippet versioned with ownership and lineage. That catalog became the ground truth for agents. We embedded data governance and privacy-by-design from the start—permissioning for fields and queries, PII redaction, and scoped access that reflected how product teams actually work.
Next, we built a retrieval-first pipeline to ground the agents in our corpus before generation. We indexed metric definitions, dashboards, experiment readouts, runbooks, and high-signal Slack threads so the agent could cite relevant artifacts, not just predict plausible text. With careful context window management and prompt engineering, the agent retrieves definitions and prior analyses, then plans multi-step actions: run a query, compare cohorts, check “minimum detectable effect (MDE)” for an A/B test, and summarize findings with references.
Architecturally, we treated this as “Agent Analytics”: an orchestrator that selects tools based on intent—querying Amplitude analytics or Pendo for behavioral paths and funnels, hitting our warehouse for cohort tables, or pulling experiment metadata and anomaly detection alerts. Tool use is permission-aware, auditable, and designed to fail safe. The agent’s outputs include citations back to the exact definitions, dashboards, and SQL used, so reviewers can validate and iterate.
Quality came from eval-driven development, not intuition. We built a gold set of representative product questions (activation inflections, retention analysis by segment, funnel drop-offs after feature launches) and scored the agent on faithfulness to definitions, numerical accuracy, latency, and actionability. We incorporated regression checks to catch drifts after schema changes, and we tuned prompts to reduce overconfident answers and push for clarifying questions when context was missing.
Safety and reliability were non-negotiable. We layered AI risk management with role-based access, guardrails that block destructive queries, and risk scoring for unfamiliar joins or sudden spikes in metric deltas. The agent logs every step—what it retrieved, which tools it called, and why—so analysts can replay and refine the chain of thought with transparent provenance.
The payoff: product teams now self-serve nuanced questions in minutes instead of days, and our analysts spend more time on discovery than report wrangling. Retention analysis improved as the agent standardized cohort logic; conversion investigations accelerated thanks to consistent funnel definitions; and cross-functional decisions aligned around the same driver trees and shared language. Most importantly, the agent turned ambiguous asks into structured analyses that stand up to scrutiny.
For fellow product leaders, my lesson is simple: start with semantics, not models. A crisp ontology, disciplined taxonomy, and clear ownership will outperform a flashy stack riddled with ambiguity. Avoid technology FOMO; favor retrieval-first grounding, small sharp tools, and continuous discovery with your product trios. When your organization speaks a common analytics language, agents can finally think with you, not just for you.
Next, we’re extending the agent’s planning skills to recommend experiment designs, estimate power and “minimum detectable effect (MDE),” and propose driver-tree-informed bet sizing. We’re also tightening feedback loops so every accepted answer, edit, or override strengthens the retrieval corpus and evaluations. The vision: a calm, reliable layer that makes rigorous product analytics feel conversational—and helps teams move from questions to confident action.
Inspired by this post on Amplitude – Best Practices.
Internal Products Are Hard; Commercial Products Are Harder. That line captures years of hard-won lessons from leading both internal platforms and market-facing SaaS at HighLevel. I’ve seen how the two demand different muscles—even when the tech stack, talent, and timelines look the same on paper.
When I talk about internal products, I mean services and solutions that our own employees use to take care of customers—customer-enabling tools and services, agent consoles, fulfillment and billing workflows, operations dashboards, and the underlying platforms that keep them fast, compliant, and resilient. These tools don’t generate revenue directly, but they quietly determine customer experience, gross margin, and how quickly we can ship, resolve issues, and scale.
Commercial products, by contrast, add a second challenge layer. Beyond discovery, usability, and reliability, we must conquer positioning, pricing and packaging, competitive differentiation, sales enablement, procurement hurdles, and ongoing customer success motion. The surface area for failure is bigger, and the time-to-signal on product-market fit is slower and noisier.
Here’s how I decide where to invest. First, I anchor on outcomes, not output. If the business priority is net revenue retention, faster onboarding, or reduced cost-to-serve, internal products often provide the highest-leverage path. If the priority is new revenue, new market entry, or a must-have differentiator, we lean commercial. I make the trade explicit in outcomes vs output OKRs so we can defend the decision when pressure mounts.
Second, I run a clear build vs buy calculus. For internal needs, the default is buy if a mature, configurable solution exists that meets our security, data governance, and integration requirements. I only build when the workflow is core to our differentiation, the TCO of customization is lower than vendor sprawl, or we can capture unique proprietary advantage. For commercial products, I avoid embedding third-party IP in a way that caps differentiation or compresses margins as we scale.
Third, I insist on continuous discovery. Internal audiences are not a captive market—they’re discerning experts with real jobs to do. I treat them like customers, with structured customer interviews, journey mapping, and opportunity solution trees. I rely on empowered product teams and product trios to validate problems and reduce solution risk before we commit engineering time.
Fourth, I frame commercial vs internal work with capacity guardrails. In most planning cycles, I reserve explicit allocation for platform scalability and internal tooling, separate from feature bets. Without this, internal products become backlog filler, which guarantees we’ll pay the interest later in churn, SLA breaches, and slower delivery.
Execution differs too. For internal products, change management is the make-or-break. I plan enablement as a first-class deliverable: clear rollouts, in-app guides, training, and feedback loops with frontline champions. I track adoption, time-to-resolution, error rate, and satisfaction for internal users with the same rigor we apply to external users.
For commercial products, I design the discovery-to-GTM handshake early. Pricing and packaging must reflect value drivers discovered in research, not what’s easiest to meter. Sales and solutions engineering need crisp narratives, objection handling, and proof points. Customer success needs activation plans and health signals tied directly to leading indicators of retention.
Across both, I instrument the product and process. I lean on feature flags and progressive delivery to manage risk, and I protect SLOs with error budgets so teams balance reliability with iteration speed. CI/CD isn’t a badge—it’s how we earn the right to ship continuously without eroding trust.
Common pitfalls recur. Teams skip UX for employee tools because “they have to use it”—which backfires as shadow workflows and rework. Leaders underfund internal platforms, then wonder why velocity stalls. On the commercial side, teams over-index on features and under-invest in positioning and onboarding, leading to poor activation and elongated sales cycles.
What’s the payoff? When we treat internal products as products, we unlock scale: shorter handling times, fewer escalations, clearer accountability, and higher customer satisfaction. When we approach commercial products with the same discovery rigor plus smart GTM, we compress time-to-value and amplify differentiation. The craft is knowing which lever to pull when—and having the discipline to measure what matters.
My rule of thumb is simple. If the goal is operational excellence that compounds across the entire customer journey, invest in internal products with the same intensity you reserve for revenue-generating features. If the goal is market expansion or category leadership, invest in commercial products with a tight discovery-to-GTM loop. In either case, clarity of outcomes, disciplined discovery, and empowered teams win the day.
Every planning cycle, I feel the drumbeat: “Show me the AI ROI—this quarter.” The pressure is real, especially when boards and CFOs expect immediate payback. Yet when I review stalled initiatives across teams and peers, the pattern is consistent: most companies treat AI like a feature to ship, not a system to manage. That mindset almost guarantees we measure the wrong things, declare victory (or failure) too early, and miss the durable value AI can create.
Here’s the core problem I see: we leap to solution and skip the counterfactual. Without a baseline, a clear control, or a defined “what would have happened otherwise,” we’re guessing. We also fixate on lagging, financial KPIs that move slowly (revenue, cost, risk), then use outputs—not outcomes—as OKRs. If we don’t align on outcomes vs output OKRs upfront, the best team in the world can still optimize for activity over impact.
My AI Strategy starts from a simple truth: value shows up along three vectors—revenue, cost, and risk—on different timelines. In the near term, we must validate leading indicators (adoption, engagement, activation) that ladder to those vectors through a transparent driver tree. Over time, those drivers compound into the lagging KPIs finance cares about. When we make the driver tree explicit, everyone can see how model precision, response time, and workflow integration roll up to conversion lift, case deflection, time-to-resolution, or reduced exposure.
To make this rigorous, I run a five-step playbook. First, define the decision and business outcome in plain terms. Second, instrument the baseline with behavioral analytics on a unified analytics platform—tools like Amplitude analytics or Pendo help expose friction points we’ll later target. Third, create a counterfactual using A/B testing and specify a minimum detectable effect (MDE) so we know how long to run and how much traffic we need. Fourth, quantify costs (training, inference, integration, change management) and include AI risk management, privacy-by-design, and data governance up front. Fifth, lock a measurement plan that connects leading indicators to lagging ROI through the driver tree.
Most AI initiatives don’t fail on model quality—they fail on adoption. If the workflow isn’t smoother, trust isn’t earned, or value isn’t obvious, users revert. That’s why I invest early in onboarding, in-app guides, product tours, and thoughtful tooltip design to reduce the time-to-first-value. Then I watch user activation, retention analysis, and task completion to ensure the assistive experience is not just novel—it’s habit-forming.
For generative use cases, eval-driven development is non-negotiable. I maintain offline evaluations for accuracy and safety, and online evaluations for business impact. Retrieval-first pipeline health, context window management, and prompt engineering affect reliability; so do latency and grounding quality. We ship behind feature flags, measure guardrail effectiveness, and tighten feedback loops from human-in-the-loop reviews into model updates—continuously.
On the business side, I avoid “AI theater” by structuring benefits like a CFO. Revenue: increased conversion or expansion driven by better recommendations, faster sales cycles, or higher trial activation. Cost: case deflection, agent time saved, fewer escalations, and lower rework. Risk: reduced exposure via automated checks, anomaly detection, and consistent policy application. If any claim can’t be tied to measured deltas—via A/B testing or strong quasi-experiments—it doesn’t go in the deck.
Build vs buy deserves the same discipline. I map platform scalability, governance requirements, and total cost of ownership against time-to-impact. Teams often underestimate integration and maintenance drag; a pragmatic mix of bought components with thin custom layers can accelerate outcomes while keeping options open. The goal isn’t to own every layer—it’s to own the learning loop and the differentiated experience.
I also remind teams that tooling should serve the strategy, not replace it. I’ve seen concise, effective messaging that captures the point: “Increase revenue, cut costs, and reduce risk with Pendo’s Software Experience Management platform. Optimize the entire software experience to drive adoption and improve engagement.” The words are compelling because they reflect the three-vector value model and the adoption imperative. The same standard should apply to any AI initiative we propose.
If you’re under pressure to prove ROI, shift the conversation: lead with the driver tree, specify your counterfactual, and anchor on leading indicators you can move in weeks—not quarters. Then connect those to the lagging KPIs finance expects over time. When we manage AI like a product—grounded in evidence, experimentation, and user-centered adoption—we don’t have to force ROI. We compound it.
Product roadmaps should not be promises etched in stone; they are portfolios of bets made under uncertainty. When I build a roadmap, I’m not predicting the future—I’m designing a system that helps the team learn faster than the market changes, allocate capital wisely, and create alignment across engineering, design, go-to-market, and leadership.
The best roadmaps I’ve seen and shipped anchor on outcomes rather than features. “Outcomes vs output OKRs” is more than a slogan; it’s how we translate strategy into measurable impact. I start by defining a small set of outcome metrics that matter—such as activation rate, time-to-first-value, or expansion revenue—and attach clear key results and guardrails to each theme. This reframes prioritization from “what can we build?” to “what must change in customer behavior?” and gives empowered product teams real autonomy.
I organize the roadmap into time horizons—Now, Next, Later—with explicit confidence levels. Near-term items have higher confidence and more specificity; mid- and long-term bets are thematic with wider time windows. This approach reduces false precision and builds trust because stakeholders can see both the intent and the uncertainty. When dates matter, I use windows and service level expectations rather than single deadlines, and I pair each initiative with a lightweight risk scoring so we can discuss uncertainty explicitly rather than implicitly.
Continuous discovery keeps the roadmap honest. I partner in tight “product trios” across product, design, and engineering to run rapid customer interviews, opportunity sizing, and assumption tests before we commit significant delivery capacity. The opportunity solution tree is my favorite artifact here; it visualizes the path from outcomes to opportunities to experiments and solutions, making trade-offs and sequencing transparent. By the time something moves into sprint planning, we’ve already reduced key uncertainties and clarified the narrowest viable slice we can ship.
Uncertainty demands options. I plan initiatives as options with stage gates and explicit kill criteria rather than as single monolithic projects. For every significant theme, I outline base, best, and worst-case scenarios with pre-decided triggers for when we escalate, pivot, or stop. This practice prevents sunk-cost fallacy and keeps the team focused on evidence. We treat scope as a knob, not a switch, and we bias toward small, sequential bets that compound learning.
Capacity is strategy. I routinely reserve a discovery buffer—typically 10–20%—and a contingency buffer for integration, security, and performance risks that always show up late. I ruthlessly control work-in-progress to limit thrash and protect the team’s ability to respond when new information arrives. When we must navigate dependencies, I use thin vertical slices and decouple via contracts or feature flags so discovery momentum doesn’t stall while platforms evolve underneath.
Prioritization under uncertainty benefits from explicit models. I combine value, effort, and confidence with risk scoring to surface where the unknowns are hiding. Driver trees help us connect top-level outcomes to leading indicators, so we can place bets where they have the highest causal leverage. I also lean on the Kano Model and qualitative signals to avoid over-investing in performance attributes while neglecting excitement features that unlock differentiation and word-of-mouth.
The most effective stakeholder management is narrative-first. For executives, I present a one-page outcomes roadmap that shows themes, expected shifts in key results, and the learning plan. For teams, I provide a more detailed plan that links discovery insights, assumptions-to-test, and decision points. I make room for a “what we’re not doing” section to reduce noise and prevent shadow backlogs from reappearing in every meeting. Most importantly, I socialize change before it happens, explaining the evidence and the trade-offs so adjustments feel like progress, not whiplash.
Measurement closes the loop. We instrument experiments and releases with leading indicators tied to the driver tree and review them on a predictable cadence. If movement stalls, we diagnose whether we have a targeting problem (wrong audience), a value problem (weak proposition), or a friction problem (broken journey). That discipline lets us iterate with purpose instead of chasing vanity metrics or isolated anecdotes.
Here’s a concrete example of roadmapping through uncertainty. Suppose our Q3 objective is to “Increase user activation” with key results to raise the Week-1 activation rate from 32% to 45% and cut time-to-first-value by 30%. In discovery, customer interviews reveal confusion in the first-run setup and a missing integration that advanced users expect. We map an opportunity solution tree and identify two high-leverage opportunities: simplifying the first 10 minutes and offering a guided setup for the integration. We then shape two minimal bets: an in-app guide to streamline the first three tasks and an integration wizard behind a feature flag. Each bet has an explicit decision rule and a two-sprint runway. We ship the guide first, confirm a statistically significant lift via A/B testing, then expand scope. The integration wizard underperforms initial expectations, so we pause, revisit the assumptions, and re-allocate buffer to the stronger path. The roadmap updates in real time, and everyone understands why.
When uncertainty spikes—new competitor, pricing shock, platform deprecation—I shift the roadmap cadence to rolling-wave planning. We shorten planning horizons, increase the frequency of readouts, and elevate discovery allocations temporarily. We also create thematic “containment zones” where we explore multiple options in parallel with small budgets until one path justifies scale. This allows us to stay responsive without abandoning strategy.
Good governance accelerates, it doesn’t slow. A lightweight product council that reviews outcomes, risks, and cross-functional dependencies prevents surprise escalations and ensures we keep shipping what matters. We avoid death-by-approval by agreeing in advance on decision rights and thresholds—for example, a product trio can pivot a bet within a theme up to a certain budget or timeline impact without additional approval, as long as it improves the outcome likelihood.
If you’re evolving your roadmap practice, start with three moves. First, reframe your plan in outcomes and publish a driver tree that connects those outcomes to the few leading indicators you believe move them. Second, stand up a continuous discovery cadence with a visible opportunity solution tree and an assumptions-to-test backlog. Third, implement time windows and confidence levels for all mid- and long-term items, and pair each major initiative with explicit kill criteria. You’ll feel the difference in a single quarter: clearer trade-offs, faster learning, and more predictable delivery—despite uncertainty.
In the end, a roadmap that thrives in uncertainty is an agreement about how we learn and decide together. It aligns the organization on outcomes, it funds options—not fantasies—and it gives empowered product teams room to maneuver. That’s how top product teams plan for uncertainty and still deliver with confidence.
Lately, it feels like every morning brings a new AI launch, a dazzling demo, or a must-try tool. I love the pace of innovation, but the constant stream can trigger counterproductive FOMO if I’m not intentional. As a product leader, I’ve learned to turn that anxiety into a disciplined learning system—one that keeps me curious without letting novelty hijack my focus.
That’s exactly why this conversation with Petra Wille and Teresa Torres resonated with me. They explore how to stay experimental in the AI era without chasing every shiny object. Their perspective aligns closely with my own operating cadence: start with real problems, go deep on a small set of tools, and create explicit boundaries between work, learning, and play.
Listen to this episode on: Spotify | Apple Podcasts
Here’s the mindset I apply. I don’t start with tools—I start with problems. When I encounter concrete friction in a workflow or see a credible opportunity to improve an outcome, that’s my trigger to explore a new capability. This mirrors the continuous discovery habit of prioritizing opportunities over solutions, and it’s how I avoid performing “innovation theater.”
To keep exploration healthy, I time-box my learning. I block recurring windows specifically for experiments, reading, and hands-on trials so they don’t overrun my core product work. During these blocks, I’ll set a clear question, run a tight test, and capture what I learned. No rabbit holes, no endless tinkering.
I also separate “interesting” from “actionable.” Plenty of inputs are worth awareness, but very few deserve immediate action. I bookmark the rest for later. This simple filter reduces cognitive load and keeps my backlog—from ideas to proofs of concept—well-governed.
Social media can amplify technology hype cycles, so I establish boundaries. I batch consumption, mute low-signal channels, and prioritize practitioner communities over performative threads. The goal isn’t to be first; it’s to be right for my customers, my team, and our strategy.
When choosing what to try next, I use a practical rubric. Does the tool target a real friction I’ve seen in discovery or delivery? Can it plug cleanly into our AI workflows without unsustainable glue work? Do we have a safe, compliant way to test it? Is there a plausible path from trial to compounding value? If the answer isn’t a confident yes to most of these, I wait.
Depth beats breadth. I’d rather take one promising tool into a real use case, instrument it, and measure outcomes than skim ten trending demos. That tighter loop produces sharper intuition, clearer product bets, and better partner decisions. A quick opportunity solution tree helps me connect user pain to outcomes before I let any solution onto the field.
In the episode, Petra Wille and Teresa Torres talk candidly about managing FOMO, deciding which tools to explore, and designing intentional learning systems. They discuss why starting with a problem is more valuable than starting with a tool, how social media amplifies technology FOMO, and why going deeper with fewer tools can lead to better learning. If you’ve ever felt like you’re falling behind because you haven’t tried the latest AI tool yet, this conversation will help you rethink how you approach learning and experimentation.
If you’re curious about what came up, here are some of the tools and communities mentioned: Claude Code, OpenClaw (formerly Clawdbot, Moltbot), NotebookLM, Product Talk, ElevenLabs, Lenny’s Newsletter Community, and even a nod to Bridgerton for a touch of levity.
My takeaway is simple but powerful: curiosity doesn’t require constant experimentation. The best product managers cultivate a balanced system—grounded in product discovery, energized by focused experiments, and protected by clear boundaries—so we can learn faster while staying pointed at outcomes that matter.
Discussion Question: How do you decide which new tools or technologies are worth exploring—and which ones you can safely ignore?
I’ve learned the hard way that sample size calculators can be both empowering and deceptive. They feel wonderfully precise, but they’re only as trustworthy as the assumptions you feed them. When I lead A/B testing at scale, I treat the calculator as a planning tool, not a verdict—then I systematically validate the assumptions behind it so our decisions stay rigorous and our roadmap stays credible.
At a minimum, most calculators assume you know your baseline rate, your “minimum detectable effect (MDE),” your desired statistical power, and your significance level. They also quietly assume independent observations, clean randomization, stable traffic quality, and a fixed test horizon with no peeking. If any of those break, the “right” sample size can be wildly wrong—and the test conclusions can nudge teams toward the wrong product or go-to-market bet.
Baseline and variance come first for me. I estimate the baseline conversion (and volatility) from recent behavior using behavioral analytics, sanity-check it across key segments, and look for seasonality. Tools like Amplitude analytics help me spot anomalies, bots, or instrumentation drift. If baseline is unstable or highly skewed, I either stabilize it with longer lookbacks or narrow the target segment to reduce noise.
Setting the “minimum detectable effect (MDE)” is where product strategy meets statistics. I work backward from an outcome that actually matters: the revenue, retention, or activation uplift that justifies the opportunity cost of building and running the experiment. If that effect size is implausible given historic lift and variance, I rethink the scope or stack changes into a sequenced set of learning experiments rather than overpromising a single moonshot.
For power and alpha, I default to 80–90% power and a 5% significance level unless the downside risk of a false positive is unusually high, in which case I tighten alpha. I choose one-tailed tests only when we would not act on a negative result and we’ve explicitly pre-registered that decision; otherwise, two-tailed is safer for real-world ambiguity.
Randomization and independence are where many tests quietly fail. I randomize at the user level (not session or pageview), guard against cross-device contamination, and ensure consistent exposure via feature flags. If there’s shared context—say, team-based usage or geographic clustering—I account for it via cluster randomization or acknowledge the inflated variance it can introduce.
Traffic allocation integrity is non-negotiable. I monitor for sample ratio mismatch by comparing observed group splits to the intended allocation and immediately pause if they drift. When SRM appears, the root cause is often instrumentation gaps, eligibility filters applied asymmetrically, or caching layers. Fixing that early preserves trust in every test that follows.
Fixed-horizon math assumes no peeking. If stakeholders need continuous reads, I use sequential testing methods with alpha spending or always-valid approaches designed for ongoing monitoring. If we commit to a fixed horizon, we stay disciplined: no early looks, no midstream metric swaps, no retrofitted hypotheses.
Multiple comparisons can quietly inflate false positives. I predeclare one primary metric to decide, define guardrail metrics to protect experience and revenue, and apply appropriate corrections (for example, controlling the false discovery rate) when testing many variants or slicing results by numerous segments.
Duration and seasonality matter more than most roadmaps admit. I run through full business cycles (at least one complete week for daily patterns, longer for B2B buying rhythms), plan for novelty effects, and watch for behavior settling after initial exposure. If the intervention changes long-run behavior, I extend the measurement window or add a post-test holdout to capture durable impact.
Not all metrics are binomial. For revenue, time-on-task, or heavy-tailed distributions, I confirm variance assumptions, use robust estimators or bootstrapping, and consider variance reduction methods like CUPED to improve power without overextending duration. The calculator’s simplicity should not mask the data’s complexity.
Finally, I connect experimentation to product outcomes. I map hypotheses to a driver tree, ensure each test ladders to activation, retention, or monetization, and document assumptions up front so we learn even when results are null. The result is a culture that respects the math and moves faster precisely because we trust our reads.
Here’s the practical checklist I use before pressing “Start”: validate baseline and variance from recent behavior; set an MDE tied to meaningful business impact; choose power and alpha explicitly; confirm user-level randomization and stable exposure; watch for sample ratio mismatch; align on fixed-horizon vs sequential testing; predeclare a single primary metric and guardrails; run long enough to cover seasonality; use robust methods for non-binomial metrics; and write a brief pre-read so the whole team commits to the plan.
When we honor these assumptions, sample size calculators become sharp instruments rather than blunt ones. You’ll ship fewer misleading wins, avoid costly false negatives, and build a repeatable experimentation engine that compounds learning—and results—over time.
Inspired by this post on Amplitude – Perspectives.
“Continuous Discovery Habits” turns five this year, and I’m celebrating by reading it with our community—together, in practice, not just in theory. Each month, I’m publishing an in-depth reading guide with the chapters we’ll cover, a preview of the most important concepts, short videos you can share with your teams, individual and team discussion questions, practical exercises to apply what you read, and additional resources to go deeper.
We’ll keep the conversation active in the comments each month and meet live once a quarter to compare notes, share what’s working, and troubleshoot what’s not. If you’re joining late, no problem—start with the current month or go back to January. You can also find all of the book club articles here.
If you want to participate, grab a copy of the book (or dust off your old one), share the “Spread the Love” videos with colleagues, block time for the team exercises, and register for the community sessions. Let’s dive in together.
This chapter grounds us in why interviewing on a regular cadence is critical to the success of any product trio; how cognitive biases affect what we learn from direct questions; the difference between research questions and interview questions; how to use story-based interviewing to uncover actual customer behavior (not ideal behavior); the interview snapshot, a one-page tool for synthesizing what you learned from a single interview; how to automate the recruiting process so interviewing becomes easier than not interviewing; and why product trios should interview customers together.
Need a copy? Grab the book.
Share the Love with Friends and Colleagues
We learn best in community. To help your team rally around these practices, share these concise primers and invite them to join the book club discussion with you.
What are customer interviews? – Build a competitive advantage that compounds over time.
What should we ask in customer interviews? – Mitigating cognitive biases.
Research questions vs. interview questions – And why the difference matters.
Getting reliable feedback from customer interviews – Ask the right questions.
Who should conduct customer interviews? – My answer might surprise you.
How do you find customers to interview? – Automate the recruiting process.
The Interview Snapshot – How to synthesize a single customer interview.
Reflect and Discuss What You Read
Reflection cements learning. This month, I’m challenging you—as I challenge my own teams—to build a weekly habit of interviewing customers and to shift from direct questions (which trigger bias) to collecting specific stories about past behavior. For many teams, this is a big mindset change: from infrequent “big research projects” to lightweight, continuous conversations that fuel daily decision-making.
Individual Reflection: Think about your last customer interview or conversation. Did you rely on direct questions, or did you excavate a specific story about what happened? How might the answers have changed if you had used the other approach?
Consider your own behavior—buying jeans, going to the gym, choosing what to watch on Netflix. Where do your ideal intentions differ from what you actually do? How might that same gap show up in your customers’ answers to direct questions?
Scan your calendar from the past month. How many customer interviews did you conduct? If it’s fewer than four, what got in the way? What needs to change to make weekly interviewing sustainable?
Team Discussion: As a team, discuss your current interview cadence. If you’re not interviewing at least weekly, name the biggest obstacle—recruiting, time, or synthesis—and commit to reducing one barrier this month.
Try this together: Ask a teammate, “How does a product idea go from concept to launch at our company?” Have them write it down. Then ask for the last specific feature or improvement that launched and capture the story. Compare the two. What’s different? What does this reveal about the gap between ideal process and actual process?
If you already interview regularly, ask: Who participates? Is it just one person (like the designer or product manager), or does the whole trio join? What value might you be missing by not having all three perspectives in the room?
Put It Into Practice
Understanding the “why” is easy; building the habit is the work. The following exercises are how my teams operationalize continuous interviewing week over week.
Exercise: Conduct a Story-Based Interview (Time: 20–30 minutes. Do this with your product trio.) Schedule a conversation with a current customer. Instead of drafting a long script, identify a handful of research questions (what you need to learn) and translate them into one story-based interview question (what you’ll ask).
For example, research questions might include: What challenges do customers face when onboarding? Where do they get stuck? What are we asking them to do that they don’t understand? How can we make it easier for them to get to the activation moment? The corresponding interview question could be: Tell me about the first time you used our product.
During the interview, excavate the story with temporal prompts like “What happened first?”, “What happened next?”, and “What happened before that?” If the participant drifts into generalities (“I usually…” or “In general…”), gently bring them back to the specific instance.
After the interview, debrief as a trio. What did each of you hear? Which opportunities surfaced? What surprised you? If you want personalized, detailed feedback on your technique, consider the Interview Coach available through the Story-Based Customer Interviews course.
Exercise: Create Your First Interview Snapshot (Time: 30 minutes. Do this with your product trio immediately after the interview.) Using the interview snapshot template, capture a photo of the participant (or a visual that represents their story), quick facts about their context, a memorable quote you’ll still recall months from now, the opportunities (needs, pain points, desires) you heard, notable insights that aren’t yet opportunities, and an experience map that illustrates the story. Over time, aim to complete each snapshot in 15–20 minutes.
Go Deeper: Additional Reading
If you prefer audio, I’ve included an audio summary for paid subscribers that covers this month’s chapter plus the resources below.
Related In-Depth Guides: Customer Interviews: How to Recruit, What to Ask, and How to Synthesize What You Learn.
The Value of Continuous Interviewing: Why Product Trios Should Interview Customers Together – How interviewing together ensures research is timely, actionable, and believable.
How to Find Customers to Talk To: Customer Recruiting: Get Easy Access to Customers Week Over Week – Practical strategies for automating your recruiting process. Ask Teresa: How Do You Select Customers for Customer Interviews? – Who to interview and how to recruit them. Tools of the Trade: Finding People to Interview Before You Have Customers – Recruiting strategies for early-stage products.
What to Ask in Your Interviews: Why You Are Asking the Wrong Customer Interview Questions – Understanding the gap between ideal behavior and actual behavior. Story-Based Customer Interviews Uncover Much-Needed Context – Why collecting specific stories is more reliable than asking direct questions. Ask Teresa: What Are the Best Customer Interview Questions? – Common questions and how to improve them. Ask About the Past Rather than the Future – Why memories about recent instances are more reliable than speculation.
How to Take Notes and Synthesize What You Are Learning: How to Take Notes During Customer Research Interviews – Practical tips for capturing what you hear. The Interview Snapshot: How to Synthesize and Share What You Learned from a Single Customer Interview – A comprehensive guide to creating and using interview snapshots. Customer Interview Analysis: How AI Helps and Hurts – Learn how to use AI effectively.
Videos: All Things Product Podcast: Customer Interview Analysis – Petra and I discuss using AI to analyze customer interviews, the risks and benefits, and why your interviewing skills matter more than any AI tool.
Other Resources from Around the Web: The Top 5 Mistakes Product Teams Make With Customer Interviews by Pragmatic Live. Continuous interviewing with Kristian Collin Berge (CEO & Co-founder at UX Signals) by Afonso Franco. How to Make Time for Customer Interviews & Validation by Rich Mironov. Brave UX: An interview with Teresa Torres by Brendan Jarvis.
Related Courses: Customer Recruiting for Continuous Discovery – Get easy access to customers week over week. Story-Based Customer Interviews – Collect reliable feedback from every customer conversation.
Our Live Discussion Schedule
Our live discussion sessions are for paid subscribers. Sessions are not recorded. Invitations will go out to members two weeks before each event—add these to your calendar now: Tuesday, June 16, 2026: 9am–10am PDT. Thursday, September 17, 2026: 9am–10am PDT. Wednesday, December 16, 2026: 9am–10am PST.
Audio Summary
This summary was produced by NotebookLM. The sources supplied were the book chapters as well as all of the additional reading.
This article is part of the CDH Book Club celebrating the five-year anniversary of Continuous Discovery Habits.
I’m continually asked how machine learning can make product analytics more actionable. Drawing from Amplitude analytics in real-world settings, I’ve distilled what matters most for product teams that want faster, smarter decisions without sacrificing rigor.
When I design experiments, I start with minimum detectable effect (MDE) to size samples correctly and avoid costly, inconclusive tests. I pair that with disciplined A/B testing hygiene—clear hypotheses, thoughtful stop rules, and guardrails for key metrics—so results translate into credible product strategy choices instead of noisy dashboards.
For growth and retention, I map behavioral analytics to activation and long-term value. Driver trees help me connect feature adoption to revenue or retention, and anomaly detection keeps me from overreacting to outliers when seasonality or data quality shift.
I segment cohorts by user intent and lifecycle stage, measure user activation with crisp event definitions, and monitor leading indicators across a unified analytics platform. This keeps cross-functional conversations grounded, accelerates product-led growth, and reduces the risk of optimizing for vanity metrics.
Operationally, that means building self-serve views that flag MDE-ready experiments, surface retention analysis by cohort, and trigger anomaly detection alerts only when the signal outpaces noise. The payoff is fewer meetings debating data quality and more time shipping value.
If you’re leveling up your analytics stack, start by tightening experimentation basics, instrumenting activation and retention with behavioral analytics, and wiring in anomaly detection as a safety net. You won’t just move faster—you’ll learn faster, and with the confidence to bet big when the data earns your trust.
Inspired by this post on Amplitude – Perspectives.
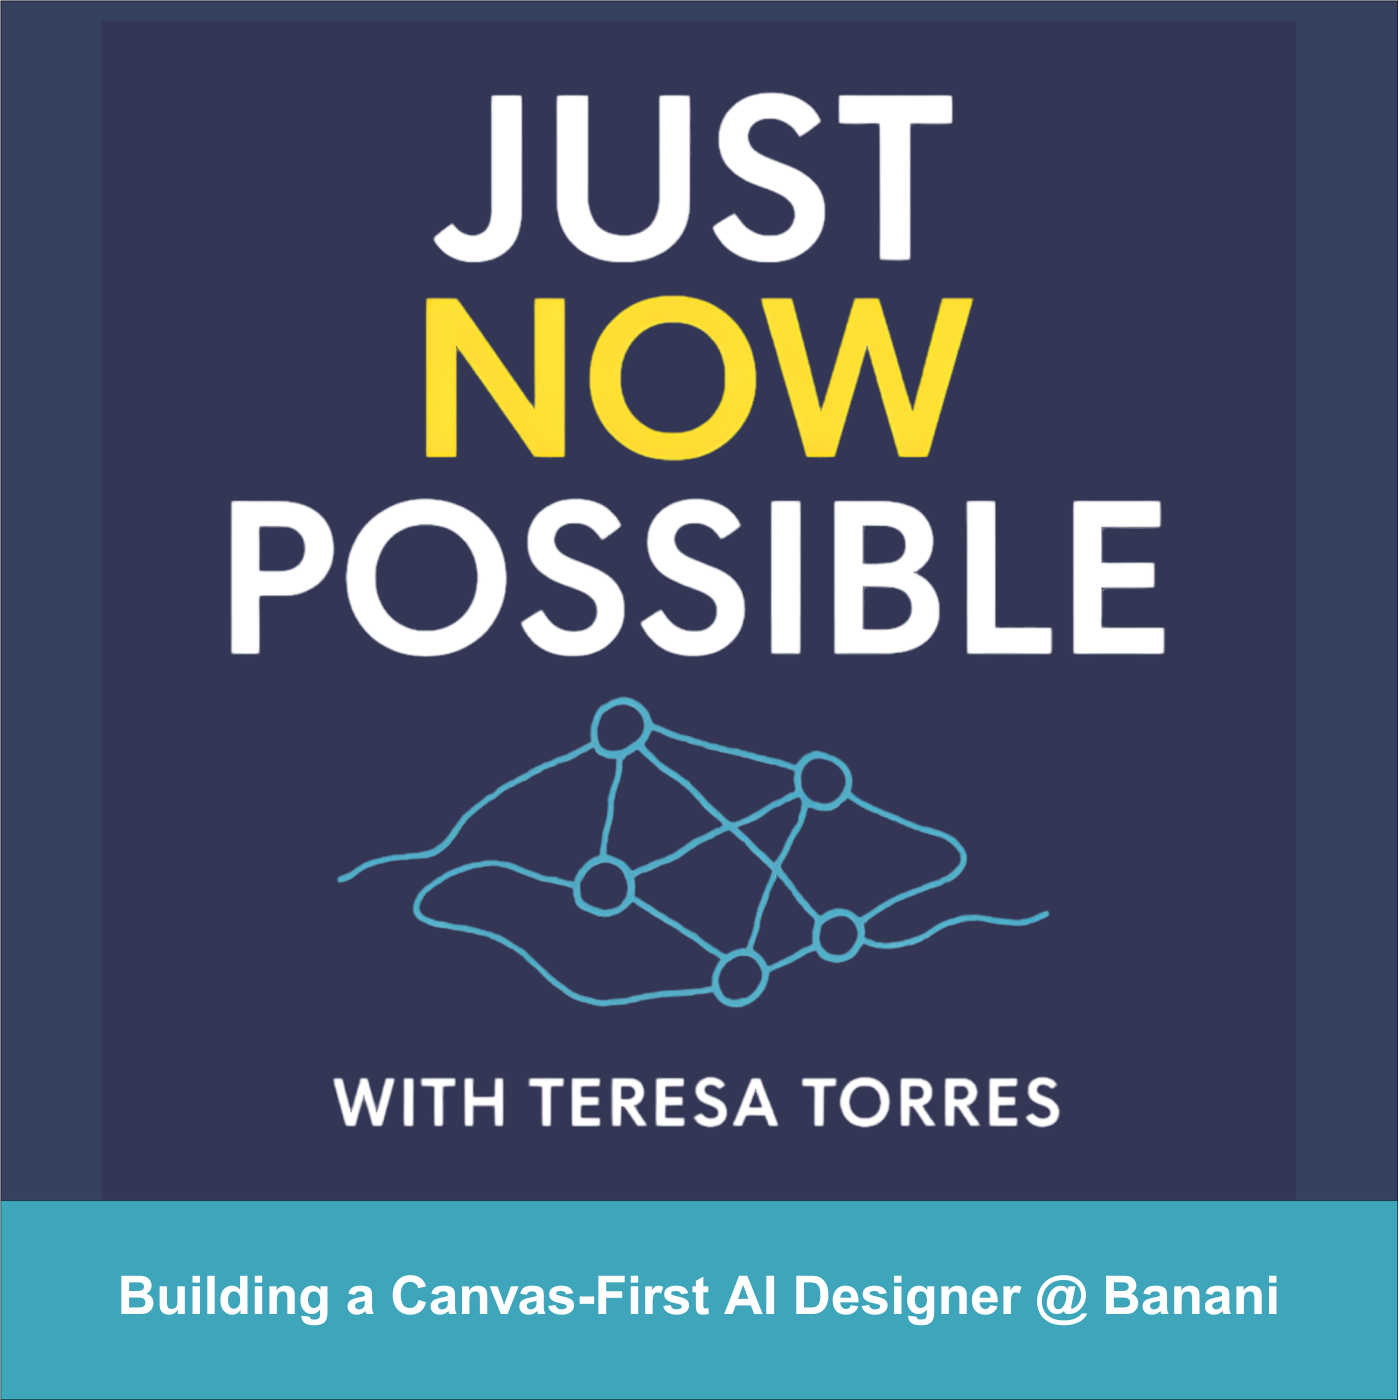
I believe the future of product design isn’t about replacing designers—it’s about giving every team access to one. That’s why Banani grabbed my attention. It’s an AI product designer that doesn’t just generate code—it generates design. For solo founders, stretched design teams, and early-stage startups, that shift matters: it raises the design floor without lowering the creative ceiling.
I spent time with Vlad Solomakha (CEO & Co-founder), Vova Kovalchuk (CTO & Co-founder), and Vlad Ostapovats (Founding Growth) to unpack how they took Banani from a Figma plugin proof-of-concept to a canvas-first AI design tool generating hundreds of thousands of designs per week. Vlad brings a decade of design experience and a precise north star: AI should produce beautiful, tasteful design rather than average, undifferentiated UI.
The architectural choices stood out. They engineered their agent to handle parallel screen edits, manage per-screen context across canvases with hundreds of frames, and make surgical edits without regenerating entire screens. This is the kind of agentic AI work that product leaders have been waiting for: concrete advances in context window management, tool orchestration, and prompt engineering that translate into higher throughput without sacrificing quality.
Equally important is how they addressed the "gulf of specification"—the mismatch between how designers think visually and how agents understand text. Banani’s canvas-first approach acknowledges that design is spatial, hierarchical, and iterative. Rather than forcing a chat-first UX, they center the canvas and let the agent do production work while keeping the designer firmly in control. In practice, this narrows intent ambiguity, speeds up iteration, and preserves taste.
The team made another pivotal bet: Why Banani doesn’t compile running applications — just HTML/CSS mockups — and how that shapes everything. By decoupling the design artifact from runnable code, they optimize for velocity, taste, and exploration. In my experience, this separation is the right product strategy for early discovery and gen ai for product prototyping—move fast on aesthetics and flows, then converge on implementation once you’ve validated the direction.
I also appreciated their pragmatic evaluation approach. Instead of traditional evals, they spin up 10 screens from one prompt to compare models. It’s hands-on, outcome-based, and aligned with eval-driven development in real product environments. They’re relentlessly discerning about when to work around model limitations versus when to wait for the models to improve—an essential discipline when building at the edge of what’s possible.
Under the hood, context engineering and specialized agent tools do the heavy lifting. Per-screen history with shared project context enables precise, reversible changes across large canvases. The result: fewer destructive regenerations, more reliable design intent preservation, and a workflow that feels like collaborating with a strong mid-level designer who’s exceptionally fast and consistent.
If you want a quick tour, I recommend jumping to a few highlights: 20:13 Product Tour Canvas First AI, 33:40 Gulf of Specification, 42:54 Agent Architecture Under Hood, 48:48 State History Context Tricks, and 56:04 Navigating Busy Canvases. Each segment reveals a different layer of the system design and product thinking behind Banani’s canvas-first UX.
For product leaders, this is a compelling blueprint for raising the design floor while protecting the last mile of craft. It aligns with empowered product teams, continuous discovery, and LLMs for product managers who need leverage without losing judgment. If you’re exploring agentic AI in design, this is a thoughtful, execution-focused model worth studying and trialing on your next product tour or redesign.
Resources worth exploring: Banani and TL Draw. To hear the full conversation, you can listen on Spotify or Apple Podcasts. Then, pressure-test the approach inside your own product development lifecycle and see how a canvas-first AI designer reshapes your team’s velocity and quality bar.