Month: May 2026

  • How to Build a SaaS Retention and Expansion System

    How to Build a SaaS Retention and Expansion System

    Your team can explain churn after it happens. The harder problem is seeing a customer change direction early enough to do something useful, then knowing whether the intervention actually changed the outcome.

    You do not solve that problem with another health dashboard. You solve it with a closed-loop operating system: define how customers progress toward value, detect when that progression changes, choose the right intervention, and measure the incremental result. Built well, the same system protects retention and identifies credible expansion opportunities.

    Treat retention and expansion as one value-progression system

    Retention and expansion are often split across teams, tools, and meetings. Customer Success monitors renewal risk. Product watches activation and feature adoption. Sales looks for additional revenue. Support handles whatever breaks. Marketing runs lifecycle campaigns. Each function can be busy while the customer still receives a fragmented experience.

    The better organizing principle is customer value progression. A retained customer continues receiving enough value to justify the relationship. An expanding customer is ready to receive that value across more users, workflows, usage, or capabilities. The two outcomes sit on the same path.

    That changes the question from, Which accounts might churn? to, What value state is this account in, what evidence supports that assessment, and what should happen next?

    1. Define the state. Translate product, support, CRM, and commercial signals into a recognizable customer condition.
    2. Make a decision. Select an intervention, assign a human owner, or deliberately take no action.
    3. Act in context. Use the channel and message appropriate to the customer’s current job, friction, and relationship.
    4. Observe the response. Track whether behavior, value attainment, or commercial outcomes changed.
    5. Learn and revise. Keep playbooks that produce incremental value, change weak ones, and retire harmful or noisy ones.

    This loop is the system. A prediction model, lifecycle tool, or customer-success platform is only one component inside it.

    Key takeaways

    • Model movement toward and away from value, not churn as a single binary event.
    • Keep the account state, its underlying drivers, and the recommended action visible together.
    • Use automated journeys for clear, low-complexity situations and human help when diagnosis or commercial context matters.
    • Separate risk recovery from expansion outreach, even when both use the same underlying data.
    • Measure incremental outcomes with an eligible comparison group or holdout whenever possible.
    • Start with one segment and one customer state before adding more data, models, and playbooks.

    Instrument customer states, not a pile of events

    A login is not value. A feature click is not adoption. A support ticket is not necessarily risk. Raw events become useful only when you interpret them in the context of a customer journey.

    Begin with a small set of decisions your system must support. Common starting use cases include an activation funnel, onboarding drop-off, and adoption of the product’s core capability. A lightweight tracking plan, consistent event names, and explicit initial use cases give Product, Data, Growth, and Customer Success a shared language for those decisions.

    Define customer states before designing a score. The exact evidence will differ by product, segment, pricing model, and maturity, but the state taxonomy can remain understandable:

    Customer stateEvidence to define for your productDecision the state should enable
    Onboarding stalledA required setup or first-value milestone was started but not completed, or progress stopped relative to the expected journeyRemove a specific blocker before sending broader education
    Activated but shallowThe account reached initial value, but usage remains concentrated in one person, workflow, or capabilityHelp the account repeat and distribute the successful behavior
    Healthy and deepeningCore outcomes recur, usage is stable or growing, and value is spreading through the intended scopeReinforce success and watch for an adjacent need
    ContractingRelevant usage, active participation, or workflow breadth is declining relative to the account’s own baselineDiagnose whether the cause is friction, seasonality, organizational change, or reduced need
    Expansion readyThe current scope is producing value and the account has an evidenced adjacent need, capacity constraint, or unserved groupOffer a relevant next step without disrupting existing value

    Do not assign universal activity thresholds merely because they are easy to query. The same number of weekly users can mean strong adoption for a small account and serious contraction for a larger one. Compare an account with its expected journey, purchased scope, peer segment, and prior behavior.

    Your data model also needs to distinguish a person from an account. A power user can make an account look healthy while every other intended user disengages. Conversely, a stable automated workflow may create value without frequent logins. Track the unit at which value is delivered, then roll that evidence up to the commercial account.

    For each meaningful behavioral event, capture enough context to reconstruct what happened: account identity, user identity where relevant, event name, timestamp, source, product object or workflow, plan or entitlement context, and outcome. Resolve duplicate identities before calculating breadth or frequency. Missing data must remain distinguishable from negative behavior; an integration outage is not customer disengagement.

    Behavior alone is incomplete. Useful retention systems can combine product usage, CRM context, support interactions, billing health, and qualitative session evidence. Each signal should have an owner, a freshness expectation, and a clear meaning. If nobody can explain how a field affects a decision, it does not yet belong in the model.

    Turn signals into explainable risk and opportunity decisions

    A single health score is convenient for sorting accounts. It is poor guidance for action. Two accounts can receive the same score for completely different reasons: one failed to finish onboarding, while another lost active users after months of successful use. They should not receive the same message or playbook.

    Keep a compact score if it helps prioritize work, but expose the dimensions beneath it:

    • Value attainment: Has the account completed the behaviors associated with its intended outcome?
    • Depth: Is the core workflow repeated enough to become part of normal work?
    • Breadth: Is value distributed across the intended users, teams, use cases, or product areas?
    • Trajectory: Is relevant behavior growing, stable, stalled, or declining against an appropriate baseline?
    • Friction: Are unresolved issues, repeated failures, poor outcomes, or setup barriers preventing progress?
    • Commercial health: Is the account approaching a renewal, reducing scope, encountering billing trouble, or operating near a legitimate capacity boundary?

    Every flagged account should carry reason codes in plain language. A useful record says that core workflow usage declined from the account baseline, active participation narrowed, the change began after an unresolved issue, and the evidence was refreshed recently. A label such as health score: 42 does not tell an owner what to do.

    Also show what would disconfirm the assessment. If a supposed contraction signal is seasonal, expected, or caused by a tracking change, the owner needs a way to correct it. That feedback should improve the rule or model instead of disappearing into private notes.

    My default is to begin with transparent rules and cohort comparisons. Add machine learning when the volume, complexity, and demonstrated lift justify it. A black-box score creates false precision if Product cannot trace it to behavior and Customer Success does not trust it enough to act. Clear drivers, cohort-level analysis, and explainable scoring are operational requirements, not cosmetic reporting features.

    AI is useful for classifying issue themes, summarizing account context, detecting unusual changes, ranking eligible accounts, and recommending a playbook. It should not silently make ambiguous commercial commitments or send sensitive outreach to a strategically important account without the controls your business requires. Preserve the underlying evidence, model or rule version, chosen action, human override, and eventual outcome so the decision can be audited.

    Apply the same discipline to governance. Limit access to account data by role, record consequential changes, define how customer data may be used, and evaluate retention tooling for privacy, implementation burden, and maintainability as well as predictive performance. A model that cannot be governed will eventually become difficult to trust or operate.

    Match each customer state to a bounded playbook

    A signal without an intervention is reporting. An intervention without eligibility rules is noise. Build a small library of bounded playbooks, each designed for one customer condition and one desired state change.

    Every playbook should specify:

    • The eligible segment and state.
    • The evidence that triggers entry.
    • Conditions that suppress outreach, such as an unresolved incident, a recent human conversation, an opt-out, or an active commercial negotiation.
    • The customer problem and value hypothesis.
    • The channel, message, and accountable owner.
    • The action you want the customer to take.
    • The success event and business outcome.
    • The guardrails that reveal annoyance, added support burden, or unintended contraction.
    • The exit condition, expiration rule, and fallback if the customer does not respond.

    That template forces useful distinctions between common plays:

    1. Onboarding rescue. Identify the missing value milestone and address that obstacle directly. Use an in-product guide for a clear, contextual step. Route technical ambiguity or multi-step setup to a person who can diagnose it.
    2. Shallow-adoption expansion. Help an already successful user repeat the core workflow or bring the right colleagues into it. Do not pitch additional commercial scope before the existing scope is working.
    3. Friction recovery. Connect repeated errors, unresolved issues, or failed outcomes to the affected workflow. Fixing the underlying problem takes priority over a generic educational campaign.
    4. Contraction diagnosis. Ask why behavior changed before prescribing a solution. Declining activity may reflect product friction, a completed project, seasonality, team turnover, or a genuine loss of need.
    5. Consultative expansion. Trigger outreach after demonstrated success and an evidenced adjacent need. Frame the next step around the customer’s outcome, not an arbitrary quota or a feature list.

    Channel choice matters. In-app guidance works when the next step is clear and the customer is already in the relevant context. Lifecycle messaging can reinforce an understood behavior. Customer Success or Sales should handle relationship-heavy and commercial situations. Support is especially valuable when the opportunity requires product depth, diagnosis, or credibility earned through solving a real problem.

    AI automation can give support teams capacity for that higher-context work, but capacity alone does not create a consultative motion. One AI-enabled support transformation started with a small volunteer cohort inside an organization of more than 100 people and grew to roughly 16 participants across regions within a year. Early use cases focused on trial guidance, optimization for mature customers, and accounts that appeared ready for broader adoption.

    The implementation lesson is more important than the org chart: protect core support quality, recruit people who want to test the motion, and train for curiosity, commercial awareness, and broader customer context. Product knowledge is necessary, but consultative work also requires the restraint to ask another question before recommending an answer.

    Keep automation reversible. If the account’s state changes, a human begins working the case, or new evidence contradicts the trigger, stop the sequence. A retention system should respond to current customer reality, not continue executing an outdated classification.

    Prove incremental impact and build an operating rhythm

    The easiest measurement mistake is comparing customers who accepted help with customers who ignored it. In a six-month comparison, accounts that engaged with proactive support grew roughly twice as fast in both usage and expansion as accounts that were contacted but did not respond. That is a meaningful operational signal, but it is not the same as randomized causal proof: customers who engage may already be more motivated, better staffed, or more likely to grow.

    When the stakes and volume permit, define the eligible population first and assign eligible accounts to treatment and holdout groups. Randomize at the account level when account-level outcomes and cross-user spillover matter. Measure all assigned accounts in their assigned group, including customers who never engage with the intervention. That estimates the effect of offering the playbook, not merely the characteristics of people who accepted it.

    Before launch, document:

    • The customer state and segment being tested.
    • The intervention unit: user, workspace, account, or another value-bearing entity.
    • The primary outcome the playbook is meant to change.
    • The observation window, chosen to match the expected behavior and commercial cycle.
    • The minimum detectable effect (MDE) that would make the effort worth acting on.
    • Leading indicators that show whether customers moved through the intended mechanism.
    • Guardrails that would stop or narrow the rollout.
    • The decision rule for scaling, revising, or retiring the playbook.

    If random assignment is not practical, use the strongest comparison your context allows. At minimum, compare accounts that were eligible at the same time and stratify by segment, starting health, lifecycle stage, and prior trajectory. Label the result as observational. Do not turn a directional association into a causal revenue claim.

    Use a measurement stack rather than one success metric:

    • Mechanism metrics: completion of the missing milestone, restored core behavior, increased workflow breadth, or resolution of the triggering friction.
    • Intervention metrics: eligibility, delivery, response, acceptance, completion, time to action, and exit reason.
    • Commercial outcomes: renewal, churn, contraction, expansion, and Net Recurring Revenue.
    • Guardrails: opt-outs, complaints, avoidable support demand, negative product outcomes, and harm to other customer journeys.

    A common NRR calculation is starting recurring revenue plus expansion, minus contraction and churn, divided by starting recurring revenue. Document your exact definition and keep it stable. Report gross retention, contraction, and expansion beside NRR because strong expansion can conceal losses elsewhere in the customer base.

    The operating review should end in decisions, not dashboard commentary. Inspect data quality first. Then review movement between customer states, playbook reach and outcomes, experiment evidence, guardrail breaches, and customer feedback. For every change, record an owner, the rule or playbook being changed, the expected effect, and when the evidence will be reviewed.

    Ownership must follow the loop. Product can define value milestones and product interventions. Data can maintain instrumentation and analytical quality. Support and Customer Success can diagnose context and execute human plays. Growth can operate scaled journeys. Revenue Operations can maintain CRM and commercial definitions. One accountable leader still needs to own whether the complete system produces better customer and business outcomes.

    Do not begin by buying a prediction platform or modeling every possible customer state. Choose one segment where a meaningful signal appears early enough to act. Define the state, instrument the evidence, create one bounded playbook, and preserve a credible comparison group. Add complexity only after that loop changes an outcome you care about. That is how retention stops being a renewal rescue exercise and becomes a product operating capability.

    References

  • Outcome-Based Pricing That Delivers: Pay $10 Only for Qualified Leads with Fin for Sales

    Outcome-Based Pricing That Delivers: Pay $10 Only for Qualified Leads with Fin for Sales

    Our outcome-based pricing model hinges on one principle: you pay when Fin delivers value.

    As Fin takes on new roles, that principle doesn’t change, but the definition of value does.

    Fin for Sales qualifies leads, engages prospects, and routes high-intent buyers to your sales team. The value it creates isn’t a resolved query, but a pipeline of qualified opportunities. So we price accordingly: $10 per qualified lead. And you, the customer, define what “qualified” means, not Fin.

    This is the first outcome-based pricing model for an AI Agent for sales. Here’s why I believe it’s the right approach and how I’ve seen it change the way teams think about SaaS pricing and ROI.

    Over the years, I’ve learned that the fastest way to earn trust with sales and finance leaders is to align pricing with outcomes they actually report on. The core finding from our research was unambiguous: zero buyers preferred paying for activity. They wanted to pay for results.

    That insight shaped how we priced Fin for its service role, $0.99 per resolution, where a resolution means the customer’s issue is fully solved without human intervention. More recently, we evolved that model to outcomes, reflecting the broader ways Fin delivers value across complex workflows. We believe pricing should be aligned with value delivery, and the vendor should carry risk when the product doesn’t perform. In sales, the best unit of value is pipeline.

    Most sales teams today are overwhelmed by leads. Early in my career, I watched reps spend hours chasing form fills that looked promising but went nowhere. That experience cemented a lesson I still use: volume is vanity; qualification is sanity.

    Ensuring the right opportunities promptly reach your sales team is what makes a difference. When a prospect visits your site, engages with Fin, answers qualifying questions, and is directed to a sales rep, Fin is identifying whether the opportunity is worth your team’s time and delivering value.

    Charging per conversation would penalize businesses for every curious visitor who asks a question but isn’t a buyer. And charging per token, well, that’s always been a model that protects the vendor, not the customer.

    We needed a metric that captures the actual value Fin creates in a sales context: qualified leads.

    The purest version of outcome-based pricing for Fin’s sales role would be a percentage of closed revenue. Fin qualifies the lead, a rep closes the deal, and we take a cut. On paper, it looks elegant; in practice, I found it breaks down for two reasons that matter to operators.

    First, attribution. Between the moment Fin qualifies a lead and the moment a deal closes, dozens of things can impact the final result. The quality of human-led demos can differ, products can have outages, prospects’ budgets can get cut. Tying Fin’s price to the final outcome holds it accountable for variables entirely outside its control.

    Second, measurement. To track closed revenue, we’d need deep integration into every customer’s CRM, tracking each opportunity from qualification through to close. That’s a significant implementation burden that slows time to value, which is the opposite of what we want.

    So we asked: what’s the most honest proxy for the value Fin delivers, where Fin is clearly the one creating it?

    A qualified lead is that proxy. It represents the moment Fin has done its job. It has engaged the prospect, gathered the relevant information, evaluated them against your criteria, and determined they’re qualified. Everything up to that point is Fin’s work. Everything after it is the rep’s. At $10 per qualified lead, the pricing reflects this boundary.

    There are two key components to how this pricing model works.

    First, the customer defines success. With Fin’s sales role, the customer sets their own qualification criteria based on their business context. A company with high average contract values might set a lower bar because they can’t afford to miss anyone. A company where rep time is scarce and deal sizes are smaller might set a much higher bar, filtering aggressively to only surface the most promising prospects. The criteria flex to match the business.

    Second, the economics are different by design. As a Customer Agent, Fin can switch between roles like sales and service. So if you’ve deployed Fin for Sales, it can still handle support queries like prospects asking a product question. Those queries are charged at $1 per resolution, consistent with our service pricing. Disqualifications, where Fin determines a prospect doesn’t meet the criteria, are also $1. The $10 price point for qualified leads reflects the higher value of pipeline creation compared to issue resolution.

    The ROI speaks for itself. Early customers are reporting significant returns using Fin for Sales. One shared a perspective that mirrors what I hear in executive QBRs:

    “I would say it’s at least 10 times the value. You’re now giving the business exactly what it needs as opposed to just activity. We say this expression in sales leadership all the time – ‘I don’t pay my sales team for activity. I pay them for results.’ I want my AI engine to be the same way.”

    When you compare the cost of a qualified lead from Fin against the fully loaded cost of an SDR—salary, benefits, tooling, ramp time—the economics are compelling. For many businesses, particularly those that never had SDRs in the first place, Fin for Sales isn’t just replacing headcount, but creating an entirely new capability that wasn’t economically viable before.

    This pricing model came from extensive customer research—qualitative interviews and quantitative studies—exploring how buyers want to pay for AI in a sales context. We tested multiple concepts: per-conversation, per-token, per-seat, revenue share, and per-qualified-lead. The research consistently pointed to outcome-aligned pricing as the preferred model, with the qualified lead emerging as the metric that best balances value alignment, measurability, and practical implementation.

    Outcome-based pricing is still rare in AI, but we think that will change. For Sales Agents, we’re the first to do it. Transparency is part of the model. If you understand why we price the way we do, you can evaluate whether it works for your business.


    Inspired by this post on The Intercom Blog.


    Book a consult png image
  • 4 Costly Agent Analytics Myths—And the Data-Backed Metrics I Rely on Instead

    4 Costly Agent Analytics Myths—And the Data-Backed Metrics I Rely on Instead

    In my work with product, operations, and support leaders, I’m often asked to help make sense of Agent Analytics—what to track, how to attribute outcomes, and where to invest. After reviewing countless dashboards and running experiments across human agents and AI agents, I’ve learned that some of the most common measurement beliefs are precisely the ones that lead teams astray.

    What comes up in conversation with leaders about Agent Analytics, and why not everything is what it seems.

    Below, I unpack four pervasive myths I encounter and share the data-centered practices I use to replace them. My goal is simple: help you upgrade the way you measure performance so you can improve customer outcomes, accelerate learning, and scale impact with confidence.

    Myth 1: “Lower average handle time (AHT) means higher performance.” AHT is useful but incomplete. When teams optimize solely for speed, they often push complexity into repeat contacts, reopens, or escalations. In the data, that shows up as a weak or negative relationship between lower AHT and durable outcomes like first contact resolution (FCR), customer effort, or revenue per conversation.

    Reality and what I measure instead: I right-size speed by pairing AHT with intent-level resolution and recontact rate. For simple intents (password reset, billing address update), shorter is usually better. For complex intents (tiered troubleshooting, multi-step verification), “right-speeding” wins—slightly longer interactions that prevent rework. Practically, that means segmenting by intent complexity using behavioral analytics, tracking weighted “intent resolution rate,” and monitoring repeat-contact windows (24–168 hours) to catch downstream pain.

    Myth 2: “AI agent containment tells the whole story.” A high containment rate can mask failure modes such as unresolved intent, silent abandonment, or low-quality handoffs that frustrate customers and spike human workload later.

    Reality and what I measure instead: I break containment into three parts for voice and chat flows: (1) intent resolution without escalation, (2) graceful handoff quality when escalation is necessary, and (3) post-handoff efficiency and satisfaction. For voice AI agent experiences, I also track escalation clarity (did the transcript summarize history and intent?), time-to-human, and customer satisfaction on the combined interaction. This provides a fuller view of customer support ai strategy effectiveness and avoids over-crediting automation for partial wins.

    Myth 3: “Quality is subjective, so it can’t be measured at scale.” Teams often default to sporadic QA because they assume it can’t be standardized across channels or agent types. The result is noisy feedback loops and stalled coaching.

    Reality and what I measure instead: Quality becomes measurable when it’s grounded in observable behaviors linked to outcomes. I use a rubric anchored in behavioral analytics (e.g., verified customer need, correct resolution path, policy compliance, empathy markers) and validate it via correlation with FCR, recontact, and retention analysis. To scale, I combine calibrated human reviews with AI-assisted scoring, check inter-rater reliability weekly, and use driver trees to connect quality levers to business results. This creates a consistent, coachable signal for both human agents and AI flows.

    Myth 4: “If the dashboard is green after launch, we’ve won.” Early wins can reflect novelty effects, cherry-picked routing, or short-term incentives that don’t persist. Declaring victory too soon locks in fragile gains and hides regressions across cohorts.

    Reality and what I measure instead: I treat go-live as the start of learning. I use A/B testing with a clear minimum detectable effect (MDE), stagger ramps, and hold out stable control cohorts for at least one full demand cycle. I track outcomes vs output OKRs—focusing on intent resolution, customer effort, and revenue/customer health over vanity metrics. I also monitor seasonality and channel mix shifts inside a unified analytics platform to ensure improvements generalize beyond the first week.

    How I operationalize this day to day: (1) define intents and complexity upfront, (2) unify journey data across channels, (3) instrument resolution and recontact rigorously, (4) apply driver trees to isolate what actually moves outcomes, and (5) iterate via disciplined experiments rather than sweeping changes. This approach aligns product and operations, speeds up coaching, and ensures AI investments compound rather than decay.

    If you’re rethinking your Agent Analytics stack, start by replacing each myth with a sharper metric: pair AHT with intent-level resolution, pair containment with handoff quality and satisfaction, pair QA with outcome-linked rubrics, and pair green dashboards with robust experiments. The payoff is a measurement system that earns trust, guides better decisions, and consistently improves customer and business results.


    Inspired by this post on Pendo – Best Practices.


    Book a consult png image
  • How to Evaluate a Shopify-Native AI Shopping Agent

    How to Evaluate a Shopify-Native AI Shopping Agent

    You’ve probably been asked a deceptively simple question: should your Shopify store add an AI shopping agent? The hard part isn’t installing another chat widget. It is deciding whether the agent can help an uncertain shopper choose correctly without recommending unavailable products, misreading policy, or making a costly order change.

    Treat this as a commerce-system decision, not a chatbot decision. A useful agent must connect conversation, live product data, cart behavior, checkout, and post-purchase service. The evaluation framework below will help you separate a persuasive demo from a system you can trust with customers and revenue.

    The native test: can the agent read, reason, and act?

    “Shopify-native” should describe an architecture, not a distribution channel. Being listed in an app marketplace or embedded in a storefront does not make an agent native. The meaningful test is whether Shopify remains the operational source of truth while the agent uses its data and APIs in the customer’s current context.

    A concrete implementation shows how high that bar can be: a Shopify connection can expose products, variants, content, live inventory, order data, policies, and transactional APIs to the same customer-facing agent. That combination matters because a correct product description is still a bad answer if the relevant size is unavailable, and an accurate return policy is insufficient if the customer must start over somewhere else to use it.

    I would evaluate an agent at four capability levels. A product that stops at the first level may still be useful, but it should not be presented internally as an autonomous commerce agent.

    CapabilityWhat the agent needsWhat you should ask it to prove
    AnswerProduct content, store policies, and current catalog factsAnswer a precise product or policy question and identify the relevant item, variant, or rule
    RecommendCatalog relationships, inventory, conversation context, and the shopper’s constraintsTurn an ambiguous request into a short, reasoned shortlist instead of returning generic search results
    TransactCart or order APIs, authentication, permissions, and confirmation controlsUpdate a test cart or prepare an order change while showing exactly what will happen before execution
    RecoverShared state across shopping, service, and human escalationResolve a support interruption and resume the customer’s original shopping task without asking for the same context again

    Freshness is part of correctness. During a test, change the availability of a variant in Shopify and repeat the same shopping request. The agent should stop recommending that variant once the change is reflected in the connected system. Run a similar test with a policy update. A polished answer based on yesterday’s state is not a small quality defect; it can create a promise your operations team must later unwind.

    Actions deserve an even stricter test. Ask the vendor to demonstrate the complete chain: customer identification, authorization, interpretation of the request, action preview, explicit confirmation, API execution, and a visible result. If any step is simulated, ask which one. A fast setup can reduce implementation effort, but it does not prove that the agent is accurate, observable, or safe.

    Design the shopping dialogue around decisions, not keywords

    Traditional ecommerce search works best when the customer already knows the product vocabulary. A shopping agent earns its place when the request is incomplete: a gift for a partner, a mattress for a particular sleep preference, or shoes that must work across road and trail conditions. The agent’s first job is not to produce an answer. It is to discover which answer would be useful.

    A strong product-discovery dialogue follows a repeatable decision sequence:

    1. Restate the customer’s job in plain language so a misunderstanding becomes visible early.
    2. Identify hard constraints first, such as an in-stock variant, required use case, compatibility, budget boundary, or delivery requirement.
    3. Ask only for information that could change the recommendation. A question that does not alter ranking or eligibility is conversational overhead.
    4. Present a small shortlist and tie each option to the constraints the customer supplied.
    5. Explain the meaningful tradeoff between the options instead of declaring a universal winner.
    6. Offer the next useful action: compare details, select a variant, update the cart, or continue narrowing the choice.

    This sequence turns conversation design into a product requirement. For every recommended item, your evaluation record should capture the customer’s stated need, the product facts used, the reason the item fits, the tradeoff disclosed, current variant availability, and the next question or action. That record gives your team something concrete to inspect when a recommendation is challenged.

    Test whether the reasoning is responsive rather than decorative. Change one important answer while holding the rest of the conversation constant. If the customer switches from occasional use to daily use, removes a budget constraint, or requires an available color, the shortlist should change when that information is material. If the products remain identical regardless of the customer’s answers, the experience is probably search with conversational packaging.

    The agent should also know when not to narrow further. Once the customer has enough information to choose, another question adds friction. Conversely, confidence should not be manufactured when catalog data cannot resolve the request. A safe response identifies the missing fact, asks for clarification, or hands the conversation to a person with the constraints already summarized.

    Product cards can accelerate the final step, but the interface should preserve the reasoning that produced them. An image, name, and price answer “what is this?” The conversation must also answer “why does this fit me?” That is the difference between displaying inventory and assisting a decision.

    Make shopping and support one customer state machine

    A shopper does not experience your sales and support departments as separate funnels. The same person can compare products, ask about shipping, check an existing order, correct a variant, and return to buying in one session. Routing each intent to a separate tool forces the customer to reconstruct context at every boundary.

    Model the journey as one state machine: discover, decide, transact, service, and resume. The agent can move between those states, but it should retain the customer’s goal, constraints, products considered, cart state, relevant order, completed actions, and unresolved question. That shared state is more important than whether the organization labels the current message “sales” or “support.”

    This is where a connected agent can do more than answer FAQs. Current Shopify-oriented implementations can handle tracking, returns, exchanges, refunds, order changes, shipping questions, and subscription updates through connected procedures and APIs. Each additional action increases usefulness, but it also increases the consequence of a misunderstanding.

    Use different controls for different action classes:

    • Read-only actions, such as showing order status, should still require appropriate customer identification but do not change commercial state.
    • Reversible shopping actions, such as adding or removing a cart item, should be immediately visible and easy for the customer to undo.
    • Financially consequential actions, including refunds, paid order changes, and subscription updates, should require authentication, an exact action summary, explicit confirmation, and a durable result or receipt.
    • Ambiguous or unsupported actions should stop safely and transfer to a person. The agent must not treat conversational enthusiasm, silence, or an inferred preference as consent.

    That last distinction protects both the customer and the business. A mistaken recommendation can usually be reconsidered. An executed refund or subscription change creates financial and operational consequences. If the system cannot preview and verify the exact action, keep that workflow read-only and let a trained person execute it.

    The transition back to shopping also needs deliberate design. After resolving a delivery problem or order correction, the agent should restore the prior context and offer a relevant path forward. It should not force an upsell into every service interaction. The next best action after a serious order problem is often confirmation that the problem is resolved. Commercial momentum comes from reducing friction, not from ignoring the customer’s immediate priority.

    When escalation is necessary, pass a structured handoff rather than a transcript dump. Include the detected intent, verified identity state, constraints already collected, products or orders involved, actions attempted, results returned by Shopify, and the unresolved decision. A human agent should be able to continue with the next question, not repeat the first one.

    Measure incremental commerce value and operational risk

    Chat conversion is an attractive metric and an easy one to misread. People who open a shopping conversation may already have higher intent than people who do not. Comparing those groups directly can credit the agent for demand it did not create.

    Ninja Transfers reported that 10% of its conversations converted to orders with values 20% above the store’s average order value. That is a useful customer result, but it is a vendor-supplied case from one merchant, not a universal benchmark or proof that the agent caused the full difference. Your business case should depend on your own incremental test.

    Where traffic permits, randomize eligible storefront sessions between an agent experience and the existing experience. Measure the result across all eligible sessions, not only the visitors who choose to chat. That intention-to-treat view reduces self-selection bias and answers the executive question: what changed when the store made the agent available?

    Use a balanced scorecard rather than a single conversion target:

    • Business outcomes: completed orders per eligible session, revenue per eligible session, average order value, checkout completion, and assisted revenue.
    • Decision outcomes: recommendation engagement, product-detail visits after a recommendation, add-to-cart actions, and successful comparison flows.
    • Downstream quality: cancellations, returns, exchanges, and contacts caused by a poor recommendation or incorrect expectation.
    • Service outcomes: successful action completion, repeat contact for the same problem, human escalation, and time to a confirmed resolution.
    • Agent quality: use of current catalog facts, in-stock recommendation rate, policy accuracy, clarification behavior, safe refusal, and correct tool execution.
    • Risk outcomes: unauthorized or incorrect actions, failed confirmations, customer complaints, policy exceptions, and cases requiring operational repair.

    Conversion and average order value belong beside returns and cancellations. An agent can raise the initial basket by recommending a more expensive option while reducing customer fit. Without the downstream view, the dashboard rewards the sale and hides the repair.

    Your event model should make the journey reconstructable. Useful events include agent opened, intent classified, clarification answered, recommendation shown, product selected, cart changed, checkout started, order completed, support action requested, confirmation received, action completed, and human handoff. Join these events through an appropriately governed session or order identifier so the team can inspect both funnel movement and individual failure paths.

    Build the evaluation before the vendor demo

    Create scenarios from your real catalog shape, policies, and failure modes. For each scenario, write the expected outcome and the failures that would make deployment unacceptable. Include:

    • An ambiguous shopping request that requires clarification.
    • Two products that appear similar but differ on a constraint customers care about.
    • An unavailable variant that would otherwise be the best match.
    • A question whose answer depends on store policy rather than product copy.
    • A conversation that moves from shopping to order support and back again.
    • A request that sounds actionable but lacks required authentication or confirmation.
    • An unsupported request that should trigger a safe handoff.
    • A catalog or policy change made after the agent’s initial synchronization.

    Run the same scenarios repeatedly and record the underlying catalog state each time. You are testing consistency, grounding, and recovery, not literary elegance. A shorter answer that uses the correct variant and policy is more valuable than a fluent answer that improvises.

    Expand autonomy in the order of consequence

    A staged rollout lets evidence determine how much authority the agent receives:

    1. Evaluate offline with approved scenarios and representative catalog data.
    2. Launch read-only product discovery and policy answers with an obvious human fallback.
    3. Add visible, reversible cart actions after recommendation quality is stable.
    4. Introduce authenticated order-support workflows with previews and confirmations.
    5. Enable financially consequential actions only after tool execution, auditability, exception handling, and operational ownership have been tested end to end.

    Define the owner of each failure before launch. Product should own the intended customer behavior and success measures. Commerce or operations should own policy and workflow correctness. Engineering should own integration reliability and observability. Customer support should own escalation quality and emerging failure patterns. The exact reporting lines can vary; an unowned failure queue cannot.

    Review both aggregates and conversation-level traces after release. Aggregate metrics tell you whether the experience is moving the business. Traces tell you why. A small cluster of incorrect variant recommendations or failed order actions can disappear inside a healthy conversion average while creating disproportionate customer harm.

    Key takeaways

    • A Shopify-native agent should use live commerce data and governed APIs; storefront placement alone is not enough.
    • The agent’s product-discovery job is to uncover decision criteria, apply hard constraints, explain tradeoffs, and lead to the next useful action.
    • Shopping and support should share customer context, but the agent’s permissions must become stricter as actions become harder to reverse.
    • Conversation conversion is a diagnostic metric, not causal proof. Measure incremental results across eligible traffic whenever possible.
    • Pair conversion and average order value with returns, cancellations, incorrect actions, and operational repair costs.
    • Begin with read-only assistance and expand autonomy only after each workflow proves accurate, observable, recoverable, and properly owned.

    Before you approve a purchase, bring a vague shopping request, a policy edge case, an unavailable variant, a mixed sales-and-support conversation, and a consequential order action into a live test store. If the agent cannot show where its answer came from, what it will change, and how it fails safely, you have found the next product requirement, not a detail to defer until launch.

    References

  • How to Scale Session Replay Without Sacrificing Privacy

    How to Scale Session Replay Without Sacrificing Privacy

    You want session replay on more journeys because the blind spots are expensive. A funnel can show where users leave, but it cannot show whether they encountered a broken control, a confusing message, a layout shift, or an error that never reached your analytics. Replay can turn those behavioral signals into enough context to make a product decision.

    The hard part is expanding that visibility without collecting data you should not have, degrading the experience you are trying to understand, or filling storage with recordings nobody will use. The answer is not a single masking setting. You need a capture contract, a delivery architecture, a sampling model, and an operating scorecard that treat performance, fidelity, and privacy as one system.

    Set the capture contract before you expand coverage

    Replay programs often begin with a coverage question: what percentage of sessions should you record? That is the wrong first question. Start with the decision you expect the recording to change. If nobody can name that decision, more coverage will create more cost and exposure without producing more insight.

    Write a capture contract for each product surface. This is a short, reviewable specification that connects a business purpose to technical controls. It should answer:

    • What question is replay meant to answer? Examples include diagnosing failed activation, explaining an error spike, or finding friction in a conversion step.
    • Which routes, components, and user cohorts are in scope? Name them. Do not approve an undefined all-product rollout.
    • Which data is prohibited? Include form values, credentials, payment details, message content, health information, account-recovery data, and any product-specific sensitive fields that apply.
    • What consent state permits capture? The recorder should not initialize before the required state is known. Withdrawal should stop capture and prevent queued data from being sent.
    • Who can watch a replay? Define roles by purpose. Product discovery, support investigation, engineering diagnosis, and administration do not automatically require identical access.
    • How long will the data remain available? Tie retention to the stated purpose rather than keeping replay indefinitely because storage permits it.
    • What sampling rule applies? State the baseline rate, targeted cohorts, exclusions, temporary overrides, owner, and expiry condition.

    Selective capture, redaction, consent, retention, role-based access, and environment-aware sampling are separate controls. Treating one of them as a substitute for the others creates predictable gaps. Masking does not grant consent. Restricted access does not make excessive collection necessary. Short retention does not make an exposed credential harmless.

    Apply those controls as close to collection as possible. A web replay is commonly reconstructed from serialized page state, changes, and interaction events. The privacy risk therefore sits in the data leaving the browser, not only in what the player later displays. A value hidden during playback may already exist in an outbound payload or stored record.

    A useful default is to block text and input values, then allowlist only fields proven safe and necessary. Add route-level and component-level exclusions for sensitive surfaces. Use a separate, time-bounded approval for diagnostic capture that needs greater fidelity. I would reject a policy that merely says to mask personal information: the term depends on context, and engineers cannot reliably implement an undefined category.

    Test the contract against the raw system, not just the player. Seed a non-production fixture page with recognizable test values, exercise every relevant component state, inspect the browser payload, inspect the stored representation, and verify that exports and downstream tools preserve the restriction. If a prohibited test value crosses the collection boundary, the control has failed even if the replay screen obscures it.

    Consent and retention obligations vary by jurisdiction, contract, and data type. Your privacy or legal owner must approve those rules for the markets you serve. Engineering can enforce an approved policy; it cannot infer that policy from a generic replay configuration.

    Keep capture off the user’s critical path

    Scalable replay starts in the browser, where your product competes with the recorder for main-thread time, memory, and bandwidth. A backend that can ingest billions of events does not help if the recorder makes an interaction sluggish or loses the DOM changes needed to explain the problem.

    The delivery design should make page experience more important than recording completeness. Decoupled capture and delivery, adaptive batching, compression, backpressure controls, and priority handling provide the basic pattern:

    1. Capture the minimum useful representation. Filter excluded nodes and values before serialization. Avoid collecting detail that no approved use case needs.
    2. Separate recording from transport. The capture path should write to a bounded queue rather than waiting for a network request. Upload latency must not become interaction latency.
    3. Batch adaptively. Small batches can reduce delay during quiet periods, while larger compressed batches can reduce request overhead during sustained activity. The policy should respond to queue pressure and network conditions.
    4. Define backpressure behavior. When production exceeds delivery capacity, the recorder needs a documented degradation order. Preserve navigation, consent changes, errors, and the structural events required for reconstruction before lower-value detail. Never freeze the page to protect the replay.
    5. Bound long sessions. Flush incrementally, cap memory use, and make reconnection behavior explicit. A queue that grows for the life of a tab will eventually turn a delivery problem into a page-performance problem.
    6. Make partial data visible. Mark gaps, dropped segments, and incomplete uploads. A replay that silently appears complete is more dangerous than one that clearly communicates its limits.

    Backpressure deserves special attention because it forces a product decision disguised as an implementation detail. If the system cannot retain everything, what must survive? The answer should come from the capture contract. An error marker without enough surrounding state may be useless, but exhaustive cursor movement may be expendable. Rank event classes before an incident forces the recorder to choose implicitly.

    Do not validate the client only on a fast laptop and stable connection. Use representative complex pages and test replay on and off under CPU pressure, constrained networking, rapid DOM change, background-tab transitions, reconnection, and long sessions. Compare Web Vitals, long tasks, memory growth, bytes transferred, queue drops, upload completion, and playback completeness. Long sessions, traffic spikes, complex interactions, and variable networks are precisely where an apparently sound design reveals its failure modes.

    There is no universal acceptable overhead that fits every product. Set budgets relative to your production baseline and the importance of the journey. A small regression on a frequently used mobile activation path may matter more than a larger regression on an internal administration page. Segment the results by route, browser, device class, network condition, and session length so averages do not hide the users most affected.

    Sample for decisions, not for a warehouse of footage

    A single global sample rate is easy to configure and hard to defend. It spends collection capacity uniformly even though product questions are not uniformly valuable. It can also miss rare failures while overrepresenting routine sessions that nobody will watch.

    Use a portfolio of sampling modes:

    • Random baseline sampling gives you a less biased view of ordinary behavior and lets you notice problems you did not predefine.
    • Cohort sampling increases visibility for a defined population such as new users, a browser family, a release cohort, or users entering a critical journey.
    • Signal-based sampling concentrates diagnosis around errors, failed steps, rage clicks, dead clicks, abnormal exits, or other instrumented friction signals.
    • Temporary diagnostic sampling raises fidelity for a narrow incident or release window, with an owner and an automatic expiry condition.
    • Hard exclusions override every sampling mode. A high-value investigation is not permission to collect from a prohibited surface or consent state.

    Onboarding, activation, high-friction conversion flows, and paths with disproportionate revenue or trust impact are sensible places to begin because a clearer diagnosis can change a meaningful decision. Signals such as errors, rage clicks, dead clicks, scroll behavior, and stalled progress can then help you find the sessions worth examining.

    Keep one statistical distinction clear. Targeted replay is good for explaining a known problem, but it cannot tell you how prevalent that problem is. If you record sessions because they contain an error, the resulting library will naturally make errors look common. Use analytics or a random baseline to measure frequency. Use replay to understand mechanism and context.

    A disciplined investigation looks like this:

    1. Find a measurable change in a funnel, cohort, error rate, performance signal, or support pattern.
    2. Define the affected population before opening replays.
    3. Review a deliberately selected set of relevant sessions and record recurring observable behaviors, not interpretations of user intent.
    4. Turn those observations into a falsifiable product or technical hypothesis.
    5. Instrument, release, or experiment so the hypothesis can be measured outside the replay player.

    This prevents two common mistakes: browsing memorable sessions until a story feels true, and treating one vivid recording as evidence of market-wide demand. Replay is strongest when it explains a quantitative signal and leads back to a measurable change.

    Run replay with a coupled performance, privacy, and value scorecard

    Session replay is not finished when playback works. It is an operating capability with client releases, configuration changes, storage growth, access decisions, and incident risk. Give it an owner and review the system across five dimensions.

    DimensionSignals to watchDecision the signals should trigger
    User experienceWeb Vitals, long tasks, main-thread work, memory growth, and replay bytesReduce capture detail, change delivery behavior, narrow coverage, or halt a rollout when the recorder breaks its budget
    Replay fidelityQueue drops, missing segments, incomplete uploads, event integrity, and playback reconstruction errorsFix prioritization or transport before teams rely on incomplete recordings for decisions
    Platform reliabilityIngestion failures, processing delay, retrieval latency, playback-start failures, and behavior during traffic spikesAdd capacity, repair a failing stage, or adjust sampling without shifting the problem into the browser
    Privacy and governanceRedaction test failures, capture outside approved consent states, retention exceptions, and access outside approved rolesDisable affected capture, contain the data, follow the approved deletion or incident process, and repair the control before restoring it
    Decision valueInvestigations that reached a useful replay, time to diagnosis, time to resolution, and product hypotheses validated outside replayMove coverage toward high-value use cases or retire collection that produces no action

    These dimensions constrain each other. Aggressive compression may improve bandwidth while hurting reconstruction. More capture may improve fidelity while violating the page budget. Narrow access may improve governance while blocking the support engineers responsible for incident response. The job is not to maximize any single metric; it is to keep the entire system inside approved boundaries.

    Version capture configuration like production code. A seemingly harmless selector change can expose text, remove necessary context, or increase mutation volume. Test recorder and configuration releases against fixture pages containing known sensitive values and known reconstructable interactions. Keep a rollback path.

    Prepare shutdown controls before launch. You should be able to stop capture for a component, route, environment, tenant group, or the whole product without waiting for a new application release. Document who can use each control, how queued data is handled, how affected stored data is identified, and when privacy, security, support, and engineering must be involved. If collection crosses a prohibited boundary, continuing to record while the team debates ownership compounds the exposure.

    Finally, connect replay operations to the workflows that consume it. Product teams need links from behavioral cohorts to relevant sessions. Support needs controlled escalation paths. Engineering and SRE need errors, network signals, layout shifts, and performance context close to the replay timeline. Connecting interaction context to observability and delivery workflows can shorten the path from an anomaly to a testable explanation, but only if the data remains trustworthy and accessible to the right roles.

    Key takeaways

    • Approve a capture contract for each surface before approving a broader sample rate.
    • Redact or exclude sensitive data before it leaves the browser; a masked player is not enough.
    • Protect the page with decoupled delivery, bounded queues, adaptive batching, and explicit backpressure priorities.
    • Keep random sampling for prevalence and use targeted sampling to explain known signals.
    • Operate performance, fidelity, platform reliability, privacy, and decision value as a coupled scorecard.
    • Require scoped shutdown controls, retention handling, access ownership, and rollback before production expansion.

    Before you increase replay coverage, ask for two artifacts: a one-page capture contract for the next journey and a replay-on versus replay-off test under that journey’s difficult conditions. If the team cannot show what is allowed to leave the browser, how the page stays within budget, and which decision the recordings will change, the rollout is not ready to scale.

    References

  • How to Link AI Evals to Retention Without Chasing Proxies

    How to Link AI Evals to Retention Without Chasing Proxies

    Your AI activation rate is rising. More users are reaching the agent, completing setup, or trying the workflow. Yet the retention curve is flat. That usually means you know who touched the product, but not who received enough value to return.

    A higher aggregate eval score will not resolve that gap. You need to identify an AI quality signal that appears early, connect it to later behavior, and determine whether changing that signal can change retention. The result should influence onboarding, roadmap priorities, customer success, and model releases, not just add another chart to an eval dashboard.

    Start with the retention decision, not the eval dashboard

    The wrong opening question is: Which evals can the team measure? Start with: What must a user experience early enough that returning becomes the rational next action?

    That framing forces you to define retention before searching for a predictive signal. A login is rarely enough. Choose a return behavior that represents recurring value: running another workflow, completing another meaningful task, or bringing the agent into an ongoing process. Then make five decisions explicit:

    1. Define the eligible population. Decide whether you are studying newly activated users, newly activated tenants, or another clearly bounded cohort.
    2. Choose the unit of analysis. Use the user when value is individual. Use the tenant or account when adoption and renewal depend on a shared workflow.
    3. Name the retained behavior. It should represent renewed value, not passive presence.
    4. Select the retention window. Weekly and monthly cohorts answer different product questions, so do not switch between them after seeing the result.
    5. Close the observation period before the retention outcome begins. Otherwise, later behavior can leak into the feature that supposedly predicts it.

    This distinction matters when activation improves but retention does not. Activation proves that a user crossed a product milestone. It does not prove that the AI produced a trustworthy, complete, safe, and usable outcome. Your eval candidates should measure that missing experience.

    Eval familyQuestion it should answerWhen it deserves product attention
    Semantic accuracyDid the output correctly address the intended task?Incorrect results prevent completion or make the user unwilling to rely on the agent again.
    ContainmentDid the agent complete the eligible workflow without an avoidable human escalation?Escalation prevents the workflow from delivering repeatable automation.
    SafetyDid the interaction remain within the product’s acceptable risk boundaries?A regression creates unacceptable exposure, even if another engagement metric improves.
    LatencyDid the result arrive fast enough for the user’s workflow?Delay causes abandonment, repeated attempts, or a return to the previous process.
    UX frictionCould the user reach a good outcome without unnecessary setup, retries, or corrections?Users fail before they have a fair chance to experience the agent’s value.

    Shortlist three to five candidates tied to these user outcomes. A long eval inventory makes analysis look comprehensive while weakening the decision. You are not trying to find every quality problem. You are looking for an early signal that is measurable, related to meaningful retention, and alterable through a product intervention.

    Build an identity and time contract before modeling anything

    The hardest part is usually not the statistical model. It is joining AI interactions to product behavior without duplicating records, losing users, or assigning an outcome to the wrong account. Evals often live in notebooks or model-observability systems while retention events live in product analytics. A plausible-looking join can still be wrong.

    Create a data contract that covers both systems. At minimum, it should specify:

    • Stable user and tenant identifiers, including the rule used when a user belongs to more than one tenant.
    • The timestamp that determines whether an interaction belongs inside the observation period.
    • The model and workflow version associated with the interaction.
    • The conditions that make an interaction eligible for each eval.
    • The grain of the analysis table, such as one row per user-day or tenant-day.
    • The treatment of missing data, especially the difference between no eligible interaction and an evaluated failure.

    That last distinction is easy to miss. A user who never invoked an eligible workflow did not fail the accuracy eval. Combining non-use and poor quality into the same value hides whether the retention problem comes from discovery, setup, or AI performance.

    Compute daily per-user and per-tenant features rather than joining every raw interaction directly to every product event. Each feature should retain its denominator or exposure count. A pass rate without the number of eligible interactions can make sparse use look equivalent to sustained use.

    Keep the definition of each feature readable. Containment, for example, needs an explicit eligible-workflow denominator and an explicit rule for what counts as avoidable escalation. UX friction needs named events, such as a retry or correction, rather than an opaque composite score. If a product manager cannot explain how the feature changes, the team will struggle to turn it into a roadmap decision.

    Watch for many-to-many joins. One AI interaction may generate several product events, and one product session may contain several AI interactions. Joining both raw tables can multiply rows and inflate success or failure counts. Aggregate each side to the agreed grain first, then join the resulting features to the retention cohort.

    Versioning also matters. If a model or workflow changes during the observation period, an account-level average can blend materially different experiences. Preserve the version so you can distinguish a real quality improvement from a change in traffic or segment mix.

    Find a threshold that survives segment and leakage checks

    Once the dataset is reliable, begin with cohort analysis rather than a complex predictive model. Compare retention among users who reached different levels of each candidate signal. You are looking for a separation that is large enough to matter, stable enough to repeat, and reachable through product changes.

    Use this sequence:

    1. Plot weekly or monthly retention against each early eval feature.
    2. Use a driver tree to show where the feature sits between acquisition, activation, AI quality, repeat behavior, and the final retention outcome.
    3. Fit a simple logistic model that controls for plan type, segment, region, and acquisition channel.
    4. Repeat the analysis inside important segments instead of relying only on the blended population.
    5. Check whether the threshold remains directionally useful when you vary the observation definition without allowing it to overlap the outcome.

    The controls are not statistical decoration. Higher-plan customers may have better implementation support. One region may contain a different account mix. A high-intent acquisition channel may produce both better agent usage and better retention. Without those checks, customer composition can masquerade as model improvement.

    In one product context, users who crossed a specific eval threshold early showed three times higher retention than peers who did not. That is evidence that an eval can become a commercially useful leading indicator. It is not a universal benchmark. Your threshold, effect size, eligible population, and retention behavior will depend on your product.

    Do not choose the threshold merely because it creates the largest visual gap. Prefer a boundary that has enough eligible users on both sides, persists across relevant segments, and corresponds to an experience the product can influence. A dramatic ratio from a small cohort is a hypothesis, not a roadmap mandate.

    Run an explicit leakage review before presenting the result. Common forms include an eval feature calculated after the retention window begins, an account-health field that already contains renewal information, or a usage feature whose value can only rise when the user returns. Leakage can make a weak signal look uncannily predictive.

    The decision artifact should show the cohort definition, feature window, retention window, cohort sizes, effect estimate, control variables, and segment sensitivity together. If the threshold only works for a particular plan or acquisition channel, say so. A narrow, honest signal is more actionable than a broad result that disappears when the mix changes.

    Use experiments to separate a predictor from a product lever

    A predictive eval signal is not automatically causal. Sophisticated users may configure the agent better, choose easier workflows, or persist through early friction. Their higher eval scores and higher retention may share the same cause. Improving the score will not necessarily reproduce their behavior.

    Convert the signal into a testable product intervention:

    1. Choose an intervention that can move the signal during the early observation period. Depending on the failure, that could be an in-app guide, a product tour, a setup change, or a model change behind a feature flag.
    2. Keep the threshold definition fixed for the experiment. Redefining success after seeing the result turns the test into another exploratory analysis.
    3. Predefine the retained behavior, retention window, target population, and second-order guardrails.
    4. Use a minimum detectable effect calculation to determine whether the experiment can answer the question with the available population.
    5. Run an A/B test where randomization is practical. Measure whether the intervention moves the eval signal and whether that movement is followed by the intended retention lift.
    6. Inspect results by the same segments used in the observational analysis. A blended win can hide a regression for a strategically important group.

    This creates a necessary chain of evidence: the intervention changed the early experience, the early eval feature moved, and the retention outcome moved in the expected direction. If retention improves without movement in the eval, your intervention may work through another mechanism. If the eval improves without retention, the signal is not yet a proven growth lever.

    Treat safety differently from an ordinary optimization metric. A retention increase cannot compensate for an unacceptable safety regression. Use risk scoring to gate exposure, keep model changes behind feature flags until the required evals pass, and monitor anomalies in both the score and its eligible volume. A stable percentage on a collapsing sample is not stability.

    Track support tickets, NPS, and Net Recurring Revenue alongside the primary retention result. These measures operate on different timelines, but they help catch proxy optimization. An intervention that pushes users across an eval threshold while increasing support burden or degrading customer sentiment has not produced a clean product win.

    Separate the user-level and release-level uses of the signal. A user-level signal can trigger onboarding or customer-success help when a new account has not reached the value threshold. A release-level eval can prevent a model change from expanding when quality falls. Combining both into one vague health score makes ownership and response unclear.

    Put the winning signal into the product operating system

    The analysis matters only when it changes what happens next. Give the signal a definition, an owner, an intervention, and a response to regression.

    • For onboarding, guide new users toward the workflow conditions associated with crossing the threshold. Do not merely show them where the AI button is.
    • For customer success, add the signal to a health score only when the team has a specific action to take. A warning without a playbook creates dashboard noise.
    • For roadmap planning, require proposed work to identify which eval feature it should move, why that feature connects to retention, and how the effect will be tested.
    • For model releases, keep exposure controlled with feature flags until the relevant eval improves without violating safety or experience guardrails.
    • For monitoring, use anomaly detection on the eval value, eligible interaction volume, and important segments so a blended average does not conceal a regression.

    This operating model also clarifies ownership. Product owns the intervention and decision. Data science owns the validity of the feature and analysis. Engineering owns reliable instrumentation and release controls. Customer success owns the response when an account-level signal indicates missed value. Those responsibilities can be distributed differently in your organization, but none should be implicit.

    Key takeaways

    • Define the retained behavior, population, unit, and time window before selecting an eval.
    • Shortlist three to five eval candidates that describe real user value: accuracy, containment, safety, latency, or UX friction.
    • Aggregate reliable daily features with stable user and tenant identifiers before joining them to product cohorts.
    • Use cohort analysis, driver trees, and simple controlled models to find a predictive threshold, then check sample size, segment mix, and label leakage.
    • Use an A/B test to learn whether a product intervention can move both the eval signal and retention.
    • Operationalize a validated signal through onboarding, customer success, release gates, feature flags, and anomaly detection.

    At your next product review, bring a short decision sheet with the retained behavior, observation window, no more than five candidate evals, join keys, and the first intervention you can test. If the team cannot fill in those fields, fix the analytics contract first. If it can, run the smallest credible experiment and let retained behavior, not a prettier eval dashboard, decide the roadmap.

    References

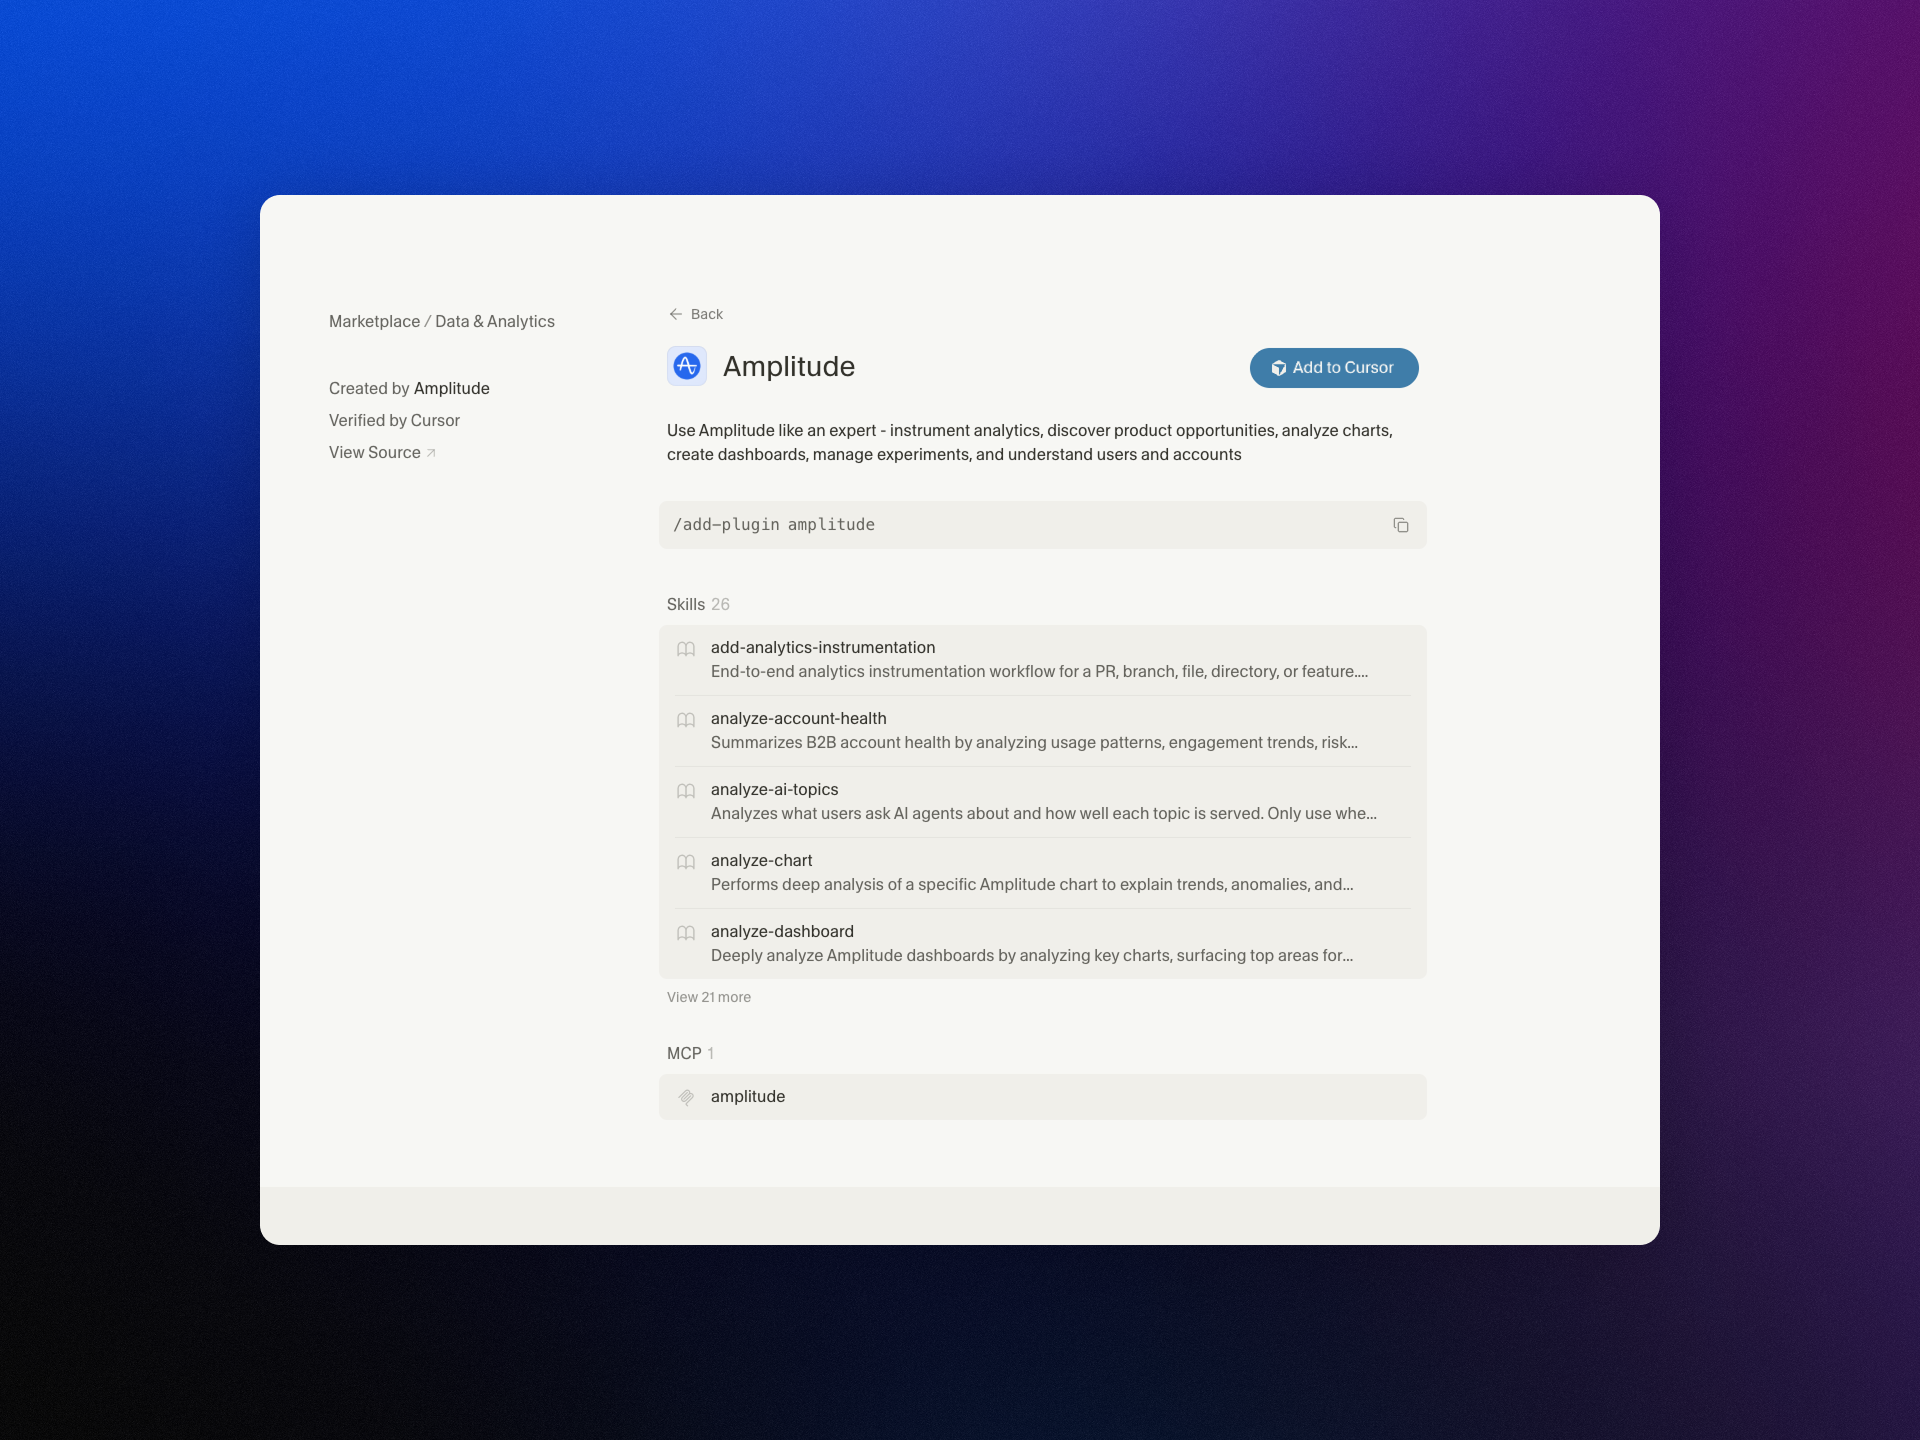
  • Amplitude MCP: Evidence-Grounded AI Workflows for Product Teams

    Amplitude MCP: Evidence-Grounded AI Workflows for Product Teams

    An AI assistant can produce a convincing roadmap recommendation or code patch before you have established what users actually did. That speed feels productive until a confident answer turns an instrumentation gap, a rare edge case, or a coincidental sequence into a product decision.

    Amplitude MCP is most useful when it reverses that order. The assistant retrieves behavioral evidence first, labels what is observed versus inferred, proposes a bounded action, and defines how the result will be verified. You still make the decision and own the release, but you spend less time moving context between analytics, product documents, Session Replay, and the development environment.

    Key takeaways

    • Treat Amplitude MCP as an evidence-retrieval layer, not an automated decision-maker. Access to analytics does not make every conclusion valid.
    • Require every response to separate observed behavior, inferred explanations, proposed actions, and verified outcomes.
    • Use aggregate analytics to establish prevalence and affected segments, Session Replay to understand the journey, and code-level tests to validate a technical explanation.
    • End product workflows with a decision brief and engineering workflows with a reproducible test, a controlled release plan, and post-release behavioral verification.
    • Begin with a narrow, high-value workflow. Apply least-privilege access, redact sensitive data, and evaluate retrieval accuracy, analytical discipline, latency, and business usefulness before expanding.

    Create an evidence contract before asking for a recommendation

    An MCP connection can make evidence accessible, but it cannot decide whether your event taxonomy is reliable, whether a cohort is appropriate, or whether a pattern is causal. Amplitude MCP can let an assistant request behavioral context such as funnels, cohorts, segments, and user journeys as needed. Your workflow still has to constrain what is retrieved and how it may be interpreted.

    The practical control is an evidence contract: a short specification for the question, the permitted data, the expected output, and the point at which the assistant must stop. Write it before asking for a recommendation. Otherwise, the assistant can silently change the population, comparison, or definition while producing an answer that sounds coherent.

    • Decision: State the exact choice the analysis is meant to inform. “Improve onboarding” is a theme; “decide which onboarding step needs further investigation” is a decision.
    • Population: Name the relevant segment, account type, lifecycle stage, product surface, or release exposure. Do not let the assistant substitute all users because that query is easier.
    • Behavior definition: Specify the events or funnel that represent the outcome. If activation, retention, or failure has no agreed event definition, resolve that ambiguity before interpreting results.
    • Comparison: Define the cohort, release, segment, or other baseline against which a difference should be assessed.
    • Permitted evidence: List the analytics views, event paths, Session Replays, error details, and code context the assistant may use.
    • Required traceability: Make the assistant identify the query, event definition, segment, and replay behind each material observation.
    • Abstention rule: Require the assistant to say when missing instrumentation, insufficient data, or conflicting evidence prevents a conclusion.

    A reusable prompt can be direct: “Analyze [outcome] for [segment] using [funnel, cohort, or event path]. Use [comparison] as the baseline. For every conclusion, identify the supporting query or replay. Return observed facts, data limitations, hypotheses, next retrievals, recommended action, and a verification plan. If the evidence is insufficient, state what is missing instead of filling the gap.”

    The labels matter. Without them, a behavioral sequence can become a supposed root cause within one paragraph. Use the following distinction in product investigations, incident work, and roadmap analysis:

    LayerWhat belongs hereWhat must support it
    ObservedAn event pattern, funnel difference, cohort trend, replayed interaction, error, or test resultA traceable query, event timeline, replay, log, or test output
    InferredA plausible explanation for the observed behaviorSupporting and conflicting evidence, plus assumptions that remain unverified
    ProposedAn instrumentation change, discovery step, experiment, code change, or rollout actionA stated rationale, expected effect, risk, and owner
    VerifiedA conclusion that the intervention produced the intended result without an unacceptable regressionPost-change tests and behavioral evidence using definitions consistent with the original investigation

    This structure does more than improve prompt quality. It makes reviews faster. A product manager can challenge the population, an analyst can challenge the event definition, and an engineer can challenge the technical hypothesis without reopening the entire conversation.

    Turn product questions into bounded analytics tasks

    Broad questions invite broad stories. “Why is activation down?” asks the assistant to choose the definition, locate a pattern, infer a cause, and recommend a solution in one leap. Break that work into retrieval, interpretation, and decision stages instead.

    Find an activation blocker without inventing causality

    Suppose you need to determine which onboarding step deserves attention for an SMB segment. Behavioral analytics can locate where journeys diverge, while Session Replay can show what happened around that point. Neither alone proves why the behavior occurred.

    1. Define activation. Name the event or event sequence that represents the outcome. If stakeholders use different definitions, surface that disagreement rather than averaging it away.
    2. Fix the population and comparison. Specify the SMB segment and the cohort, release, or successful journey against which it should be compared.
    3. Retrieve the funnel or event path. Ask for the event definitions as well as the result. An unexplained event name is not enough to support a decision.
    4. Locate the observed divergence. Identify where completion or progression differs. Call it a divergence, not a cause or even a blocker yet.
    5. Inspect contrasting journeys. Review unsuccessful and successful Session Replays around the same step. Capture UI state, preceding actions, environment details, errors, and unexpected loops.
    6. Generate competing hypotheses. Include product friction, technical failure, user intent, and instrumentation error where each is plausible. Ask what evidence would weaken each explanation.
    7. Choose the next action that matches the evidence. That may be additional instrumentation, customer discovery, a controlled experiment, a targeted technical investigation, or a product change. The assistant should not default to shipping.
    8. Write the decision record. Preserve the query, segment, replay references, observed facts, unresolved uncertainty, chosen action, and verification signal.

    Do not let the assistant jump from “fewer users completed this step” to “the copy is confusing.” The first statement may be observable. The second is a hypothesis that needs corroboration. This distinction is the difference between faster analysis and faster rationalization.

    Use behavioral context to sharpen roadmap decisions

    Behavioral evidence can show whether a problem appears in real journeys, which segments encounter it, and how the surrounding path differs. It does not determine strategic importance, implementation cost, contractual commitments, regulatory exposure, or the opportunity cost of displacing other work. Those remain product leadership inputs.

    Ask the assistant to produce an opportunity brief rather than a priority score. The brief should contain:

    • The outcome and user segment under consideration
    • The observed behavior and the exact analytics definition behind it
    • The prevalence and journey context the available evidence can support, without pretending that frequency equals severity
    • Successful paths or unaffected segments that provide counterevidence
    • Known data-quality limitations
    • Competing explanations and what would distinguish them
    • The smallest useful discovery, instrumentation, experiment, or delivery step
    • The signal that would cause you to continue, revise, or stop

    This format is particularly useful for activation and retention work because it prevents a familiar category error: an analytics pattern describes behavior, while a roadmap decision combines that behavior with strategy, feasibility, risk, and judgment. Amplitude MCP can improve the behavioral part of the decision without pretending to own the whole decision.

    Close the engineering loop from customer signal to verified fix

    Code generation is only the middle of a debugging workflow. The more important sequence is evidence, reproduction, hypothesis, failing test, bounded change, controlled release, and verification. Amplitude MCP helps connect the customer side of that sequence to Claude or Cursor, but a plausible diff is not a completed investigation.

    From a customer report to a reproducible failure

    A support ticket usually contains a symptom. Turn it into an evidence packet before asking the coding assistant for a fix.

    1. Establish impact. Use behavioral analytics to find affected segments, related anomalies, and comparable successful journeys. This tells you whether you are investigating an isolated path or a broader degradation.
    2. Reconstruct the experience. Use Session Replay to capture the sequence of actions, UI state, environment, and the moment the behavior diverged. Preserve timestamps for relevant console errors or API failures.
    3. State expected versus actual behavior. Do not make the coding assistant infer the product requirement from the failure.
    4. Provide constraints. Include known dependencies, release exposure, rate limits, feature-flag state, and any code areas that must not change.
    5. Ask for hypotheses before a patch. Require a list of candidate causes, supporting evidence, contradictory evidence, and missing instrumentation.
    6. Request the smallest failing test. Whenever feasible, reproduce the failure in a test before accepting a code change. If urgent containment is necessary, record it separately from the durable fix.
    7. Validate locally and through CI/CD. A generated test or patch still needs human review and the normal engineering checks.
    8. Release behind a feature flag where appropriate. Limit exposure while verifying the behavior in production.
    9. Verify with the original signals. Re-run the relevant analytics, inspect post-change replays, and monitor related behavioral and performance indicators before increasing exposure.

    This workflow can turn a replayed customer problem into reproduction steps, a root-cause hypothesis, a minimal failing test, and a controlled verification plan. The human owner still decides whether the evidence is sufficient, whether the patch is safe, and whether the rollout should continue.

    A useful debugging prompt is: “Reconstruct the observed sequence from this replay and event timeline. Separate facts from suspected causes. Identify missing instrumentation. Propose the smallest failing test and the narrowest relevant patch surface. State what post-release evidence would confirm or falsify the fix.”

    A passing test proves that the code behaves under the conditions represented by that test. It does not prove that the affected customer journey is repaired. That is why the workflow returns to behavioral evidence after deployment.

    From a code symptom back to customer impact

    Sometimes the investigation begins with a flaky test, a suspicious diff, or a performance regression. In that direction, the assistant first maps possible failure modes and critical code paths. Amplitude then helps answer whether real users reach those paths, under which conditions, and with what observable consequences.

    1. Give the assistant the test failure, diff, or performance symptom and ask it to enumerate the affected code paths.
    2. Translate those paths into observable events, screens, releases, or journey conditions. If no observable signal exists, add instrumentation before making a product-impact claim.
    3. Retrieve matching behavioral patterns and inspect replays that support and contradict the suspected failure.
    4. Separate technical correctness from operational priority. A real defect may have limited observed reach; a common path may still be functioning correctly.
    5. Implement and test the narrowest justified change.
    6. After release, monitor the original journey, relevant errors, and performance measures such as Web Vitals before ramping the flag.

    Frequency must not become the only severity test. Security, privacy, data-integrity, and irreversible-loss risks can demand action even when behavioral analytics shows few affected sessions. Use analytics to understand exposure, not to override the appropriate risk process.

    Scale only after retrieval and governance earn trust

    The strongest rollout begins with one recurring question, not unrestricted access to every project and replay. Activation blockers and bug triage are good candidates because the input, evidence, decision, and verification artifacts can all be made explicit. Start with a high-value, lower-risk dataset and expand only after the workflow performs reliably.

    Make access narrower than the assistant’s capability

    Session Replay and event data can contain sensitive customer context. An MCP connection does not remove the obligations attached to that data. Apply the same access rules inside the AI workflow that apply in the analytics product, then reduce exposure further where the task does not require it.

    • Begin with read-only retrieval for the selected workflow.
    • Limit access to the relevant projects, datasets, and replay permissions supported by your access model.
    • Redact sensitive fields before the data reaches either replay or the assistant.
    • Send the minimum context necessary for the task. Prefer event identifiers, stack traces, test cases, and bounded timelines over raw personally identifiable information.
    • Keep analytics retrieval, code modification, and deployment authority separate. Successful retrieval is not a reason to grant release permissions.
    • Preserve the query and evidence references behind material decisions so a reviewer can reconstruct what the assistant saw.
    • Treat a replay link as governed customer data, not as a generic attachment that can be copied into any conversation.

    These controls reflect a practical privacy-by-design rule: include only the information needed to reach the fix and favor structured technical artifacts over raw PII. If the workflow cannot answer a question within those boundaries, the correct result may be escalation to an authorized person rather than broader automated access.

    Evaluate the workflow, not just the prose

    A polished response is a weak success criterion. Build an evaluation set from representative work and include cases where the answer is easy, ambiguous, unsupported by current instrumentation, and blocked by permissions. The assistant should succeed by reaching the right conclusion or by refusing to overstate what the evidence supports.

    • Retrieval correctness: Did it use the intended project, event definitions, segment, comparison, and available time scope?
    • Traceability: Can a reviewer follow every material observation back to a query, replay, error, or test?
    • Analytical discipline: Did it distinguish behavioral association from cause and identify counterevidence?
    • Action quality: Is the proposed next step bounded, testable, and proportionate to the evidence?
    • Abstention quality: Did it stop when data was missing, permissions were insufficient, or the available evidence conflicted?
    • Latency: Did the workflow reduce time spent finding and transferring context without adding review overhead elsewhere?
    • Business usefulness: Did the evidence improve the decision, reproduction, or verification outcome rather than merely shorten the response?
    • Governance: Did retrieval stay within approved access and data-handling boundaries?

    Classify failures by layer. A wrong segment is a retrieval failure. An unsupported causal claim is an interpretation failure. An oversized code rewrite is an action failure. Exposure of unnecessary customer data is a governance failure. That classification tells you whether to change permissions, analytics definitions, prompts, review rules, or the underlying product instrumentation.

    Use a narrow adoption sequence

    1. Choose one repeated workflow with a visible evidence trail, such as activation analysis or production bug triage.
    2. Record how the workflow operates without MCP, including where context is lost and which handoffs cause rework.
    3. Define the evidence contract, approved access, expected artifact, and human decision gate.
    4. Run representative cases and record retrieval, interpretation, action, and governance failures.
    5. Standardize the prompts, evidence packet, and review checklist only after the failure patterns are understood.
    6. Measure time-to-insight, decision usefulness, and engineering outcomes without assuming that faster responses mean better decisions.
    7. Expand to retention analysis, roadmap shaping, or experiment generation only when the narrow workflow remains traceable and safe.

    For incident and engineering use cases, preserve root causes and guardrails as docs-as-code so the next investigation can retrieve known failure patterns instead of rediscovering them. Watch change lead time and deployment frequency alongside stability; speed that produces more regressions is not an improvement.

    Start with one decision your team faces repeatedly. Define what the assistant may observe, how it must label inference, who approves the action, and what evidence will verify the result. If it cannot show that chain, it is not ready to influence the decision. If it can, Amplitude MCP becomes more than a convenient connector: it becomes part of a disciplined evidence loop between product behavior and execution.

    References

  • Taste vs. Evidence in the AI Era: What Product Leaders Must Invest In Now

    Taste vs. Evidence in the AI Era: What Product Leaders Must Invest In Now

    I just finished listening to "Taste – All Things Product Podcast with Teresa Torres & Petra Wille," and as a product leader shipping AI-powered capabilities at HighLevel, Inc., I wanted to pressure-test the sudden obsession with "taste."

    If you're curious, you can listen to this episode on Spotify or Apple Podcasts.

    The core question landed perfectly for our moment: Is "taste" the must-have skill of the AI era — or just the latest tech buzzword in a world where AI is eating through design, delivery, and discovery?

    Teresa pushes back hard, highlighting how slippery the term can be. "It's just this month's flavor of founder mode." She points out that "taste" is rarely defined, can't be easily taught, and too often becomes shorthand for "my preference trumps yours." Just as importantly, "It's not about your taste. It's about your customer's taste."

    Petra adds needed nuance from years in the craft: pattern-recognition is real, and some people do develop sharper product sense over time. As she put it, "I am a strong believer that you develop product sense and taste over time. It's never finished."

    Both threads lead back to familiar roots in product: product sense, founder mode, and the enduring myth of the lone visionary. They even grapple with the big question on everyone’s mind—Will AI Eat Taste Too?—and where that leaves product teams navigating GenAI, LLMs for product managers, and evolving product strategy.

    Here’s my take. "Taste" can be useful as a personal north star, but it is not a decision system. In my teams, we bias toward evidence: continuous discovery, customer interviews, discovery synthesis with opportunity solution trees, and tight collaboration in product trios. Opinion can start the conversation, but evidence should end it.

    Practically, that means investing in the skills that compound: Discovery skills — understanding customers, matching solutions to real needs. Human-to-human interaction skills. Learning to collaborate with AI effectively. Critical thinking and judgment grounded in evidence.

    On AI collaboration specifically, we treat GenAI as a force multiplier, not a decider. We prototype with AI to explore breadth, then narrow with qualitative and quantitative signals, ablation-style experiments, and clear success criteria. The bar I hold myself to is simple: taste without evidence is just opinion.

    Three lines I underlined from the conversation:

    "It's just this month's flavor of founder mode." — Teresa Torres

    "It's not about your taste. It's about your customer's taste." — Teresa Torres

    "I am a strong believer that you develop product sense and taste over time. It's never finished." — Petra Wille

    If you want to go deeper, these references are helpful for sharpening judgment without falling into the "great man" theory trap.

    Follow Teresa Torres: https://ProductTalk.org

    Follow Petra Wille: https://Petra-Wille.com

    Founder mode

    Marty Cagan: Founder-Style Leadership

    Vercel/v0 CEO Guillermo Rauch on building taste: from Lenny Rachitsky’s Linkedin post

    Continuous discovery (Read Teresa’s Everyone Can Do Continuous Discovery—Even You! Here’s How

    The "great man" theory

    Steve Jobs and the myth of the lone product visionary

    Have thoughts on this episode? Leave a comment below and share how your team balances product sense with evidence in the age of AI.


    Inspired by this post on Product Talk.


    Book a consult png image
  • 5 Proven Agent Skills I Use to Automate Weekly Product Reviews with Claude, Cursor, and Codex

    5 Proven Agent Skills I Use to Automate Weekly Product Reviews with Claude, Cursor, and Codex

    Weekly product reviews are where strategy meets execution, and over the past year I’ve turned them into a high-signal, low-friction ritual by leaning on agentic AI. As VP of Product Management at HighLevel, Inc., I’ve standardized a set of agent skills that compress preparation time, surface the right insights, and keep PMs, engineers, and designers focused on decisions—not document wrangling.

    "Learn how our teams use agent skills with claude, cursor and codex to run product reviews as PMs, engineers, and designers. Here are 5 killer use cases for builder."

    Below, I walk through the five skills I rely on most in our weekly cadence—each one mapped to a clear product management outcome. They’re simple to set up, easy to govern, and aligned with core practices like continuous discovery, product roadmapping and sprint planning, and eval-driven development.

    Skill 1 — Backlog triage with signal extraction: I point an agent at fresh tickets, customer notes, and experiment results to cluster themes, tag impact, and flag regressions. Using a retrieval-first pipeline and Agent Analytics, the assistant ranks items by value, effort, and risk so our meeting starts with a prioritized, explainable shortlist instead of a raw queue.

    Skill 2 — PRD and spec synthesizer: Ahead of the review, an agent drafts a one-page PRD update from design diffs, git history, and decision logs. With Claude Code and Cursor, it highlights interface changes, acceptance criteria, and open questions, linking back to sources. The result is a crisp, auditable brief that keeps product trios aligned without re-litigating context.

    Skill 3 — Experiment and metrics analyzer: An analytics agent pulls A/B testing readouts, checks minimum detectable effect assumptions, and annotates anomalies. It turns raw telemetry into a narrative: what moved, by how much, and whether we trust it. This makes our discussion about tradeoffs, not spreadsheets, and speeds commitments on next steps.

    Skill 4 — Voice-of-customer synthesizer: The assistant clusters interviews, support threads, and NPS verbatims into jobs-to-be-done and pain themes. It proposes opportunity solution tree updates and calls out places where our roadmap diverges from customer signal. That keeps continuous discovery alive in the room—even when time is tight.

    Skill 5 — Roadmap and sprint planning co-pilot: After decisions, an agent converts outcomes into scoped backlog items, engineering tasks, and stakeholder updates. It drafts sprint goals, flags dependency risks, and aligns work to objectives. Because it’s grounded in the meeting record, it preserves intent while removing ambiguity.

    Under the hood, prompt engineering patterns and guardrails keep these workflows predictable: a retrieval-first pipeline for context, eval-driven development for quality checks, and role-specific prompts for PMs, engineers, and designers. With Claude Code I generate structured diffs and test scaffolds; with Cursor I accelerate code-review summaries; and with codex I bootstrap utility scripts that keep the loop tight between insights and implementation.

    The payoff is tangible: higher decision velocity, fewer meetings to “re-clarify,” and clearer accountability across the product organization. Just as important, governance and privacy-by-design are built in—every agent logs rationale, cites sources, and respects data boundaries—so leaders can scale AI workflows confidently.

    If you’re looking to level up your product reviews, start with these five skills, measure impact with Agent Analytics, and iterate. Small automations compound quickly, and the more consistently you run them, the more your team’s attention shifts from preparing content to making better product decisions.


    Inspired by this post on Amplitude – Perspectives.


    Book a consult png image
  • Mastering Product Marketing with Amplitude Analytics: Proven Playbooks for Sustainable Growth

    Mastering Product Marketing with Amplitude Analytics: Proven Playbooks for Sustainable Growth

    I’m continually refining how we use analytics to elevate product marketing, and this collection brings together my most effective playbooks for driving measurable growth with Amplitude Analytics. If you’re focused on product-led growth, you’ll find pragmatic guidance on translating behavioral analytics into sharper positioning, stronger activation, and durable retention.

    In my day-to-day work, I connect product strategy with go-to-market strategy by grounding every narrative in real user behavior. That means using event data to validate our value proposition, mapping journeys to uncover friction, and aligning product positioning with the moments that actually matter in-app. The outcome is a marketing engine that mirrors how customers discover, adopt, and expand within the product.

    Activation and retention are where outcomes are won or lost. I detail how to set leading indicators for user activation, instrument key behaviors, and run retention analysis that distinguishes healthy engagement from noisy usage. You’ll see how I turn cohort insights into precise messaging, targeted onboarding, and experiments that compound over time.

    Cross-functional execution is essential, so I share ways to operationalize a unified analytics platform across product, marketing, and customer success. With shared metrics, product trios can move faster from product discovery to launch, and marketing can scale campaigns that reflect what’s truly driving adoption. This tight loop reduces guesswork and increases our hit rate on both features and narratives.

    If you’re building a modern product marketing function, these essays and guides will help you move from intuition-led storytelling to evidence-backed strategy. Dive in to learn how I connect behavioral analytics to positioning, packaging, and roadmap choices—so every campaign and release ladders up to meaningful customer outcomes and sustainable growth.


    Inspired by this post on Amplitude – Perspectives.


    Book a consult png image
  • Master Opportunity Mapping with Continuous Discovery Habits — Join the May 2026 Book Club

    Master Opportunity Mapping with Continuous Discovery Habits — Join the May 2026 Book Club

    Five years in, Continuous Discovery Habits continues to be one of the most practical frameworks I use to align empowered product teams, sharpen product strategy, and convert customer interviews into outcomes. To celebrate its impact, I’m hosting a community read-along and inviting you to dig in with me this May.

    Each month, I’m releasing an in-depth reading guide to make learning stick. You’ll find the chapters we’ll be reading, a preview of the essential concepts, short videos to help you spread the ideas across your organization, individual and team discussion prompts, team exercises to put the concepts into practice, and additional reading if you want to go deeper. My goal is simple: help you turn product discovery into a steady habit, not a once-a-quarter activity.

    We’ll discuss each month’s reading in the comments, and we’ll gather quarterly on a live call to compare notes and share what’s working. Joining late is absolutely fine—I monitor the conversation throughout the year. Start with the current month or rewind to January; you can ask for help, share wins and roadblocks, and connect with other readers anytime.

    If you want to participate, grab a copy of the book (or dust off your old one), share the "Spread the Love" videos with your team, block focused time for the exercises, and register for the community sessions. Let’s do this together.

    This Month’s Reading

    Chapter: Chapter 6: Mapping the Opportunity Space

    Estimated reading time: ~23 minutes

    This month’s chapter will introduce you to why opportunity mapping is critical for structuring the ill-structured problem of reaching your desired outcome; how to move from overwhelming opportunity backlogs to well-structured opportunity spaces; the power of tree structures for depicting parent-child and sibling relationships between opportunities; how to identify distinct branches in your opportunity space using key moments in time; common anti-patterns to avoid when building your first opportunity solution tree; and why structure "gets done, undone, and redone" as you continue to learn.

    Need a copy? Grab the book.

    Share the Love with Friends and Colleagues

    We learn best in community. Use these short videos to spread the core concepts from this chapter—then invite your team to join the book club with you.

    The need for opportunity mapping – You will never fully satisfy your customers' desires

    Understanding the structure of an opportunity solution tree – Depicting two types of relationships

    Turn big intractable problems into smaller, more solvable problems – The power of decomposition

    How to map an opportunity space – Getting started with opportunity solution trees

    A well-structured opportunity space has distinct branches – Identify key moments in time

    Reflect & Discuss What You Read

    Reflection turns reading into capability. This chapter asks us to shift from reacting to every request to deliberately structuring the opportunity space. If you’ve ever felt overwhelmed by a never-ending backlog or pressure to ship output over outcomes, this is where the fog starts to lift. As you read, focus on how your team currently organizes (or doesn’t organize) what you hear from customers.

    Individual Reflection

    1) Think about your current product backlog or opportunity list. Is it a flat list, or do you have some structure to it? If you were to group similar opportunities together, what patterns would emerge?

    2) When was the last time you heard a customer need and immediately jumped to a solution without exploring whether there were related opportunities? What would change if you took the time to map how that opportunity connects to others?

    3) Review the anti-patterns from the chapter (opportunities framed from your company's perspective, vertical opportunities, opportunities with multiple parents, etc.). Which of these do you recognize in how your team currently talks about opportunities?

    Team Discussion

    1) As a team, pick a top-level opportunity you're currently working on. Try breaking it down into sub-opportunities together. Where do you struggle? Where do you disagree about how to frame or group opportunities? What does that tell you about gaps in your shared understanding?

    2) Look at your experience map (from Chapter 4) and identify 3-5 distinct moments in time during your customer's experience. Could these become the top-level branches of your opportunity solution tree? Where do you see overlap, and where are there clear distinctions?

    3) Discuss the quote from Barbara Tversky: "Structure gets done, undone, and redone." How does your team currently respond when you discover new information that changes how you understand the opportunity space? Do you treat your opportunity map as fixed or as something that evolves?

    Put It Into Practice

    Reading is step one; building your first opportunity solution tree is where the real learning happens. The exercises below are exactly how I coach product trios to transform ambiguous problems into aligned action.

    Exercise: Build Your First Opportunity Solution Tree

    Time: 60 minutes. Do this: With your product trio.

    Start by reviewing your interview snapshots from the past few weeks. For each opportunity you captured, ask the three questions from the chapter:

    Is this opportunity framed as a customer need, pain point, or desire (not a solution)?

    Is this opportunity unique to one customer, or have we seen it in more than one interview?

    If we address this opportunity, will it drive our desired outcome?

    Then, using your experience map, identify 3-5 distinct moments in time to serve as your top-level opportunities. Group the opportunities from your interviews under these top-level branches.

    Look for opportunities to add structure to each branch. Group similar opportunities together and identify a parent opportunity. Look for vertical stacks (one parent, one child) and fill in missing siblings. Reframe opportunities that are too broad or that could live in multiple branches.

    Don’t aim for perfection. Get something on paper (or a digital canvas) and iterate the tree with every new interview.

    Exercise: Practice Framing Opportunities from Your Customer’s Perspective

    Time: 30-45 minutes. Do this: With your product trio.

    Take 10-15 opportunities from your current backlog or list. For each one, ask: "Can I imagine a customer saying this?" If the answer is no, reframe it from your customer’s perspective. For example:

    "Increase subscription conversions" becomes "I want to know if this product is worth paying for"

    "Reduce support tickets" becomes "I can't figure out how to do X"

    "Improve onboarding completion" becomes "I'm not sure what to do next"

    This exercise helps you spot business-centric opportunities disguised as customer opportunities. It also trains your team to listen for opportunities in interviews that are framed from the customer’s point of view.

    Go Deeper: Additional Reading

    If you prefer an audio summary of this month’s reading, including the book chapters and the following resources, I’ve included an audio version for paid subscribers at the bottom of this post.

    Related In-Depth Guides

    Opportunity Solution Trees: Visualize Your Discovery to Stay Aligned and Drive Outcomes

    Customer Interviews: Uncover Hidden Insights from Every Conversation

    Supplementary Reading

    Prioritize Opportunities, Not Solutions

    Product in Practice: Opportunity Mapping at Grailed

    Product in Practice: Opportunity Mapping at trivago

    7 Key Benefits of Using Opportunity Solution Trees

    Getting Started with Opportunity Solution Trees at SuperAwesome

    Bringing Order to Chaos: Using Opportunity Solution Trees in Everyday Life

    Other Voices

    Why Groups Struggle to Solve Problems Together by Al Pittampalli

    More PM Problem Areas by Marty Cagan

    Five Superpowers of Diagrams by Abby Covert

    Critical Thinking is Product Management by This Is Product Management

    Our Live Discussion Schedule

    Our live discussion sessions are for paid subscribers. Sessions are not recorded. Invitations will go out to Supporting Members and CDH Members two weeks before the scheduled event. But reserve the time on your calendar now.

    Tuesday, June 16, 2026: 9am-10am PDT

    Thursday, September 17, 2026: 9am-10am PDT

    Wednesday, December 16, 2026: 9am-10am PST

    Audio Summary

    This summary was produced by NotebookLM. The sources supplied were the book chapters as well as all of the additional reading.


    Inspired by this post on Product Talk.


    Book a consult png image
  • Supercharge Claude and Cursor with Amplitude Plug and Play: Your AI Analytics Expert in One Install

    Supercharge Claude and Cursor with Amplitude Plug and Play: Your AI Analytics Expert in One Install

    I’m excited to share that we’ve brought Amplitude Plug and Play to the Claude and Cursor marketplaces—a lightweight way to infuse your everyday prompts with serious product analytics context and speed.

    "Learn more about our new AI plugin, the easiest way to turn your favorite AI client into an analytics expert with a single-install."

    For years, I’ve watched teams lose momentum hopping between dashboards, docs, and spreadsheets just to answer simple questions like “What changed in activation last week?” or “Which cohort is driving retention?” With Amplitude analytics and behavioral analytics at the core, Amplitude Plug and Play collapses that friction by bringing the answers to where you already think and build—inside Claude and Cursor.

    In practice, this means I can ask natural-language questions such as “Show me the funnel from signup to activation by region,” “Compare retention week over week for new users from our latest release,” or “Summarize our last A/B testing results on onboarding” and get structured, context-aware responses. The goal is to keep me in flow while still honoring the rigor of a unified analytics platform.

    What I love most is how this elevates both discovery and delivery. Product managers can accelerate continuous discovery by querying cohorts, drivers, and anomalies mid-conversation. Engineers working in Cursor or with Claude Code can validate event definitions, sanity-check metrics, and spot regressions without leaving their IDE. The result is tighter feedback loops and better decision quality.

    Just as importantly, the experience is designed for clarity and consistency. When I ask about activation, I expect the same canonical definition every time. When I explore a retention analysis, I want clear assumptions and transparent logic. By anchoring responses to well-defined metrics and event taxonomies, the plugin helps reinforce good data governance while keeping the interaction fast and conversational.

    Getting started takes only a few minutes. Open the Claude or Cursor marketplace, search for Amplitude Plug and Play, complete the single-install flow, and connect to your Amplitude analytics workspace. From there, start prompting as you normally would—only now your AI client can reason with product context.

    This launch is part of how I see gen ai reshaping AI workflows for product teams: less context switching, more signal per prompt, and a shared, accessible understanding of what’s really moving the business. If you’re ready to turn your AI assistant into a trusted partner for product insight, Amplitude Plug and Play is a powerful next step.


    Inspired by this post on Amplitude – Best Practices.


    Book a consult png image