Tag: retention analysis

  • How to Link AI Evals to Retention Without Chasing Proxies

    How to Link AI Evals to Retention Without Chasing Proxies

    Your AI activation rate is rising. More users are reaching the agent, completing setup, or trying the workflow. Yet the retention curve is flat. That usually means you know who touched the product, but not who received enough value to return.

    A higher aggregate eval score will not resolve that gap. You need to identify an AI quality signal that appears early, connect it to later behavior, and determine whether changing that signal can change retention. The result should influence onboarding, roadmap priorities, customer success, and model releases, not just add another chart to an eval dashboard.

    Start with the retention decision, not the eval dashboard

    The wrong opening question is: Which evals can the team measure? Start with: What must a user experience early enough that returning becomes the rational next action?

    That framing forces you to define retention before searching for a predictive signal. A login is rarely enough. Choose a return behavior that represents recurring value: running another workflow, completing another meaningful task, or bringing the agent into an ongoing process. Then make five decisions explicit:

    1. Define the eligible population. Decide whether you are studying newly activated users, newly activated tenants, or another clearly bounded cohort.
    2. Choose the unit of analysis. Use the user when value is individual. Use the tenant or account when adoption and renewal depend on a shared workflow.
    3. Name the retained behavior. It should represent renewed value, not passive presence.
    4. Select the retention window. Weekly and monthly cohorts answer different product questions, so do not switch between them after seeing the result.
    5. Close the observation period before the retention outcome begins. Otherwise, later behavior can leak into the feature that supposedly predicts it.

    This distinction matters when activation improves but retention does not. Activation proves that a user crossed a product milestone. It does not prove that the AI produced a trustworthy, complete, safe, and usable outcome. Your eval candidates should measure that missing experience.

    Eval familyQuestion it should answerWhen it deserves product attention
    Semantic accuracyDid the output correctly address the intended task?Incorrect results prevent completion or make the user unwilling to rely on the agent again.
    ContainmentDid the agent complete the eligible workflow without an avoidable human escalation?Escalation prevents the workflow from delivering repeatable automation.
    SafetyDid the interaction remain within the product’s acceptable risk boundaries?A regression creates unacceptable exposure, even if another engagement metric improves.
    LatencyDid the result arrive fast enough for the user’s workflow?Delay causes abandonment, repeated attempts, or a return to the previous process.
    UX frictionCould the user reach a good outcome without unnecessary setup, retries, or corrections?Users fail before they have a fair chance to experience the agent’s value.

    Shortlist three to five candidates tied to these user outcomes. A long eval inventory makes analysis look comprehensive while weakening the decision. You are not trying to find every quality problem. You are looking for an early signal that is measurable, related to meaningful retention, and alterable through a product intervention.

    Build an identity and time contract before modeling anything

    The hardest part is usually not the statistical model. It is joining AI interactions to product behavior without duplicating records, losing users, or assigning an outcome to the wrong account. Evals often live in notebooks or model-observability systems while retention events live in product analytics. A plausible-looking join can still be wrong.

    Create a data contract that covers both systems. At minimum, it should specify:

    • Stable user and tenant identifiers, including the rule used when a user belongs to more than one tenant.
    • The timestamp that determines whether an interaction belongs inside the observation period.
    • The model and workflow version associated with the interaction.
    • The conditions that make an interaction eligible for each eval.
    • The grain of the analysis table, such as one row per user-day or tenant-day.
    • The treatment of missing data, especially the difference between no eligible interaction and an evaluated failure.

    That last distinction is easy to miss. A user who never invoked an eligible workflow did not fail the accuracy eval. Combining non-use and poor quality into the same value hides whether the retention problem comes from discovery, setup, or AI performance.

    Compute daily per-user and per-tenant features rather than joining every raw interaction directly to every product event. Each feature should retain its denominator or exposure count. A pass rate without the number of eligible interactions can make sparse use look equivalent to sustained use.

    Keep the definition of each feature readable. Containment, for example, needs an explicit eligible-workflow denominator and an explicit rule for what counts as avoidable escalation. UX friction needs named events, such as a retry or correction, rather than an opaque composite score. If a product manager cannot explain how the feature changes, the team will struggle to turn it into a roadmap decision.

    Watch for many-to-many joins. One AI interaction may generate several product events, and one product session may contain several AI interactions. Joining both raw tables can multiply rows and inflate success or failure counts. Aggregate each side to the agreed grain first, then join the resulting features to the retention cohort.

    Versioning also matters. If a model or workflow changes during the observation period, an account-level average can blend materially different experiences. Preserve the version so you can distinguish a real quality improvement from a change in traffic or segment mix.

    Find a threshold that survives segment and leakage checks

    Once the dataset is reliable, begin with cohort analysis rather than a complex predictive model. Compare retention among users who reached different levels of each candidate signal. You are looking for a separation that is large enough to matter, stable enough to repeat, and reachable through product changes.

    Use this sequence:

    1. Plot weekly or monthly retention against each early eval feature.
    2. Use a driver tree to show where the feature sits between acquisition, activation, AI quality, repeat behavior, and the final retention outcome.
    3. Fit a simple logistic model that controls for plan type, segment, region, and acquisition channel.
    4. Repeat the analysis inside important segments instead of relying only on the blended population.
    5. Check whether the threshold remains directionally useful when you vary the observation definition without allowing it to overlap the outcome.

    The controls are not statistical decoration. Higher-plan customers may have better implementation support. One region may contain a different account mix. A high-intent acquisition channel may produce both better agent usage and better retention. Without those checks, customer composition can masquerade as model improvement.

    In one product context, users who crossed a specific eval threshold early showed three times higher retention than peers who did not. That is evidence that an eval can become a commercially useful leading indicator. It is not a universal benchmark. Your threshold, effect size, eligible population, and retention behavior will depend on your product.

    Do not choose the threshold merely because it creates the largest visual gap. Prefer a boundary that has enough eligible users on both sides, persists across relevant segments, and corresponds to an experience the product can influence. A dramatic ratio from a small cohort is a hypothesis, not a roadmap mandate.

    Run an explicit leakage review before presenting the result. Common forms include an eval feature calculated after the retention window begins, an account-health field that already contains renewal information, or a usage feature whose value can only rise when the user returns. Leakage can make a weak signal look uncannily predictive.

    The decision artifact should show the cohort definition, feature window, retention window, cohort sizes, effect estimate, control variables, and segment sensitivity together. If the threshold only works for a particular plan or acquisition channel, say so. A narrow, honest signal is more actionable than a broad result that disappears when the mix changes.

    Use experiments to separate a predictor from a product lever

    A predictive eval signal is not automatically causal. Sophisticated users may configure the agent better, choose easier workflows, or persist through early friction. Their higher eval scores and higher retention may share the same cause. Improving the score will not necessarily reproduce their behavior.

    Convert the signal into a testable product intervention:

    1. Choose an intervention that can move the signal during the early observation period. Depending on the failure, that could be an in-app guide, a product tour, a setup change, or a model change behind a feature flag.
    2. Keep the threshold definition fixed for the experiment. Redefining success after seeing the result turns the test into another exploratory analysis.
    3. Predefine the retained behavior, retention window, target population, and second-order guardrails.
    4. Use a minimum detectable effect calculation to determine whether the experiment can answer the question with the available population.
    5. Run an A/B test where randomization is practical. Measure whether the intervention moves the eval signal and whether that movement is followed by the intended retention lift.
    6. Inspect results by the same segments used in the observational analysis. A blended win can hide a regression for a strategically important group.

    This creates a necessary chain of evidence: the intervention changed the early experience, the early eval feature moved, and the retention outcome moved in the expected direction. If retention improves without movement in the eval, your intervention may work through another mechanism. If the eval improves without retention, the signal is not yet a proven growth lever.

    Treat safety differently from an ordinary optimization metric. A retention increase cannot compensate for an unacceptable safety regression. Use risk scoring to gate exposure, keep model changes behind feature flags until the required evals pass, and monitor anomalies in both the score and its eligible volume. A stable percentage on a collapsing sample is not stability.

    Track support tickets, NPS, and Net Recurring Revenue alongside the primary retention result. These measures operate on different timelines, but they help catch proxy optimization. An intervention that pushes users across an eval threshold while increasing support burden or degrading customer sentiment has not produced a clean product win.

    Separate the user-level and release-level uses of the signal. A user-level signal can trigger onboarding or customer-success help when a new account has not reached the value threshold. A release-level eval can prevent a model change from expanding when quality falls. Combining both into one vague health score makes ownership and response unclear.

    Put the winning signal into the product operating system

    The analysis matters only when it changes what happens next. Give the signal a definition, an owner, an intervention, and a response to regression.

    • For onboarding, guide new users toward the workflow conditions associated with crossing the threshold. Do not merely show them where the AI button is.
    • For customer success, add the signal to a health score only when the team has a specific action to take. A warning without a playbook creates dashboard noise.
    • For roadmap planning, require proposed work to identify which eval feature it should move, why that feature connects to retention, and how the effect will be tested.
    • For model releases, keep exposure controlled with feature flags until the relevant eval improves without violating safety or experience guardrails.
    • For monitoring, use anomaly detection on the eval value, eligible interaction volume, and important segments so a blended average does not conceal a regression.

    This operating model also clarifies ownership. Product owns the intervention and decision. Data science owns the validity of the feature and analysis. Engineering owns reliable instrumentation and release controls. Customer success owns the response when an account-level signal indicates missed value. Those responsibilities can be distributed differently in your organization, but none should be implicit.

    Key takeaways

    • Define the retained behavior, population, unit, and time window before selecting an eval.
    • Shortlist three to five eval candidates that describe real user value: accuracy, containment, safety, latency, or UX friction.
    • Aggregate reliable daily features with stable user and tenant identifiers before joining them to product cohorts.
    • Use cohort analysis, driver trees, and simple controlled models to find a predictive threshold, then check sample size, segment mix, and label leakage.
    • Use an A/B test to learn whether a product intervention can move both the eval signal and retention.
    • Operationalize a validated signal through onboarding, customer success, release gates, feature flags, and anomaly detection.

    At your next product review, bring a short decision sheet with the retained behavior, observation window, no more than five candidate evals, join keys, and the first intervention you can test. If the team cannot fill in those fields, fix the analytics contract first. If it can, run the smallest credible experiment and let retained behavior, not a prettier eval dashboard, decide the roadmap.

    References

  • Mastering Product Marketing with Amplitude Analytics: Proven Playbooks for Sustainable Growth

    Mastering Product Marketing with Amplitude Analytics: Proven Playbooks for Sustainable Growth

    I’m continually refining how we use analytics to elevate product marketing, and this collection brings together my most effective playbooks for driving measurable growth with Amplitude Analytics. If you’re focused on product-led growth, you’ll find pragmatic guidance on translating behavioral analytics into sharper positioning, stronger activation, and durable retention.

    In my day-to-day work, I connect product strategy with go-to-market strategy by grounding every narrative in real user behavior. That means using event data to validate our value proposition, mapping journeys to uncover friction, and aligning product positioning with the moments that actually matter in-app. The outcome is a marketing engine that mirrors how customers discover, adopt, and expand within the product.

    Activation and retention are where outcomes are won or lost. I detail how to set leading indicators for user activation, instrument key behaviors, and run retention analysis that distinguishes healthy engagement from noisy usage. You’ll see how I turn cohort insights into precise messaging, targeted onboarding, and experiments that compound over time.

    Cross-functional execution is essential, so I share ways to operationalize a unified analytics platform across product, marketing, and customer success. With shared metrics, product trios can move faster from product discovery to launch, and marketing can scale campaigns that reflect what’s truly driving adoption. This tight loop reduces guesswork and increases our hit rate on both features and narratives.

    If you’re building a modern product marketing function, these essays and guides will help you move from intuition-led storytelling to evidence-backed strategy. Dive in to learn how I connect behavioral analytics to positioning, packaging, and roadmap choices—so every campaign and release ladders up to meaningful customer outcomes and sustainable growth.


    Inspired by this post on Amplitude – Perspectives.


    Book a consult png image
  • Churn Prediction: A Practical Build-Versus-Buy Framework

    Churn Prediction: A Practical Build-Versus-Buy Framework

    You need a churn score soon. Customer success wants a prioritized account list, engineering wants requirements, and finance wants to know whether it is funding a vendor contract or a permanent internal capability. A polished model can still leave all three teams waiting if nobody has decided what happens after an account is flagged.

    Start with the retention decision, not the algorithm. Once you know who will act, what they will do, and how you will measure the result, the build-versus-buy choice becomes much clearer.

    Decide which capability you actually need to own

    Churn prediction is often discussed as if it were a single model. In practice, it is an operating loop with several layers:

    1. Define the outcome. Specify which customers can churn, what event counts as churn, and the prediction window that gives your team enough time to intervene.
    2. Assemble the signals. Connect product usage, account attributes, engagement, support, billing, and other permitted data to a consistent customer identity.
    3. Estimate risk. Produce a score, category, or ranking that separates accounts requiring attention from the rest of the portfolio.
    4. Activate the prediction. Route the result into the CRM, customer-success workflow, lifecycle message, or in-product experience where somebody can respond.
    5. Learn from the intervention. Measure whether the action changed retention, adoption, engagement, or Net Recurring Revenue rather than assuming that a plausible score created value.

    You do not necessarily need to own every layer. A vendor might provide behavioral analytics, scoring, in-app guides, and CRM integration while you retain ownership of the churn definition, intervention policy, and experiment design. Conversely, you might build a specialized risk model but continue using commercial tools to collect events and deliver treatments.

    My default is to separate model ownership from outcome ownership. Your company must own the definition of success, the permitted uses of the score, and the learning loop. It only needs to own the model code when that ownership creates a strategic advantage.

    Before evaluating an architecture or vendor, complete this sentence:

    When a customer in [defined population] crosses [risk condition], [named owner] will take [specific action] through [named system], and I will judge the intervention using [business outcome].

    If you cannot complete it, pause the model decision. You have an intervention-design problem. Buying software will automate the ambiguity, while building will make the ambiguity more expensive.

    Run six decision gates before choosing a path

    The right answer depends on more than whether your team can train a model. Use these gates to expose the constraint that should control the decision.

    Decision gateEvidence to inspectWhat pushes you toward a path
    Time to valueDecision deadline, current churn visibility, and readiness of the first interventionUrgent activation favors buying; a longer strategic horizon makes building more viable
    Data readinessOutcome labels, identity resolution, event consistency, signal freshness, and usable historyImmature data favors a packaged baseline while you repair foundations; reliable proprietary data strengthens the case to build
    Strategic differentiationSignals or decisions competitors and general-purpose vendors cannot reproduceA must-have retention capability favors buying; a defensible product advantage favors building
    Operating talentNamed owners for data pipelines, production scoring, monitoring, governance, and intervention designMissing ownership favors buying; durable cross-functional capacity makes building credible
    Activation fitCRM, customer-success, messaging, analytics, and in-product delivery requirementsStandard integrations favor buying; specialized actions or product-embedded scoring may require a build or hybrid approach
    Risk and explainabilityPrivacy, access, retention, audit, explanation, and regulatory requirementsStandard controls may fit a vendor platform; domain-specific constraints can justify owning selected layers

    Time to value: is speed useful, or merely urgent?

    A short deadline only matters when an intervention is ready. If customer success already knows what it will do with a high-risk account, buying can put usable signals into existing workflows sooner. If the team has not agreed on an action, a fast score simply creates a faster queue of unanswered alerts.

    Ask for the date on which a real user must receive the first actionable score. Then work backward through integration, workflow design, governance review, enablement, and experiment setup. This prevents a vendor demonstration or model prototype from being mistaken for operational readiness.

    Data readiness: can your records support the decision?

    A custom model cannot rescue an unstable churn definition or inconsistent customer identity. Inspect whether product events can be joined to the correct account, whether the churn outcome is recorded consistently, whether important segments have comparable coverage, and whether signals arrive early enough to support action.

    Do not interpret weak data as an automatic reason to buy. A vendor cannot manufacture missing labels or repair every instrumentation gap. It can, however, give you a practical baseline using the signals already available while your team improves the data foundation.

    Differentiation: would model ownership change your product advantage?

    Build when proprietary context can materially improve the decision. That may include distinctive behavioral signals, domain-specific anomaly detection, specialized explanations, or a risk score embedded directly into your product. These are stronger reasons than a general preference to own technology.

    If competitors could buy an equivalent capability and churn prediction mainly helps customer success prioritize outreach, ownership is unlikely to be the differentiator. Put product and engineering attention into the intervention, customer experience, and learning loop instead.

    Talent: can you operate the system after launch?

    Having someone who can train a model is not the same as having an operating team. A production capability also needs data engineering, scoring infrastructure, monitoring for drift, feature maintenance, incident ownership, governance, and a product owner who connects model changes to retention outcomes.

    Put a name beside every continuing responsibility. An empty cell is not a future hiring plan; it is part of the build cost. If the same scarce people are also responsible for your core product, include the opportunity cost of redirecting them.

    Activation: can the score reach the moment of action?

    A prediction trapped in a dashboard has little retention value. Confirm that a score can create the right CRM task, customer-success play, lifecycle message, product tour, contextual tooltip, or in-app nudge. The recipient also needs enough explanation to choose an appropriate response.

    Evaluate activation with a concrete scenario, not a feature checklist. Give a candidate vendor or internal team one representative account and ask it to show the full path from new behavior to updated risk, reason, assigned owner, intervention, and measured outcome. Any manual handoff in that path belongs in the decision record.

    Governance: what must remain controlled and explainable?

    Document which data may be used, who may see the result, how long inputs and scores are retained, what explanations users need, and how a customer could be affected by a mistaken classification. Privacy-by-design, data governance, regulatory compliance, and AI risk management apply whether the prediction is purchased or built.

    Building gives you more design control, but it also transfers the burden of evidence, monitoring, and remediation to your organization. Buying transfers implementation work, not accountability. Require the same governance review for both paths.

    The pattern is straightforward: buy when speed, standard coverage, and workflow activation dominate; build when proprietary signals, specialized explanations, or product differentiation dominate; blend when you need results now but have a credible reason to own selected layers later. A useful default is to buy a working baseline and build only where your context can create an outsized advantage.

    Compare the full economics, not a license and a prototype

    The most common cost comparison is structurally wrong: an annual software license is placed beside the effort required to train an initial model. One is closer to an operating capability; the other is an experiment. Compare both options across the same time horizon and include four cost classes: starting, running, changing, and exiting.

    What belongs in the buy case

    • License, usage, seat, and service costs that apply to the intended customer population.
    • Implementation work for event collection, identity mapping, historical data, and system integrations.
    • Security, privacy, legal, regulatory, and procurement review.
    • Internal administration, score interpretation, workflow ownership, and user enablement.
    • Configuration or services needed for segments, reason codes, guides, alerts, and experiments.
    • Limits on data access, exports, custom features, scoring frequency, and downstream activation.
    • Migration effort if the vendor no longer fits, including preservation of historical scores and experiment records.

    What belongs in the build case

    • Instrumentation, data quality, identity resolution, label construction, and feature pipelines.
    • Exploration, training, evaluation, explanation design, and production validation.
    • Batch or real-time scoring, storage, APIs, access control, and reliability engineering.
    • CRM, messaging, customer-success, analytics, and in-product integrations.
    • Monitoring for drift, broken inputs, coverage gaps, and unexpected segment behavior.
    • Retraining, feature maintenance, documentation, incident response, and ongoing product ownership.
    • Privacy controls, audit evidence, risk review, retention rules, and regulatory compliance.
    • Replacement or migration work when the architecture, churn definition, or business workflow changes.

    Add cost of delay to both cases. Buying may carry a visible contract cost, but waiting for a custom capability can defer retention experiments and leave customer-success capacity poorly targeted. Building may require more internal investment, but a vendor that cannot express your signals or deliver the required intervention can delay learning in a different way.

    Keep benefit assumptions separate from cost estimates. The model’s theoretical accuracy is not a financial return. Estimate value only through an intervention that can plausibly affect customer behavior, then validate that assumption with an experiment.

    Your comparison should therefore show three views for each path:

    • Capability: which parts of the signal-to-action loop will actually work?
    • Economics: what will it cost to start, operate, change, and exit?
    • Evidence: what experiment will determine whether the capability improves retention or NRR?

    If one option looks cheaper only because a row is blank, resolve the missing responsibility before approving it.

    Use a hybrid path without creating two disconnected systems

    A hybrid strategy is more than running a vendor score and an internal score at the same time. Done well, it sequences the work: buy the common layers needed for speed and activation, learn which proprietary signals matter, and build only the components that earn their continuing cost.

    Phase one: establish a usable baseline

    Choose one defined customer population, one churn outcome, and one intervention. Configure the purchased capability to produce a risk signal and a usable reason, then route both into the workflow where the named owner can act.

    Record three different kinds of evidence:

    • Prediction evidence: coverage, signal freshness, ranking or precision, stability across relevant segments, and the usefulness of explanations.
    • Operational evidence: whether scores arrive in time, whether users understand them, and whether a flagged account reliably receives the intended treatment.
    • Business evidence: whether the intervention changes retention, adoption, engagement, or NRR.

    Do not use prediction quality to claim business impact. It is possible to identify high-risk accounts accurately and still deliver an ineffective intervention. It is also possible for a broad model to create value because it reaches the right team at the right moment. These are different questions and need different measures.

    Phase two: test where proprietary context adds value

    Use retention analysis to identify behaviors that appear meaningfully connected to continued use or churn. Focus on information a general-purpose platform cannot represent well, such as domain-specific sequences, unusual account structures, specialized failure states, or product-specific anomalies.

    Introduce one material improvement at a time. Compare the resulting decisions with the baseline: which accounts move, whether the reason becomes more actionable, and whether the intervention performs better. A more complex score is not automatically a better product.

    Use A/B testing or another appropriate controlled rollout to evaluate the intervention. Set the minimum detectable effect before the test so the team agrees on the smallest change worth detecting and whether the experiment can support the decision. Where withholding an intervention is inappropriate, compare credible treatments or use a phased rollout rather than treating measurement as optional.

    Phase three: build only the layer that proved distinctive

    The result may not be a complete vendor replacement. You might own a proprietary feature pipeline, domain-specific anomaly detector, custom explanation layer, or specialized risk score while retaining commercial analytics and activation. That is often a cleaner boundary than recreating collection, dashboards, integrations, guides, and workflow delivery.

    Before moving a custom component into production, require evidence that:

    • The proprietary signal changes a meaningful decision rather than merely changing a score.
    • The resulting intervention has a credible path to measurable retention or NRR impact.
    • A named team owns data quality, production reliability, drift monitoring, governance, and retraining.
    • The migration preserves the activation loop instead of sending users to a separate dashboard.
    • The added value justifies both the continuing cost and the engineering capacity displaced by the work.

    Create a canonical risk contract before two systems coexist. Define the eligible population, outcome, prediction window, score meaning, reason codes, refresh expectations, owner, permitted actions, and measurement plan. Without that contract, teams will compare incompatible scores and select whichever one confirms their prior belief.

    Run the custom component beside the baseline before switching interventions. Inspect coverage, stability, explanations, workflow behavior, and segment differences without changing several parts of the retention program at once. This makes the eventual migration a product decision supported by evidence, not an infrastructure milestone searching for a justification.

    Key takeaways

    • Buy when your immediate need is dependable coverage, rapid activation, and standard integrations for customer success or product-led growth.
    • Build when proprietary signals, domain-specific risk scoring, specialized explainability, or product differentiation can create material value and you can fund continuing operations.
    • Blend when you need a working baseline now and have a testable hypothesis about where your data or context can outperform a general-purpose capability.
    • Do not approve any path until every score has a named recipient, a defined action, a delivery system, and a business outcome.
    • Compare equivalent total costs, including data work, integrations, monitoring, governance, activation, opportunity cost, and migration.
    • Measure the model and the intervention separately. Prediction quality can prioritize attention; only an effective action can improve retention.

    Take a one-page decision memo into your next review. It should name the churn definition, first population, intervention, deadline, available signals, proprietary advantage, workflow, operating owners, governance constraints, total-cost boundary, and experiment. End the meeting with a selected path and an explicit condition for reconsidering it.

    Start with the smallest path that closes the loop from behavior to action to measured outcome. Earn the right to build more by proving that your own data changes the decision and that the decision changes retention.

    References

  • How We Taught Agentic AI to Speak Product Analytics—and Unlocked Actionable Insights

    How We Taught Agentic AI to Speak Product Analytics—and Unlocked Actionable Insights

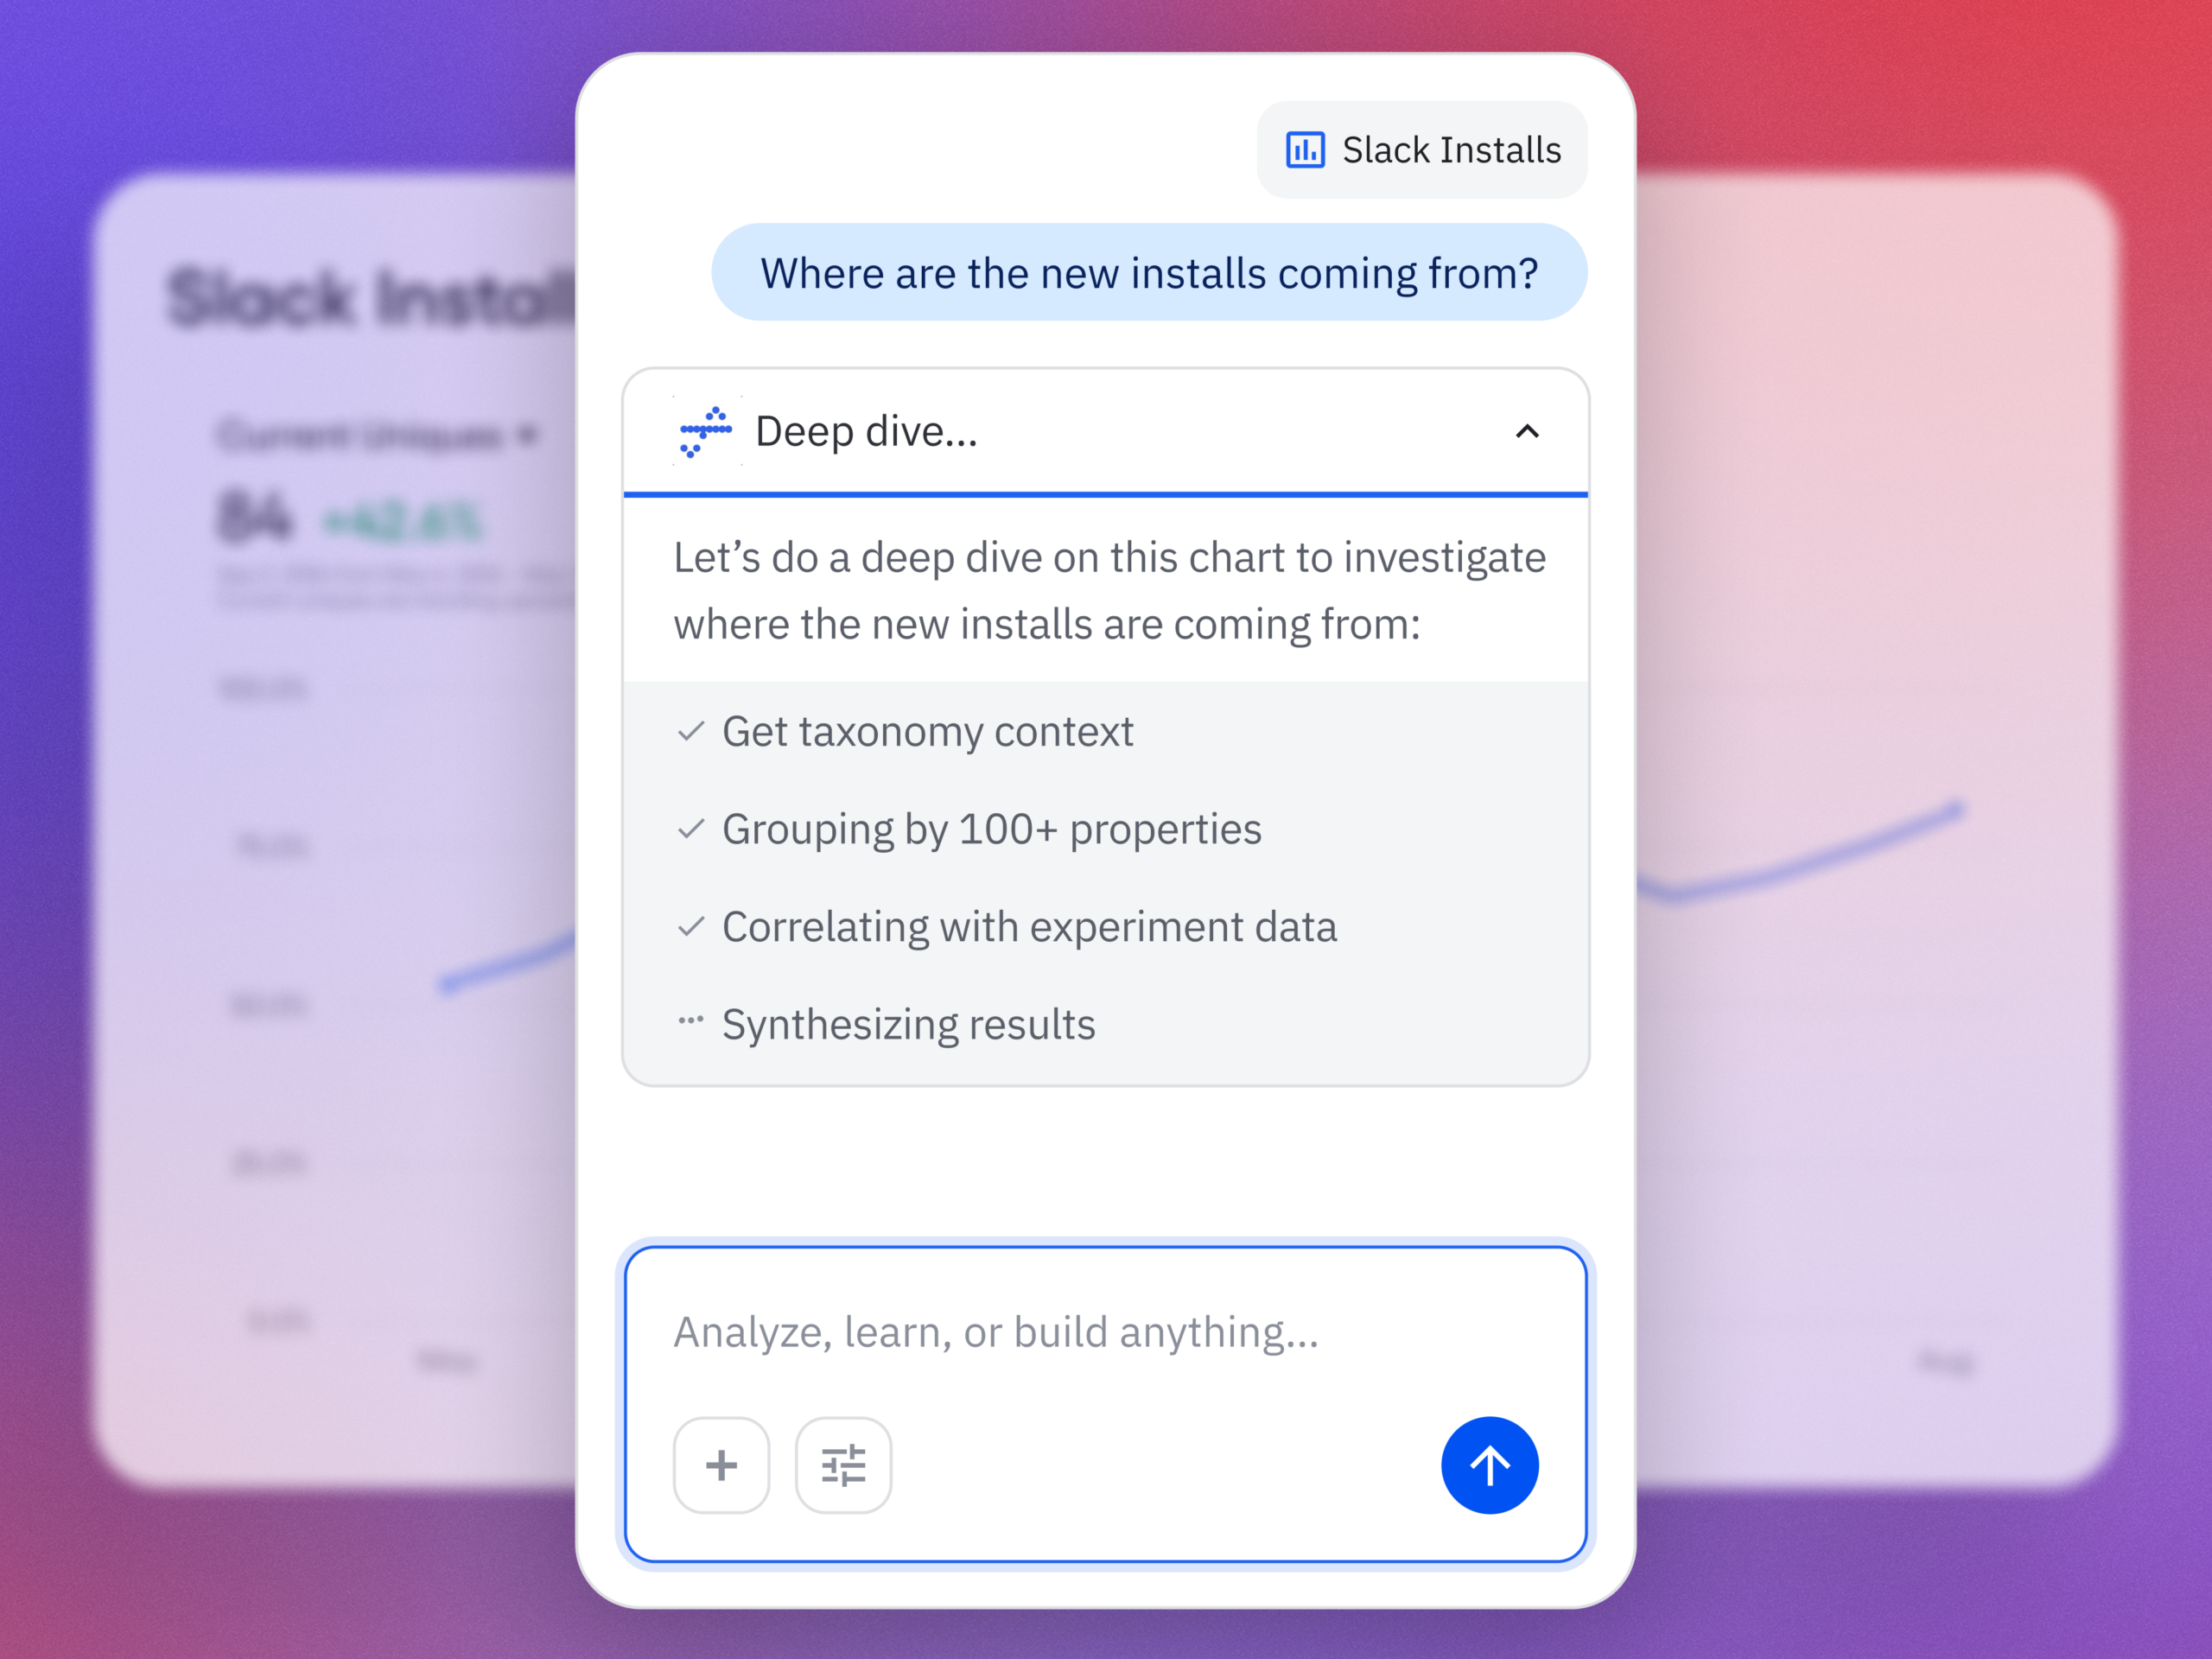
    I set out to solve a deceptively simple problem: help our teams ask product questions in plain English and get trustworthy, analysis-grade answers—fast. That required more than a powerful model; it demanded agents that genuinely understand the language of product analytics, from behavioral analytics nuances to the messy reality of event taxonomies, funnels, and cohorts. In this post, I share how we engineered agentic AI that speaks our domain fluently and turns questions into decisions.

    The core challenge wasn’t data volume or dashboard sprawl; it was semantics. Different teams said “activation,” “onboarding,” or “first value” and meant overlapping but distinct things. Our PMs, analysts, and engineers navigated a maze of synonyms across Amplitude analytics, Pendo, and our unified analytics platform. Generic LLMs stumbled on these nuances, so we built a shared ontology—driver trees anchored to a clear North Star—with canonical definitions for activation, retention, and conversion, plus consistent event naming and cohort logic.

    We started with a rigorous metric catalog: every KPI linked to its drivers, exact formulas, cohorts, and time windows; every event mapped to a product taxonomy; every dashboard and SQL snippet versioned with ownership and lineage. That catalog became the ground truth for agents. We embedded data governance and privacy-by-design from the start—permissioning for fields and queries, PII redaction, and scoped access that reflected how product teams actually work.

    Next, we built a retrieval-first pipeline to ground the agents in our corpus before generation. We indexed metric definitions, dashboards, experiment readouts, runbooks, and high-signal Slack threads so the agent could cite relevant artifacts, not just predict plausible text. With careful context window management and prompt engineering, the agent retrieves definitions and prior analyses, then plans multi-step actions: run a query, compare cohorts, check “minimum detectable effect (MDE)” for an A/B test, and summarize findings with references.

    Architecturally, we treated this as “Agent Analytics”: an orchestrator that selects tools based on intent—querying Amplitude analytics or Pendo for behavioral paths and funnels, hitting our warehouse for cohort tables, or pulling experiment metadata and anomaly detection alerts. Tool use is permission-aware, auditable, and designed to fail safe. The agent’s outputs include citations back to the exact definitions, dashboards, and SQL used, so reviewers can validate and iterate.

    Quality came from eval-driven development, not intuition. We built a gold set of representative product questions (activation inflections, retention analysis by segment, funnel drop-offs after feature launches) and scored the agent on faithfulness to definitions, numerical accuracy, latency, and actionability. We incorporated regression checks to catch drifts after schema changes, and we tuned prompts to reduce overconfident answers and push for clarifying questions when context was missing.

    Safety and reliability were non-negotiable. We layered AI risk management with role-based access, guardrails that block destructive queries, and risk scoring for unfamiliar joins or sudden spikes in metric deltas. The agent logs every step—what it retrieved, which tools it called, and why—so analysts can replay and refine the chain of thought with transparent provenance.

    The payoff: product teams now self-serve nuanced questions in minutes instead of days, and our analysts spend more time on discovery than report wrangling. Retention analysis improved as the agent standardized cohort logic; conversion investigations accelerated thanks to consistent funnel definitions; and cross-functional decisions aligned around the same driver trees and shared language. Most importantly, the agent turned ambiguous asks into structured analyses that stand up to scrutiny.

    For fellow product leaders, my lesson is simple: start with semantics, not models. A crisp ontology, disciplined taxonomy, and clear ownership will outperform a flashy stack riddled with ambiguity. Avoid technology FOMO; favor retrieval-first grounding, small sharp tools, and continuous discovery with your product trios. When your organization speaks a common analytics language, agents can finally think with you, not just for you.

    Next, we’re extending the agent’s planning skills to recommend experiment designs, estimate power and “minimum detectable effect (MDE),” and propose driver-tree-informed bet sizing. We’re also tightening feedback loops so every accepted answer, edit, or override strengthens the retrieval corpus and evaluations. The vision: a calm, reliable layer that makes rigorous product analytics feel conversational—and helps teams move from questions to confident action.


    Inspired by this post on Amplitude – Best Practices.


    Book a consult png image
  • Stop Misleading A/B Tests: Master Sample Size Assumptions for Reliable Results

    Stop Misleading A/B Tests: Master Sample Size Assumptions for Reliable Results

    I’ve learned the hard way that sample size calculators can be both empowering and deceptive. They feel wonderfully precise, but they’re only as trustworthy as the assumptions you feed them. When I lead A/B testing at scale, I treat the calculator as a planning tool, not a verdict—then I systematically validate the assumptions behind it so our decisions stay rigorous and our roadmap stays credible.

    At a minimum, most calculators assume you know your baseline rate, your “minimum detectable effect (MDE),” your desired statistical power, and your significance level. They also quietly assume independent observations, clean randomization, stable traffic quality, and a fixed test horizon with no peeking. If any of those break, the “right” sample size can be wildly wrong—and the test conclusions can nudge teams toward the wrong product or go-to-market bet.

    Baseline and variance come first for me. I estimate the baseline conversion (and volatility) from recent behavior using behavioral analytics, sanity-check it across key segments, and look for seasonality. Tools like Amplitude analytics help me spot anomalies, bots, or instrumentation drift. If baseline is unstable or highly skewed, I either stabilize it with longer lookbacks or narrow the target segment to reduce noise.

    Setting the “minimum detectable effect (MDE)” is where product strategy meets statistics. I work backward from an outcome that actually matters: the revenue, retention, or activation uplift that justifies the opportunity cost of building and running the experiment. If that effect size is implausible given historic lift and variance, I rethink the scope or stack changes into a sequenced set of learning experiments rather than overpromising a single moonshot.

    For power and alpha, I default to 80–90% power and a 5% significance level unless the downside risk of a false positive is unusually high, in which case I tighten alpha. I choose one-tailed tests only when we would not act on a negative result and we’ve explicitly pre-registered that decision; otherwise, two-tailed is safer for real-world ambiguity.

    Randomization and independence are where many tests quietly fail. I randomize at the user level (not session or pageview), guard against cross-device contamination, and ensure consistent exposure via feature flags. If there’s shared context—say, team-based usage or geographic clustering—I account for it via cluster randomization or acknowledge the inflated variance it can introduce.

    Traffic allocation integrity is non-negotiable. I monitor for sample ratio mismatch by comparing observed group splits to the intended allocation and immediately pause if they drift. When SRM appears, the root cause is often instrumentation gaps, eligibility filters applied asymmetrically, or caching layers. Fixing that early preserves trust in every test that follows.

    Fixed-horizon math assumes no peeking. If stakeholders need continuous reads, I use sequential testing methods with alpha spending or always-valid approaches designed for ongoing monitoring. If we commit to a fixed horizon, we stay disciplined: no early looks, no midstream metric swaps, no retrofitted hypotheses.

    Multiple comparisons can quietly inflate false positives. I predeclare one primary metric to decide, define guardrail metrics to protect experience and revenue, and apply appropriate corrections (for example, controlling the false discovery rate) when testing many variants or slicing results by numerous segments.

    Duration and seasonality matter more than most roadmaps admit. I run through full business cycles (at least one complete week for daily patterns, longer for B2B buying rhythms), plan for novelty effects, and watch for behavior settling after initial exposure. If the intervention changes long-run behavior, I extend the measurement window or add a post-test holdout to capture durable impact.

    Not all metrics are binomial. For revenue, time-on-task, or heavy-tailed distributions, I confirm variance assumptions, use robust estimators or bootstrapping, and consider variance reduction methods like CUPED to improve power without overextending duration. The calculator’s simplicity should not mask the data’s complexity.

    Finally, I connect experimentation to product outcomes. I map hypotheses to a driver tree, ensure each test ladders to activation, retention, or monetization, and document assumptions up front so we learn even when results are null. The result is a culture that respects the math and moves faster precisely because we trust our reads.

    Here’s the practical checklist I use before pressing “Start”: validate baseline and variance from recent behavior; set an MDE tied to meaningful business impact; choose power and alpha explicitly; confirm user-level randomization and stable exposure; watch for sample ratio mismatch; align on fixed-horizon vs sequential testing; predeclare a single primary metric and guardrails; run long enough to cover seasonality; use robust methods for non-binomial metrics; and write a brief pre-read so the whole team commits to the plan.

    When we honor these assumptions, sample size calculators become sharp instruments rather than blunt ones. You’ll ship fewer misleading wins, avoid costly false negatives, and build a repeatable experimentation engine that compounds learning—and results—over time.


    Inspired by this post on Amplitude – Perspectives.


    Book a consult png image
  • Inside Amplitude’s ML Playbook: Practical Strategies for Smarter A/B Tests and Growth

    Inside Amplitude’s ML Playbook: Practical Strategies for Smarter A/B Tests and Growth

    I’m continually asked how machine learning can make product analytics more actionable. Drawing from Amplitude analytics in real-world settings, I’ve distilled what matters most for product teams that want faster, smarter decisions without sacrificing rigor.

    When I design experiments, I start with minimum detectable effect (MDE) to size samples correctly and avoid costly, inconclusive tests. I pair that with disciplined A/B testing hygiene—clear hypotheses, thoughtful stop rules, and guardrails for key metrics—so results translate into credible product strategy choices instead of noisy dashboards.

    For growth and retention, I map behavioral analytics to activation and long-term value. Driver trees help me connect feature adoption to revenue or retention, and anomaly detection keeps me from overreacting to outliers when seasonality or data quality shift.

    I segment cohorts by user intent and lifecycle stage, measure user activation with crisp event definitions, and monitor leading indicators across a unified analytics platform. This keeps cross-functional conversations grounded, accelerates product-led growth, and reduces the risk of optimizing for vanity metrics.

    Operationally, that means building self-serve views that flag MDE-ready experiments, surface retention analysis by cohort, and trigger anomaly detection alerts only when the signal outpaces noise. The payoff is fewer meetings debating data quality and more time shipping value.

    If you’re leveling up your analytics stack, start by tightening experimentation basics, instrumenting activation and retention with behavioral analytics, and wiring in anomaly detection as a safety net. You won’t just move faster—you’ll learn faster, and with the confidence to bet big when the data earns your trust.


    Inspired by this post on Amplitude – Perspectives.


    Book a consult png image
  • 5 powerful ways I use Pendo MCP to bring product analytics into ChatGPT, Claude, and Cursor

    5 powerful ways I use Pendo MCP to bring product analytics into ChatGPT, Claude, and Cursor

    I’ve wanted my product analytics to follow me into every conversation, doc, and code review. Now they do—and it changes how quickly I can move from question to insight to decision.

    Pendo is now available as an MCP (Model Context Protocol) server, easily accessible in Claude, ChatGPT, and Cursor.

    Practically, this means my core product analytics, segments, and qualitative feedback can be surfaced right where I plan sprints, refine opportunity solution trees, and write specs. Fewer context switches, tighter feedback loops, and faster product decisions.

    Here are five ways I put Pendo MCP to work across my day-to-day workflows—grounded in product management leadership habits and built for speed and clarity.

    1) Daily triage and decision support: In ChatGPT or Claude, I quickly query product analytics to spot anomalies, usage spikes, or drop-offs by segment. Prompts like “Highlight top features by week-over-week growth and flag statistically notable anomalies” help me focus standups on what matters, tightening the loop between observability and action.

    2) Continuous discovery prep: Before customer interviews, I pull recent NPS verbatims, feature adoption by persona, and journey mapping signals. In seconds, I have a concise brief that blends behavioral analytics with customer interviews, so I can ask sharper questions and validate assumptions faster—without leaving my AI workspace.

    3) Evidence-based prioritization: When shaping the roadmap, I bring in retention analysis, user activation metrics, and cohort views to weigh impact vs. effort. Using Pendo MCP inside Claude or ChatGPT, I translate insights into driver trees and a clear product strategy narrative that aligns stakeholders around outcomes, not output.

    4) Product-led growth and onboarding: I review onboarding funnels, identify friction in first-run experiences, and draft in-app guides and tooltip copy that meets users at the exact drop-off points. With Pendo MCP, the context for product tours and in-app guides is right where I’m writing, so iteration cycles stay tight and data-informed.

    5) Customer success and QBR prep: For account health and QBRs vs OKRs alignment, I generate succinct summaries of feature adoption, sentiment, and value realization—ready to paste into email, decks, or a CRM integration. This keeps sales-led and product-led growth motions unified, with a single source of truth visible in ChatGPT, Claude, or when I’m coding in Cursor.

    The net effect: higher-quality decisions, faster. By bringing product analytics into my AI workflows, I reduce context switching, improve context window management, and keep my team anchored to real user behavior. Wherever I’m working—ideating in Claude, drafting in ChatGPT, or reviewing code in Cursor—my Pendo context is right there with me.

    If you’re leading empowered product teams, this is a pragmatic way to operationalize continuous discovery, speed up alignment, and turn insights into outcomes. It’s a simple shift with outsized leverage.


    Inspired by this post on Pendo – Best Practices.


    Book a consult png image
  • Unlock Confident Decisions with Bayesian Statistics: Smarter A/B Tests from Small Samples

    Unlock Confident Decisions with Bayesian Statistics: Smarter A/B Tests from Small Samples

    Shipping great products is a game of making high‑quality decisions under uncertainty. In my role leading product management, I’ve seen teams stall when classic methods demand huge sample sizes before we can say anything useful. Bayesian statistics has become my go‑to approach for turning sparse data into clear, decision‑ready insights—especially when traffic is limited or experimentation windows are tight.

    Understand Bayesian statistics vs. frequentist methods and learn how Bayesian approaches improve experiment insights with small sample sizes.

    Here’s why I rely on it in A/B testing: frequentist methods focus on p‑values and long‑run error rates, which are tough to translate into action. With a Bayesian lens, I can express outcomes as intuitive probabilities—“Variant B has a 92% chance to outperform A”—and use credible intervals to communicate likely ranges of impact. That clarity reduces decision friction and helps the team move faster with confidence.

    Bayesian methods shine when sample sizes are small and the minimum detectable effect (MDE) of a frequentist test would be impractically large. I incorporate prior knowledge—historical conversion trends, seasonality, and learnings from related experiments—to stabilize noisy early data. Done thoughtfully, priors improve estimate quality without overfitting; I always run sensitivity checks to ensure the posterior is driven by the data we’re observing, not wishful thinking.

    In practice, my workflow is straightforward. I set a prior from historical performance in Amplitude analytics, run the experiment, and update the posterior daily. I track the probability of superiority, expected lift, and a credible interval that the CRO role can rally around. When the probability of a meaningful win crosses a pre‑agreed threshold, we ship. When it doesn’t, we bank the learning and move on—no prolonged debates about p‑values that few stakeholders truly understand.

    This approach also strengthens product discovery. By using behavioral analytics and retention analysis as informative priors, I can evaluate early signals from narrower cohorts—new geographies, niche segments, or enterprise accounts—where traffic is scarce. The result is faster iteration in product‑led growth environments, even when a full‑funnel test would take weeks to reach frequentist significance.

    Operationally, I treat Bayesian experimentation as part of a unified analytics platform strategy. The same posterior machinery that powers A/B testing can support anomaly detection during releases, quantify risk in phased rollouts, and estimate lift from in‑app guides or product tours. Because results are framed in plain language probabilities, cross‑functional teams make better, faster decisions aligned to outcomes rather than outputs.

    A few guardrails keep me honest. I preregister decision rules (stop/go thresholds, guardrail metrics), run prior sensitivity analyses, and document assumptions alongside results. That discipline prevents overconfidence, improves reproducibility, and builds trust with leadership.

    If your experiments are bottlenecked by low traffic or you’re tired of waiting weeks for a binary “significant/not significant,” consider a Bayesian upgrade. You’ll get earlier readouts, clearer stakeholder communication, and a repeatable path to compounding learning—without sacrificing rigor.


    Inspired by this post on Amplitude – Perspectives.


    Book a consult png image
  • Inside My Product Marketing Playbook: Amplitude Analytics Tactics That Drive PLG Wins

    Inside My Product Marketing Playbook: Amplitude Analytics Tactics That Drive PLG Wins

    I’ve curated a focused set of product marketing insights that zero in on what actually moves the needle—turning data into decisions. You’ll find a special emphasis on Amplitude Analytics, because its behavioral analytics foundation makes it easier to translate product usage into clear messaging, sharper positioning, and measurable growth.

    In my day-to-day as a product leader, I’m constantly bridging the gap between product discovery and go-to-market strategy. The best outcomes come when we connect quantitative signals to narrative: using behavioral analytics to inform the value proposition, refining product positioning with cohort trends, and driving product-led growth with activation and retention insights.

    Here’s how I put this into practice. I start with user activation and retention analysis to identify the few behaviors that predict long-term value. Then I run tightly scoped A/B testing to validate messaging and in-product prompts that nudge those behaviors. When the numbers move, I translate wins into a consistent story—one that sales, success, and marketing can all rally around.

    One pattern keeps repeating: clarity beats complexity. Instead of piling on more features, I focus on the minimum, verifiable set of behaviors that correlate with outcomes. That discipline makes it easier to craft a crisp value proposition, streamline go-to-market strategy, and accelerate feedback loops between product, design, and marketing.

    As you explore this collection, expect practical playbooks over platitudes. You’ll see how to apply Amplitude Analytics to uncover hidden friction, validate hypotheses faster, and operationalize product-led growth motions that compound over time. My goal is to help you move from interesting dashboards to decisive actions that strengthen your roadmap and your revenue.

    If you care about building empowered product teams that learn continuously, you’ll feel at home here. Dive in, borrow what works, and adapt the rest to your context—then measure it, iterate, and share the wins with your team.


    Inspired by this post on Amplitude – Best Practices.


    Book a consult png image
  • Meet Amplitude’s Always‑On AI Analysts: Instant Answers Without Dashboards or Reports

    Meet Amplitude’s Always‑On AI Analysts: Instant Answers Without Dashboards or Reports

    For years, I’ve watched product, growth, and data teams burn cycles stitching together manual dashboards and reports, then slogging through replay review just to validate a hunch. That overhead slows discovery and delays decisions. The promise here is different: "Discover how Amplitude AI Agents help product, growth, and data teams turn questions into action without manual dashboards, reports, or replay review." As someone obsessed with decision velocity and evidence-based product strategy, that shift is exactly what I’ve been waiting for.

    In practice, I think about "Amplitude AI Agents" as always-on data analysts embedded in our workflow. Instead of queuing requests or context-switching into tooling, I can ask targeted questions, get synthesized insights, and move directly to action. This is a powerful example of agentic AI meeting behavioral analytics in a unified analytics platform—removing friction between inquiry and impact while keeping teams focused on outcomes, not artifacts.

    What changes for my day-to-day? I can interrogate customer behavior in real time, pressure-test hypotheses from discovery interviews, and quickly understand whether activation, retention, or monetization is the current constraint. If I’m probing a driver tree for activation or a retention analysis for a specific cohort, I can get to a decision faster—without waiting on someone to build a bespoke dashboard. That means more cycles spent shaping product strategy and fewer sunk into report wrangling.

    This matters beyond speed. When product, growth, and data leaders anchor discussions in the same source of truth, we shorten the distance from signal to decision. That alignment is the backbone of product-led growth and continuous discovery: shared context, faster feedback loops, and clearer trade-offs. It also reduces the long tail of analytics debt—those one-off reports and stale views that quietly accumulate across teams.

    Of course, adopting any AI workflow in analytics demands governance. I hold these systems to the same bar I set for my teams: clarity of assumptions, consistent metric definitions, and auditable reasoning. Pairing "Amplitude analytics" with strong data governance, CI/CD for analytics definitions, and lightweight evals helps ensure the recommendations we act on are reliable, reproducible, and explainable. AI should accelerate our judgment, not replace it.

    The strategic shift is simple and profound: move from building dashboards to making decisions. With always-on analysis, we can spend less time instrumenting analytics theater and more time delivering customer value. That is how we translate insights into impact—and why I’m excited to operationalize this capability across our product trios and go-to-market partners.


    Inspired by this post on Amplitude – Best Practices.


    Book a consult png image
  • Ship Smarter with Amplitude + Lovable: See Behavior, Fix Friction, Iterate Faster

    Ship Smarter with Amplitude + Lovable: See Behavior, Fix Friction, Iterate Faster

    I build products with a simple mantra: launch, learn, repeat. Shipping fast is necessary, but shipping smart is what compounds. To do that, I keep analytics close to the work—inside the builder—so every decision is tied to real user behavior, not assumptions.

    Connect Amplitude MCP to Lovable to understand user behavior, spot frictions, and ship better updates without leaving your builder.

    In practice, this integration lets me bring Amplitude analytics and behavioral analytics directly into the creative flow. I can explore funnels, cohorts, and drop‑offs the moment I’m crafting an experience, then translate those insights into concrete changes without context switching. The result is tighter feedback loops and more confident iteration.

    My typical loop looks like this: identify a friction point from funnel analysis, design two or three variants in the builder, and run A/B testing to validate the improvement. I focus on user activation and retention analysis as leading signals, because sustained engagement is the clearest indicator that we’ve solved a real problem. When the data confirms it, we promote the winning experience and move to the next opportunity.

    Keeping the work inside the builder also supports continuous discovery. I can pair quantitative insights with qualitative observations, refine journey mapping, and document learnings while the context is fresh. That makes prioritization and product discovery more reliable, and it turns each iteration into a teachable moment for the team.

    Strategically, this builder‑first approach enables product-led growth. With fewer handoffs and a unified analytics platform, we compress time from insight to impact. It helps me defend roadmap decisions with evidence, communicate trade‑offs clearly, and keep the team focused on outcomes that matter to customers and the business.

    If your goal is to iterate with speed and precision, bring analytics to where you build. Keep the loop tight, measure what moves the needle, and let the data guide your next best update.


    Inspired by this post on Amplitude – Best Practices.


    Book a consult png image
  • Unlock High-Impact Mobile Engagement: Amplitude Guides & Surveys for iOS, Android, React Native

    Unlock High-Impact Mobile Engagement: Amplitude Guides & Surveys for iOS, Android, React Native

    Mobile engagement is most effective when it’s timely, contextual, and grounded in real user behavior. In my experience leading product teams, the fastest path to activation and retention comes from meeting users in the moment with relevant in-app guides and lightweight surveys that reduce friction and illuminate intent.

    Deploy behavioral-driven mobile engagement with Amplitude Guides and Surveys for iOS, Android, and React Native platforms.

    What excites me about this approach is how naturally it supports product-led growth. In-app guides and product tours streamline onboarding, while targeted micro-surveys surface the “why” behind user actions. The result: clearer journey mapping, fewer blind spots in the funnel, and a smoother path to user activation—all without adding engineering heavy-lift for each iteration.

    To optimize continuously, I pair behavioral analytics with A/B testing and retention analysis. This lets my team validate hypotheses quickly, localize friction by segment or stage, and tune messaging for different cohorts. With Amplitude analytics at the core, we can connect engagement nudges to downstream outcomes, not just clicks—so we’re improving time-to-value, not just surface metrics.

    My recommended starting point is simple: define a single activation moment, instrument the critical behaviors around it, and launch a focused guide plus one survey to test the narrative. Use journey mapping to identify the key decision points, then iterate weekly based on observed behavior, not opinions. This cadence keeps learning velocity high and ensures every change moves us closer to clear outcomes.

    From a leadership perspective, I coach product trios to own an activation or retention KPI, run small controlled experiments, and document learning with crisp before/after evidence. Cross-platform support across iOS, Android, and React Native means we can scale wins quickly, standardize patterns, and create a repeatable playbook for new features and markets—all while keeping the user experience coherent and respectful.


    Inspired by this post on Amplitude – Best Practices.


    Book a consult png image