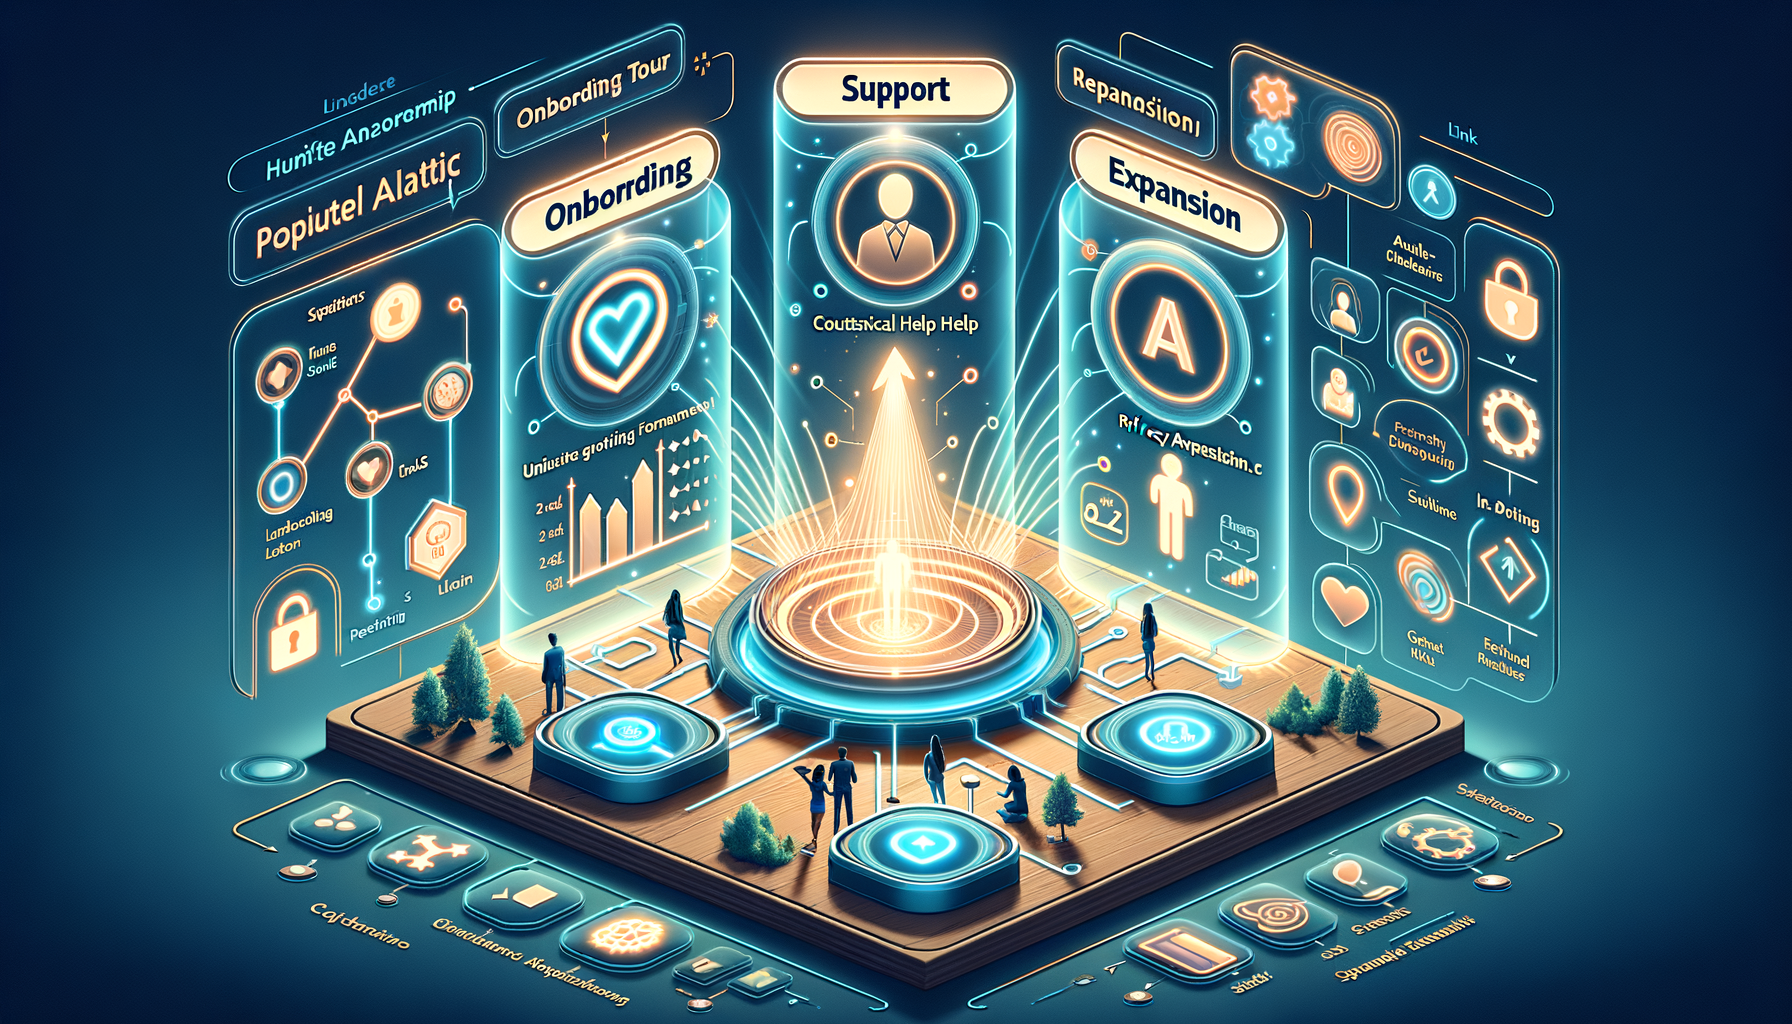
Tag: user activation

  • Unlock B2B Product Excellence: Essential Benchmarks to Outperform Your Tech Peers

    Unlock B2B Product Excellence: Essential Benchmarks to Outperform Your Tech Peers

    I rely on disciplined product benchmarks to turn strategic intent into measurable progress. In B2B technology, benchmarks give me and my team the clarity to prioritize what truly matters, align executives around shared outcomes, and course-correct before small gaps become growth-stalling problems.

    Discover exclusive data and strategies from our Product Benchmark Report. Compare the B2B technology industry’s performance across key product metrics.

    When I assess product health across a portfolio, I start with a core set of product benchmarks: activation rate, onboarding completion, time-to-first-value, weekly and monthly active accounts, feature adoption, cohort-based retention, expansion and contraction revenue, and support deflection. Together, these metrics show where the product creates value, where users get stuck, and which levers most efficiently drive product-led growth.

    Benchmarks are only powerful if they inspire action. I instrument reliable analytics (Amplitude analytics) to capture consistent event data, pair that with in-app guides and product tours (Pendo, Intercom) to test friction hypotheses, and run A/B testing to validate changes with statistical rigor. From there, I translate insights into outcomes-based OKRs, so roadmapping and sprint planning focus on the few bets most likely to move our key product metrics.

    I’ve seen this approach pay off repeatedly. When peer benchmarks revealed our user activation lagged, we simplified onboarding, clarified value propositions with sharper UX writing, and launched targeted in-app nudges. We didn’t just ship features—we improved the experience against a clear yardstick, and the subsequent lift in activation and early retention validated the strategy.

    Cross-functional alignment is critical. I partner with customer success to interpret retention analysis by segment, with marketing to ensure messaging supports time-to-value, and with engineering to keep quality and reliability high. While product metrics lead, I also keep an eye on complementary signals like incident management and DORA metrics to ensure we’re not trading speed for stability.

    If you’re leading a product organization, use benchmarks to calibrate ambition and create focus. Start by identifying the one or two metrics most predictive of long-term retention, set peer-informed targets, and iterate with continuous discovery. The result is a product strategy that is evidence-based, resilient to opinion cycles, and capable of compounding gains over time.

    Ultimately, benchmarks aren’t about vanity; they are about velocity. With a shared view of where you stand against the B2B technology industry, you can make sharper bets, accelerate product-market fit, and turn your roadmap into a reliable engine for growth and customer value.


    Inspired by this post on Amplitude – Perspectives.


    Book a consult png image
  • Product Analytics for Everyone: Master Funnels, Retention, and Conversion to Drive Growth

    Product Analytics for Everyone: Master Funnels, Retention, and Conversion to Drive Growth

    Product analytics isn’t a specialist’s sport—it’s a team capability. In my role leading product teams, I’ve seen designers, engineers, marketers, and customer success partners uncover insights that shape strategy, accelerate product-led growth, and improve outcomes for customers. When we demystify the basics and bring analytics into everyday decisions, we build truly empowered product teams.

    Here’s the core promise of this approach: "Learn the product analytics fundamentals of funnels, retention, and conversion drivers so that anyone can confidently answer key product questions." That line has guided how I teach product managers to think—start with the essentials, tie them to real customer behaviors, and make the work repeatable across the organization.

    I start with funnels because they tell a story—the journey from discovery to value. A simple example: track the path from sign-up to user activation to the first value event. This reveals where onboarding succeeds or stalls, what friction blocks adoption, and which moments are ripe for optimization. With tools like Amplitude analytics or Pendo, we can break down conversions by segment, channel, or feature usage to isolate where improvements matter most.

    Next comes retention analysis, the clearest signal that we’re building something customers choose to return to. Cohort analysis shows who comes back and when; retention curves show where value compels a second, third, and tenth use. Tie retention to activation milestones and the outcomes customers achieve—not just logins—and you’ll quickly spot whether your product discovery assumptions hold up in the wild. A unified analytics platform makes these insights discoverable and repeatable across teams.

    Conversion drivers round out the picture. Once the funnel is clear and retention is stable, I look for the behaviors and experiences that predict success: feature combinations, time-to-value, message timing, or supportive content. Whether in Amplitude analytics or Pendo, correlating these drivers with outcomes lets us prioritize roadmaps with confidence. Pair this with continuous discovery—qualitative interviews, in-product feedback, and rapid experiments—and you’ll move from interesting data to decisive actions.

    This is how we build empowered product teams: by making analytics a daily habit rather than a quarterly report. We bring insights into roadmap reviews, design critiques, and sprint planning; we celebrate learning from experiments as much as shipping features; and we hold ourselves accountable to customer outcomes, not just output. When everyone can interpret funnels, discuss retention, and isolate conversion drivers, we make smarter bets faster.

    If you’re getting started, keep it simple. Define a clear activation metric, instrument the top of your funnel, and track a small number of cohorts. Share a weekly readout with highlights, surprises, and questions to investigate. Over time, stitch insights into narratives that drive product-led growth—and, most importantly, help customers achieve what they came for.

    Product analytics isn’t just for analysts. It’s a shared language for product discovery, onboarding excellence, user activation, and long-term retention. When we practice it together, we build better products and stronger teams.


    Inspired by this post on Amplitude – Best Practices.


    Book a consult png image
  • Enterprise Go-to-Market Mastery: How I Align Product, Positioning, and Analytics at Scale

    Enterprise Go-to-Market Mastery: How I Align Product, Positioning, and Analytics at Scale

    I build enterprise growth motions by grounding strategy in data and execution in crisp storytelling. When I partner with teams using Amplitude, I focus on architecting "go-to-market solutions for enterprise customers." That simple phrase clarifies the mandate: align product, marketing, and sales around measurable value, reduce buyer risk, and prove outcomes early and often.

    My go-to-market strategy begins with rigorous segmentation and an ideal customer profile, then translates into a living narrative: the value proposition, points of parity, and competitive differentiation that underpin product positioning. I pressure-test that narrative with real customer language, executive business cases, and use-case–level messaging so every stakeholder—from procurement to security to the economic buyer—hears their priorities reflected back with credibility.

    Execution is analytics-led. With Amplitude analytics as a unified analytics platform, I instrument the entire journey—from first touch to paid expansion—to expose activation, aha moments, and friction. I use A/B testing to validate in-app guides, product tours, and onboarding, and I track user activation and retention analysis to ensure product-led growth efforts compound over time. These signals inform sales enablement, content roadmaps, and launch plans so each asset moves a specific metric, not just a milestone.

    Operating cadence matters as much as the plan. I rely on empowered product teams and product trios to translate strategy into product roadmapping and sprint planning, ensuring every slice of the roadmap ties directly to market impact. Clear OKRs and QBRs keep the feedback loop tight, while field insights from enterprise pilots shape rapid iteration without losing strategic intent.

    Enterprise nuance is the difference-maker: longer cycles, multi-threaded buying committees, and higher switching costs demand precision. I design proofs of value that quantify outcomes early, align pricing and packaging with willingness to pay, and use customer evidence to de-risk decisions. The result is a scalable, repeatable system where positioning is consistent, the funnel is measurable, and revenue teams can predictably win with complex accounts.

    Ultimately, the work is about trust. When strategy, analytics, and storytelling lock together, customers see themselves in the product—and teams see themselves in the win. That is the heart of enterprise go-to-market done right.


    Inspired by this post on Amplitude – Perspectives.


    Book a consult png image
  • Unlocking the 7% Retention Rule: How Early Activation Fuels Compounding, Long-Term Growth

    Unlocking the 7% Retention Rule: How Early Activation Fuels Compounding, Long-Term Growth

    I’ve learned to spot durable growth early. When we launch something new, I look for one deceptively simple signal that predicts whether the product will compound or stall: the percentage of users who come back one week later. It’s a small number with big implications for product-led growth and retention analysis.

    Discover why 7% of users returning after one week signals long-term growth, and how early activation separates top-performing products from the rest.

    Why does this matter so much? A 7% day-7 retention floor tells me we’ve earned a second interaction from a meaningful slice of our cohort, not just a curiosity click. That’s the first hint of habit formation and repeatable value—evidence that onboarding, user activation, and the core value proposition are doing their job. When the curve holds at or above this threshold, growth investments tend to work harder because cohorts keep giving back.

    The lever behind that signal is early activation. I define the activation moment as the first time a new user experiences product value—sending a first campaign, integrating a CRM, or completing a workflow that solves their primary job. If we reduce time-to-activation and increase the activation rate, day-7 retention rises. This is where in-app guides, product tours, and thoughtful tooltip design shine: they remove friction without overwhelming the user.

    Instrumentation is non-negotiable. I set up event tracking and cohort analysis in tools like Amplitude analytics and Pendo, define a crisp activation event, and review retention curves by first-seen cohorts. We run A/B testing with a clear minimum detectable effect (MDE), validate improvements in activation and day-7 retention, and then double down. The objective is always outcomes over output: fewer features, more value delivered.

    Process matters as much as tooling. Product trios using continuous discovery keep us close to user problems, while empowered product teams move faster with context and clear outcomes vs output OKRs. When we connect these practices to a unified analytics view, it becomes obvious which changes move the 7% needle and which are noise.

    In practice, I’ve seen a launch turn the corner by clarifying the “aha” moment, cutting onboarding steps nearly in half, and swapping a generic walkthrough for contextual in-app guides. Activation jumped, day-7 retention crossed the threshold, and suddenly our PLG motion became efficient—paid acquisition started compounding instead of leaking.

    If you’re below 7%, start by tightening the activation definition, instrument the funnel, and remove the top three sources of friction. If you’re above 7%, stabilize it across segments, scale with targeted in-app guides, and keep iterating via A/B tests to protect that early win. Either way, the rule provides a clear, pragmatic checkpoint for product discovery and growth.

    The takeaway is simple: focus the team on earning the second visit. Nail early activation, then build repeatable systems that make the 7% retention rule your new baseline for confident, long-term growth.


    Inspired by this post on Amplitude – Perspectives.


    Book a consult png image
  • Stop the Leaky Bucket: Proven Moves to Turn User Growth into Durable Retention in 2025

    Stop the Leaky Bucket: Proven Moves to Turn User Growth into Durable Retention in 2025

    More signups are exhilarating—until the retention curve tells a colder truth. I’ve led launches where top-of-funnel spiked, only to watch active usage slide week over week. That’s the leaky bucket problem in action: acquisition outpaces activation, engagement, and retention, so net growth stalls.

    Losing users as fast as you acquire them? Get exclusive insights from our 2025 Product Benchmark Report on how to fix the leaky bucket problem and drive lasting growth.

    When I assess a product’s trajectory, I reframe the goal: our job isn’t to add users; it’s to create retained value. In product-led growth, durable growth comes from systematically increasing activation and Day 7/30 retention, not just traffic. That shift aligns teams on outcomes vs output and turns experiments into a compounding engine.

    Diagnosis comes first. I run a retention analysis by cohort in Amplitude analytics (and corroborate with Pendo for in-app behavior) to pinpoint where the flow breaks: sign-up, onboarding, first value, habit formation, or paywall. Then I define a crisp activation metric—what specific action within a time window predicts long-term engagement—and measure time-to-value for each segment.

    From there, we remove friction. Simplify onboarding, trim non-essential fields, and guide users to the “aha” with in-app guides, product tours, and contextual tooltips. Seed accounts with sample data, pre-built templates, and smart defaults so new users experience the core value in minutes, not days.

    We prove impact with disciplined experimentation. A/B testing with a clearly calculated minimum detectable effect (MDE) prevents false positives, while a continuous discovery cadence with product trios keeps us close to real customer problems. Every test is tied to leading indicators—activation rate, Day 1/7/30 retention, and weekly engaged usage—not vanity metrics.

    Activation does not live in product alone. Pricing and packaging, lifecycle messaging, and customer support all influence early habit formation. Align GTM and product on one retention-centric scorecard and instrument a unified analytics platform so every team sees the same truth.

    Once the core journey holds water, we layer in expansion: prompts that surface adjacent value at the right moment, educated upsells tied to outcomes, and permissions or collaboration features that invite team adoption. That’s how growth becomes efficient and compounding instead of brittle and expensive.

    If this resonates, you likely have more of a prioritization problem than a traffic problem. Fix activation, measure retention rigorously, and let acquisition follow. Patch the leaks, and growth stops being a hustle—and starts being a flywheel.


    Inspired by this post on Amplitude – Perspectives.


    Book a consult png image
  • Stop Chasing New Users: The Surprising ROI of Win-Back Campaigns That Actually Work

    Stop Chasing New Users: The Surprising ROI of Win-Back Campaigns That Actually Work

    Over the years, I’ve learned that the most overlooked growth lever isn’t a shiny new channel—it’s bringing back the customers we already earned. When I rebalanced budgets from top-of-funnel acquisition to reactivation, the payoff was faster, more predictable, and far more cost-efficient. Reactivation compounds because it’s built on trust, product familiarity, and data we already have.

    Discover why reactivating dormant users delivers better ROI than new acquisition. Learn how to identify and bring back at-risk users via targeted campaigns.

    Why does this work so well? Dormant users once saw enough value to sign up, activate, or even pay. The barriers to return are lower: familiarity reduces friction, time-to-value shrinks, and the cost to engage is a fraction of new-user CAC. In practice, I’ve seen win-back motions outperform new acquisition on payback time, expansion potential, and long-term retention—especially when we design the right triggers and messages.

    My approach starts with rigorous retention analysis. I define the behaviors that signal risk—declining frequency, shrinking session depth, stalled onboarding milestones, or missed “aha” moments—and map them to lifecycle stages. Using a unified analytics platform with CRM integration, I can see who’s drifting, when, and why. That clarity is the foundation for precision reactivation.

    On the tooling front, I lean on Amplitude analytics to surface cohorts and leading indicators, Pendo for in-app guides and nudges, and Intercom for lifecycle messaging and human-assisted outreach. The connective tissue is our CRM integration, which ensures we coordinate messages across email, in-app, and sales-assist without creating noise or duplication.

    Segmentation is where win-back campaigns gain power. I group users by their last successful use case, plan tier, activation depth, and the specific friction they hit. Cohorts often include “stalled onboarding,” “lapsed power users,” and “trial expired with partial success.” Each segment gets a distinct path back to value—never a one-size-fits-all blast.

    Targeted campaigns are then matched to the root cause. For stalled onboarding, I deploy product tours and in-app guides that remove a single key blocker. For lapsed power users, I emphasize newly shipped capabilities tied to their historical workflows. For price-sensitive cohorts, I test usage-based offers or limited-time boosts aligned to value realization, not discounting for its own sake. Every flow is A/B testing-driven and time-bound, with clear exit criteria.

    Measurement goes beyond “did they log in.” I track reactivation rate, feature adoption depth, time-to-value, and near-term expansion signals. Holdout groups validate lift, and we set guardrails so campaigns don’t cannibalize healthy cohorts. Over time, these learnings inform product roadmap decisions—what to simplify, what to sunset, and where to invest to prevent churn in the first place.

    Operationally, I embed win-back into product-led growth rhythms. Product, data, lifecycle marketing, and support align on weekly reviews, using shared dashboards to tune triggers and content. This creates a reliable growth engine that respects user intent and avoids the trap of overmessaging.

    Finally, trust matters. I build reactivation with privacy-by-design principles, transparent value propositions, and easy opt-outs. The goal isn’t to “get the login”—it’s to restore momentum toward outcomes the user cares about.

    If you’re feeling acquisition fatigue, shift a meaningful slice of budget and attention to reactivation. In my experience, it delivers faster wins, better unit economics, and a healthier product that keeps more of the customers you worked so hard to earn.


    Inspired by this post on Amplitude – Perspectives.


    Book a consult png image
  • Slash Time to Value to Skyrocket Retention: A Proven Playbook for Faster Impact

    Slash Time to Value to Skyrocket Retention: A Proven Playbook for Faster Impact

    I’m relentlessly focused on time to value because it’s the fastest, most reliable lever I have to drive user retention and product-led growth. When new users experience an unmistakable win quickly, they stick around, explore deeper features, and become advocates. When they don’t, the best onboarding or marketing can’t save the experience.

    Accelerate retention by reducing time to value. Learn how faster product impact drives growth, reduces costs, and keeps users engaged in the long term.

    Here’s how I define it in practice: time to value (TTV) is the elapsed time between a user’s first meaningful interaction and the first moment they feel the product’s core value. That “aha” moment is not a vanity milestone; it’s a measurable behavior that correlates with long-term retention in your retention analysis and cohort curves.

    In my role leading product teams at HighLevel, I treat TTV as a leading indicator for retention and expansion. It shapes our product discovery, influences our value proposition, and anchors our outcomes vs output OKRs. If a roadmap item doesn’t shorten TTV or deepen recurring value, it rarely makes the cut.

    My playbook for reducing TTV starts by identifying the activation metric—what’s the smallest observable action that best predicts retention? For a messaging product it might be sending the first message to three contacts; for a workflow tool, publishing the first automated flow. Once this activation is clear, the job becomes simple: engineer the shortest, most delightful path to that outcome.

    Next, I eliminate onboarding friction. I default to progressive profiling instead of long forms, ship sensible defaults, preload sample data, and offer ready-to-use templates. I complement this with lightweight in-app guides, product tours, and well-timed tooltip design—just enough guidance to build momentum without overwhelming the user.

    To validate changes, I rely on rigorous experimentation. A/B testing with a defined minimum detectable effect ensures we’re not overfitting noise. I track activation rate, time to first value, feature adoption, and day 7/30 retention. If an experiment improves activation but hurts short-term retention, I dig into the “why” with session replays, targeted surveys, and follow-up interviews.

    This approach also reduces costs. Faster activation lowers support volume, decreases onboarding hand-holding, and shortens payback periods. On the GTM side, TTV-aligned messaging clarifies our value proposition, improving conversion quality and reducing churn from poorly qualified signups.

    Cross-functional alignment is essential. Product, design, engineering, and customer success must agree on the definition of value, the activation metric, and the telemetry required to measure progress. I use product trios to maintain discovery momentum and ensure decisions connect cleanly to measurable outcomes.

    A practical 30/60/90 plan helps teams move fast. In the first 30 days, define activation, instrument analytics, and map the current journey. By day 60, ship friction-killing improvements, launch in-app guides, and run your first A/B tests. By day 90, refine templates, tighten empty states, and codify wins into the onboarding system so improvements compound.

    The biggest pitfall I see is chasing more features instead of more value, faster. When we focus on shortening the path to a single compelling outcome—and proving it with data—retention follows. Users don’t need more; they need the right result sooner.

    If you’re serious about retention, make time to value your team’s most visible operating metric. Shine a bright light on it in weekly reviews, tie it to goals, and celebrate every step that helps users succeed faster. Do this consistently, and you’ll see growth accelerate, support costs drop, and engagement deepen in ways that are both measurable and enduring.


    Inspired by this post on Amplitude – Perspectives.


    Book a consult png image
  • Enterprise GTM Mastery: How I Partner with Product Marketers to Drive Adoption at Scale

    Enterprise GTM Mastery: How I Partner with Product Marketers to Drive Adoption at Scale

    I spend a lot of time turning strong product capabilities into enterprise wins, and that almost always starts with a tight partnership between product management and product marketing. The most effective go-to-market strategy is built where customer insight, product value, and revenue goals intersect—and product marketers are the connective tissue that makes this real.

    “Michele Morales is a product marketing manager at Amplitude, focusing on go-to-market solutions for enterprise customers”

    In my experience, partnering with product marketing leaders on enterprise go-to-market means aligning early on the ICP, the value proposition, and the differentiated messaging that sales can activate. We map buyer committees, refine product positioning against points of parity and competitive differentiation, and ensure our narrative translates cleanly from website to demo to proof-of-concept.

    For data-driven execution, I lean on Amplitude analytics and a unified analytics platform approach to validate our hypotheses. We set clear activation and adoption milestones, monitor user activation cohorts, and close the loop with retention analysis to understand which messages and features actually move enterprise accounts from trial to expansion. This is where product-led growth complements sales-led motions, giving us empirical signal across the funnel.

    On the launch front, we pressure-test enablement and in-product experiences together: crisp messaging frameworks, in-app guides, and product tours that shorten time-to-value for complex enterprise use cases. The result is a go-to-market strategy that’s both technically accurate and emotionally resonant—clear enough for executives and actionable for end users.

    What consistently works: start with real customer pain, express value succinctly, and make the path to first success obvious. Then instrument everything. When product, marketing, and sales can all see the same truth in the data, empowered product teams iterate faster, positioning sharpens, and adoption compounds.

    This approach respects the craft of product marketing while grounding decisions in measurable outcomes. It’s how we turn a promising roadmap into repeatable enterprise impact—and why close PM–PMM collaboration remains one of my most reliable growth levers.


    Inspired by this post on Amplitude – Best Practices.


    Book a consult png image
  • Unlock Instant Product Answers: How AI-Powered Resource Centers Elevate In‑App Help

    Unlock Instant Product Answers: How AI-Powered Resource Centers Elevate In‑App Help

    I’ve spent years watching users bounce between product screens, docs, and support tickets when they hit a roadblock. The fastest path to value is always the same: deliver relevant, contextual help exactly when and where the user needs it. That’s why I’m excited about the next wave of in-app guidance that blends behavioral data with AI to anticipate intent and remove friction in real time.

    Announcing Resource Centers, Amplitude’s newest in-product help feature that uses behavioral data and AI to serve help content users actually need.

    Here’s why that matters. In a product-led growth model, in-app guides, product tours, and just-in-time tips are essential to onboarding and user activation. When help content is informed by real behavioral signals—events, cohorts, milestones—it stops being a static knowledge base and becomes a living system that adapts to a user’s journey. That means fewer context switches, faster time-to-value, and more confident users who can self-serve their way to outcomes.

    In practice, the most effective resource centers are opinionated and contextual: they surface content by role, plan, and lifecycle stage; trigger nudges based on key events; and offer multiple modalities (microcopy, short clips, interactive guides) so users can choose how they learn. They also respect pacing, avoiding notification fatigue with rate limits and prioritization rules. Think of this as high-quality UX writing paired with data-driven orchestration—useful, discoverable, and never in the way.

    Execution matters. Start with a clear content taxonomy, map help assets to journey stages, and establish a content ops cadence so guides stay fresh. Partner closely with data governance to ensure privacy-by-design and transparent consent for behavioral data usage. Then wire in feedback loops—thumbs up/down, quick polls, and session replays—so you can continuously discover gaps and iterate quickly.

    Measure impact with the same rigor you apply to product features. Track activation rates, time-to-first-value, self-serve resolution rates, reduction in ticket volume on targeted topics, and downstream retention. Use A/B testing to validate which interventions move the needle, and segment results to learn what works for new users versus power users. When results differ, treat that as a design signal—not a failure—and refine the targeting.

    Rollout thoughtfully. Pilot with a high-friction workflow, localize the help content to the user’s context, and set clear exit criteria before scaling. Align with customer support and success so your resource center becomes the canonical source for in-app help, not yet another content silo. Over time, unify insights across Amplitude analytics and your support stack to close the loop between product behavior and help outcomes.

    As product leaders, our goal is simple: reduce effort and increase confidence for every user. AI-assisted, behaviorally triggered resource centers are a pragmatic step toward that future—meeting users where they are, with exactly what they need, at the moment they need it.


    Inspired by this post on Amplitude – Best Practices.


    Book a consult png image
  • Sharper Signals, Stronger Collaboration: How Session Replay Accelerates Problem Solving

    In fast-moving product cycles, weak signals slow teams down and let avoidable issues linger. I’ve been leaning on Session Replay to strengthen those signals and align stakeholders faster, especially when we’re balancing roadmap bets with day-to-day reliability fixes.

    Discover how frustration analytics, error analytics, and shareable filters in Session Replay help you spot problems faster and collaborate more effectively.

    Frustration analytics has become my shortcut to the moments that truly matter. Instead of sifting through countless replays, I start where friction peaks and focus on the sessions that best represent real user pain. In one onboarding flow, these insights pointed us to a confusing step that was suppressing user activation; a simple adjustment to the layout and copy led to higher completions and fewer support tickets.

    Error analytics turns anecdotes into evidence. By pairing error trends with conversion and retention analysis in Amplitude analytics, we isolate the defects with the highest customer and revenue impact. That clarity helps my team sequence fixes in sprint planning with confidence—and it gives leadership a clean narrative for why certain issues deserve priority now.

    Shareable filters have been a quiet superpower for cross-functional collaboration. I create saved views for specific cohorts—first-time users, power users, or high‑value accounts—so engineering, design, and support can reproduce exactly what I’m seeing in Session Replay. No more screen recordings in Slack or back-and-forth on “what filters did you use?” Everyone starts from the same context and moves to decisions faster.

    This workflow fits naturally into how our product trios practice continuous discovery. We pick one question each week, open a shared filter, and review a handful of targeted sessions together. Within the same unified analytics platform, we connect what we observe to metrics that matter, then translate insights directly into product roadmapping and sprint planning without losing momentum.

    If your goal is sharper detection of issues and stronger collaboration across stakeholders, these capabilities deserve a place in your toolkit. They compress time-to-insight, improve stakeholder management, and fuel product-led growth by focusing attention where it delivers the most customer value.


    Inspired by this post on Amplitude – Best Practices.


    Book a consult png image
  • Stop Waiting—Run A/B Tests 3X Faster with Powerful Self‑Service Experimentation

    Stop Waiting—Run A/B Tests 3X Faster with Powerful Self‑Service Experimentation

    I’ve spent enough cycles in product and growth to know the biggest drag on experimentation velocity isn’t creativity—it’s waiting. Waiting for engineering to wire events, for analysts to pull cohorts, for approvals to trickle in. When marketers can move autonomously with the right guardrails, learning accelerates and impact compounds.

    “Amplitude’s new web experiment capabilities enable teams to scale experimentation 3X faster without waiting for help.” That promise hits directly at the bottlenecks I see most often across product and marketing organizations.

    My takeaway: the real unlock isn’t only speed; it’s confidence. Faster learning loops power continuous discovery and product-led growth, but only if teams trust the data, align on success metrics, and can iterate without creating downstream tech debt. Self-service done right transforms scattered tests into a durable growth engine.

    From a VP of Product lens (and what we practice at HighLevel), self-service experimentation means more than a new UI. I look for governance-by-design, role-based permissions, clear metric definitions, pre-built test templates, and operational best practices like minimum detectable effect (MDE) sizing and traffic allocation standards. That mix keeps A/B testing fast, statistically sound, and repeatable—without piling work onto engineering.

    Here’s the playbook I recommend to teams leaning into this shift: instrument a unified analytics platform and lock a shared taxonomy; define canonical success metrics and guardrails; require lightweight pre-registration for hypotheses and MDE; stand up weekly experiment reviews; and close the loop by sharing learnings in-product and across go-to-market. When marketers, PMs, and designers operate as an empowered product trio, the flywheel spins.

    To maximize value from any web experimentation stack—Amplitude analytics included—connect the dots from insight to activation. Tie experiments to CRM integration for downstream campaigns, ensure user activation metrics are first-class citizens, and keep your experimentation backlog aligned to outcomes, not outputs. The goal is fewer opinions and more evidence, shipped continuously.

    Self-service also requires culture. Set expectations around statistical rigor, data governance, and post-test decisions, then celebrate the teams that sunset ideas just as quickly as they scale winners. That’s how you reduce waste, build confidence, and keep momentum high without creating hidden operational costs.

    If your marketers are still waiting in ticket queues, it’s time to raise the bar. With the right foundations and process, you can go from idea to live test in hours, not weeks—learning more, shipping smarter, and unlocking 3X faster cycles where it matters most: customer value.


    Inspired by this post on Amplitude – Best Practices.


    Book a consult png image
  • How Amplitude AI Feedback Turns Noise into Product Signal You Can Ship With Confidence

    How Amplitude AI Feedback Turns Noise into Product Signal You Can Ship With Confidence

    I’ve spent enough time in the trenches of product management to know the hardest part isn’t collecting feedback—it’s separating signal from noise. When every channel is buzzing, the real question becomes: what should we build next, and why? That’s where Amplitude AI Feedback has changed how I work. It gives me a disciplined, data-informed way to turn messy qualitative input into clear, defensible roadmap decisions.

    Learn how Amplitude AI Feedback leverages AI to transform massive volumes of customer feedback into actionable product insights.

    In practice, this means I can synthesize input from support tickets, NPS responses, user interviews, sales notes, and reviews—then connect those insights to product behavior data from Amplitude analytics. The result isn’t just a list of requests; it’s a ranked problem set grounded in evidence, which makes product discovery and continuous discovery faster, clearer, and less biased.

    A recent example: we were hearing recurring complaints about onboarding friction, but it wasn’t obvious which steps truly mattered. By pairing feedback themes with activation and retention signals, I could zero in on the first-session setup tasks that correlated with drop-off. That clarity guided product roadmapping and sprint planning decisions we could stand behind, and it accelerated user activation without bloating the backlog.

    My workflow is straightforward: aggregate feedback, cluster themes, validate with behavioral metrics, and translate insight into outcomes. I look for patterns tied to user activation, retention analysis, and moments that drive product-led growth. When the evidence shows a request is both frequent and high-impact, it earns a place on the roadmap; when it’s loud but low-impact, it becomes a targeted experiment rather than a default commitment.

    What I appreciate most is the confidence this brings to stakeholder conversations. Instead of debating opinions, we review the evidence: quantified themes, clear user stories, and measurable KPIs. That turns “Finally, Signal That Tells You What to Build” from a slogan into an operating principle, and it helps empowered product teams move faster with fewer reversals.

    If you’re building your AI Strategy or exploring LLMs for product managers, this is one of the highest-leverage moves you can make: use a unified analytics platform to connect qualitative feedback with quantitative behavior. It sharpens prioritization, improves time-to-learning, and keeps the team focused on outcomes—not outputs.


    Inspired by this post on Amplitude – Best Practices.


    Book a consult png image