Inspired by this post on The Intercom Blog.

Inspired by this post on The Intercom Blog.
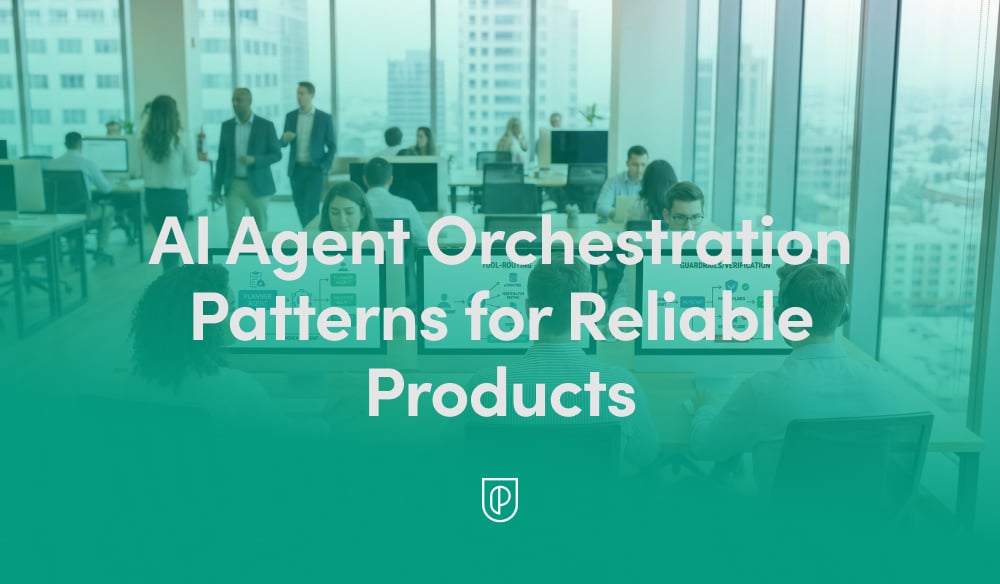
Shipping agentic AI into production is exhilarating—until a flaky output torpedoes trust. Over the past year, I’ve led teams at HighLevel to operationalize agents across customer-facing and internal workflows, and I’ve learned that reliability isn’t an afterthought; it’s an architecture. In this piece, I share the AI Agent Orchestration Patterns for Reliable Products that consistently deliver dependable outcomes at scale.
When we talk about orchestration, we’re talking about more than a single prompt. The shift is from monolithic calls to coordinated “agentic AI” where routers, planners, and specialists collaborate through structured “AI workflows.” In practice, I rely on a few canonical patterns: a planner–executor loop for multi-step tasks, a router–specialist setup for skill selection, and a “retrieval-first pipeline” that grounds generation with authoritative context before a single token is produced.
Reliability-by-design starts with typed inputs/outputs and strict validation. I standardize on JSON schemas, enforce tool/function signatures, and implement idempotency keys so retries don’t wreak havoc on downstream systems. Timeouts, circuit breakers, and backpressure protect the platform under load, while rate limiting and dead-letter queues keep failure modes contained. Most importantly, we engineer graceful degradation: agents “abstain” when uncertain, fall back to deterministic paths, and escalate to humans instead of guessing.
Safety is a first-class concern, not a bolt-on. Our “AI risk management” pipeline includes PII redaction, allow/deny lists for tools and data, and the principle of least privilege for every connector (yes, even the ChatGPT connector). We codify policy-as-code for repeatability and require human-in-the-loop approvals for sensitive or irreversible actions. In my experience, clear red lines and reversible defaults prevent the vast majority of regrettable outcomes.
Without strong “observability,” you’re flying blind. I instrument agents with an “Agent Analytics” layer that captures traces, spans, tool invocations, and token usage across the entire chain. The essential metrics are outcome quality (task success rate), latency (p50/p95), tool failure rates, cost per task, and user-level satisfaction signals. Cross-agent lineage allows us to pinpoint where a plan went awry and which tool or prompt introduced drift—vital for rapid remediation.
Quality improves fastest when it is measured relentlessly. I practice “eval-driven development” with golden datasets, rubric-based scoring, and risk-weighted sampling of edge cases. LLM-as-judge can help, but we always calibrate against human ratings and monitor agreement. In production, I blend online metrics with controlled “A/B testing” and plan experiments to hit a realistic minimum detectable effect (MDE). The result is a virtuous loop where prompt tweaks, tool changes, and retrieval adjustments are verified before wide rollout.
Agents need the same rigor we expect from any modern system. I gate releases through “CI/CD” with linting for prompts, schema checks for tools, and simulation runs for critical paths. “Feature flags” enable shadow and canary deployments so we can throttle exposure by segment or workflow. I also track reliability with “DORA metrics” and “deployment frequency,” and I partner closely with “SRE” for on-call coverage, runbooks, and incident postmortems tailored to agent failure modes.
Context is a resource to allocate, not a bottomless pit. Thoughtful “context window management” means curating retrieval, summarizing long-running threads, setting memory time-to-live, and constraining what the agent can see at any given step. I bias hard toward retrieval over recall, keep chunks small and semantically precise, and validate that the “retrieval-first pipeline” truly returns the right evidence—not just the nearest match.
In day-to-day product work, I lean on a compact playbook: a router that selects the best specialist; a planner that decomposes tasks and allocates tools; a deterministic guard that verifies preconditions; an execution loop with explicit budgets; and a fallback policy that prefers abstaining over hallucinating. Together, these patterns create an agent that behaves like a dependable teammate rather than a creative wildcard.
No architecture thrives without the right rituals. Product trios keep discovery continuous, while clear outcomes (not output) align teams on value instead of vanity. We map risks early, maintain a public quality dashboard, and rehearse failure recoveries so incidents never become improvisations. The cultural signal is simple: we celebrate root-cause clarity and safe iteration over heroics.
If you’re just starting, implement three patterns first: retrieval before generation, abstain-and-escalate for low confidence, and canary releases under feature flags. Instrument everything from day one, run a weekly eval review, and expand scope only when the data says you’re ready. With these habits, your agents will earn user trust—and keep it.
Inspired by this post on Product School.

Where is the true boundary between product and engineering—and what happens when it gets blurry? I’ve led and coached teams through this question many times, and I’ve learned that clarity here isn’t just a nice-to-have; it’s foundational to quality, velocity, and team health.
I’ve seen well-intentioned product managers step in to “help” by taking ownership of bug triage, tech debt prioritization, or even system architecture. At first, it feels productive. Over time, it creates role confusion, slows decision-making, and burns out PMs—while paradoxically lowering engineering quality. The “CEO of the product” myth and legacy IT, project-based mindsets are usually at the root. Treating engineers as “order takers” breaks down in evergreen product environments.
The healthiest collaboration model is simple and disciplined: The product trio owns the “what”; engineering owns the “how”. Product managers are not people managers for engineers—and shouldn’t be accountable for engineering quality. Our job is to frame the problem, align on outcomes, and continuously discover value with customers—not to supervise technical execution.
If quality is a problem, the solution is escalating and fixing the system, not managing individual bugs. In practice, that means surfacing patterns and elevating them to engineering leadership, who can address root causes—staffing, skills, code health, CI/CD gaps, observability, or process design—rather than asking PMs to paper over issues with status updates. This keeps accountability where it belongs and reinforces outcomes vs output OKRs.
One high-leverage move is to remove unnecessary intermediaries. Removing the PM as a middleman creates better flow and clearer ownership. Create direct paths for stakeholders to get bug status without routing everything through product. Use dashboards, shared tools, or Slack channels instead of one-off updates. In my teams, shared Jira views, Slack incident channels, and status pages eliminated handoffs, improved stakeholder management, and gave engineers the space to solve problems end-to-end.
Strong engineering leadership is non-negotiable. What strong engineering leadership should own (and why that matters) is the technical system, quality guardrails, sustainable pace, and the practices that uphold them—incident management, code review rigor, test coverage, and SLOs with SRE. Skilled engineering teams naturally push back when boundaries are crossed—and that’s a good thing. It signals ownership, craft pride, and a pathway to durable execution.
When do I step in as product? Primarily to clarify desired outcomes, sequencing, and trade-offs—bringing customer and business context to the table. I structure product roadmapping and sprint planning around value slices and risks, not task lists. I align on decision rights early: architecture and tech debt strategies live with engineering; product strategy, positioning, and success metrics live with product; discovery and prioritization live with the product trio.
Here are the system-level moves I’ve found most effective: Escalate systemic quality issues to engineering leadership, not individual contributors. Advocate for real engineering leadership if your org expects product teams—not IT teams. Then reinforce a culture of continuous discovery so product, design, and engineering make better upstream decisions together. This is how empowered product teams ship higher-quality outcomes—without burning anyone out.
If you’ve ever found yourself acting as the middleman for bug status or being asked to “own” engineering decisions outside your expertise, you’re not alone. Reset the boundaries, make work visible, and double down on shared outcomes. In my experience, the moment we clarify roles and remove status theater, quality rises, cycle time improves, and everyone does the job they were hired to do—better.
Inspired by this post on Product Talk.

Your AI feature can be online, fast, and still be failing. A report renders but omits important records. A workflow returns valid JSON with the wrong meaning. A retry creates a duplicate. A permissions change quietly removes the data needed for a trustworthy answer.
If you own an AI product, an uptime dashboard cannot tell you whether users are receiving the outcome you promised. You need a reliability system that covers data, models, runtime dependencies, output quality, delivery, and recovery. The practical goal is not to eliminate every failure. It is to detect meaningful failures early, contain their impact, and recover without making the situation worse.
Traditional service reliability often starts with a relatively clean question: did the request succeed? AI products make that question insufficient. A request can return a success status while the user receives an incomplete, structurally invalid, stale, unauthorized, or semantically poor result.
The failures worth designing for include small schema changes in non-deterministic output, silent permission changes, token-limit truncation, burst-driven rate limits, and clock skew affecting idempotent writes. None requires a total outage. Each can still break the product promise.
Start by writing a reliability contract for one important user journey. State what must be true when that journey succeeds. A useful contract usually covers these dimensions:
| Reliability dimension | Question to answer | Evidence to capture |
|---|---|---|
| Completion | Did the workflow reach a terminal outcome? | Completed, rejected, timed out, cancelled, or still pending |
| Structural validity | Does the output satisfy the interface expected downstream? | Schema-validation result, schema version, and rejection reason |
| Data integrity | Was the required data accessible, current, and complete enough for the task? | Data-source status, permission result, retrieval result, and freshness signal |
| Semantic quality | Is the answer useful and acceptable for this use case? | Evaluation result by task, customer segment, language, or workflow |
| Latency | Did the outcome arrive while it was still useful? | End-to-end latency and latency for each pipeline stage |
| Delivery integrity | Was the result applied once, without duplication or corruption? | Idempotency key, write status, attempt count, and final state |
| Privacy and risk | Did processing respect the product’s data-handling rules? | Policy checks, PII-scanning result, access decision, and exception path |
This contract prevents an easy but damaging mistake: counting technically completed requests as successful user outcomes. If a report is truncated yet parseable, the transport succeeded and the product failed. If a model response is excellent but based on data the user can no longer access, the answer should not be delivered as a success.
Turn the contract into service-level indicators that the system can measure. Then set service-level objectives around the indicators that matter to the user. The difference between the objective and actual performance becomes the error budget available for change and experimentation.
Do not hide behind a global average. Break reliability down by model, prompt version, schema version, dataset, workflow, customer segment, and dependency. AI failures are often concentrated. A healthy aggregate can conceal a severe regression for one language, one integration, or one high-value workflow.
Your error budget should also drive decisions. When budget consumption accelerates, narrow the rollout, pause the risky change, or redirect capacity toward the failure path. When the budget is healthy, you have evidence that the product can absorb controlled experimentation. That is more useful than declaring reliability important while allowing roadmap pressure to settle every tradeoff.
A useful AI trace does not stop at the model call. It follows the user request through authentication, permission checks, data retrieval, context assembly, model execution, output validation, business rules, persistence, and delivery. Give the journey one correlation identifier so an engineer can move from a failed user outcome to the responsible stage without reconstructing the request from unrelated logs.
Build visibility at three levels:
Keep raw customer data, prompts, and model responses out of routine telemetry unless there is a defined and approved need to retain them. Structured metadata is usually enough for operational diagnosis. When content must be inspected, apply access controls, retention rules, redaction, and PII scanning as part of the observability design. Logging sensitive data first and deciding how to govern it later creates a second reliability problem: the monitoring system becomes a source of risk.
Design failure codes around actions, not organizational boundaries. Invalid model output, missing source permission, provider throttling, exhausted token budget, duplicate delivery, and policy rejection tell the responder what kind of path failed. A generic model error or integration error forces the on-call person to rediscover information the system already had.
Alerts should represent conditions that require intervention. Error-budget burn, broad validation failures, growing queue age, or a dependency circuit remaining open may justify an immediate response. A slow-moving change in evaluation performance may belong in a product review instead. If every anomaly pages someone, the monitoring system trains the organization to ignore it.
The same dashboard should work for product and engineering. An SRE needs the failing dependency and trace. A product leader needs the affected workflow, segment, volume, and user consequence. Connecting both views prevents a team from fixing the loudest technical symptom while a quieter failure causes more product damage.
Most AI workflows combine components with different failure behavior: internal services, databases, queues, retrieval systems, model providers, and third-party data sources. Reliability comes from controlling the boundary around each component. The following sequence gives you a practical hardening checklist.
These controls need an explicit order of operations. Validate permissions before retrieving sensitive data. Validate generated output before executing a side effect. Persist idempotency state before acknowledging completion. Apply retry policy after classifying the failure. Ordering is what prevents individually sensible mechanisms from undermining one another.
Be careful with graceful degradation. It is useful when the degraded state remains honest and valuable, such as delaying a non-urgent report or identifying an unavailable data source. It is dangerous when the system silently substitutes stale, incomplete, or lower-quality information and presents it as equivalent. The user must be able to distinguish degraded output from normal output.
A prompt edit can change output structure. A model change can improve one task while weakening another. A retrieval change can alter both answer quality and latency. Treat these modifications as production changes even when no application code changed.
An eval-driven release path should work like this:
The release gate needs product judgment. Not every evaluation failure carries the same consequence. A formatting defect in an internal draft is different from an unsupported claim in a customer-facing recommendation or an unauthorized action by an agent. Define which failures block release, which require human review, and which can be monitored after release.
Do not force a choice between delivery speed and reliability without evidence. Track deployment frequency alongside change failure rate. Frequent, small, reversible releases can improve both learning speed and recovery. Large bundled changes make it harder to identify the cause of regression and increase the amount of behavior a rollback must undo.
Before approving an AI release, a product leader should be able to answer five questions:
If those answers are missing, the release is relying on optimism rather than a control system.
Technical safeguards decay unless ownership and operating routines keep them current. Models change, integrations evolve, permissions move, and traffic develops new burst patterns. Reliability therefore belongs in roadmap and incident decisions, not in a one-time infrastructure project.
Prepare a lightweight runbook for each critical journey. It should identify the owner, user-visible failure states, primary indicators, relevant dashboards, recent release controls, dependency status, safe disable path, and rules for replaying work. A responder should not have to infer whether replay can duplicate a message, report, charge, or external action.
During an incident, establish the user impact before chasing every technical symptom. Identify the affected workflow and segment, stop further harm, preserve evidence, and use the safest available rollback or containment control. Communicate whether results are delayed, incomplete, unavailable, or at risk of duplication. Those states require different user actions.
Afterward, use a blameless review to find the conditions that allowed the failure to reach users. The strongest follow-up actions are testable and automatable: a new schema check, an evaluation case, a permission metric, a retry limit, a canary gate, a better idempotency key, or a rehearsed rollback. An instruction to be more careful is not a control.
Prioritize the reliability backlog by user consequence and error-budget impact. A noisy internal exception with no lost outcome may matter less than a silent data omission affecting a small but important workflow. This keeps observability from becoming a competition to reduce whichever counter is easiest to move.
Privacy-by-design and AI risk management belong in the same operating system. Add PII scanning, access validation, and policy checks to the pipeline and release gates. Assign owners for exceptions. Revisit the controls as the product gains new data sources or actions. Risk is a continuing product constraint, not a review performed after the architecture is settled.
Choose your highest-consequence AI journey and write its reliability contract. Trace it end to end, attach an SLO to the user outcome, and replay the known failure modes against the controls you already have. If the system cannot tell you whether its output was valid, complete, permitted, and delivered once, that is the first reliability gap to close.

“Speed is not the enemy of safety; it is the prerequisite for it.” I live by this principle. In our organization, the average time from merging code to it being used by customers in production is just 12 minutes, and that short window is fundamental to how we build, ship, and learn.
In January 2026, we are averaging 180 ships per workday – roughly 20 deployments every hour. Conventional wisdom suggests that to increase stability, you must slow down. I believe the opposite. Speed is not the enemy of safety; it is the prerequisite for it. Accumulating code creates risk; shipping small batches minimizes it. Shipping is our company’s heartbeat.
Maintaining this frequency while targeting 99.8+% availability has required over a decade of focused investment in systems, principles, and processes. We protect the integrity of our systems through three layers of defense: an automated pipeline that is simple, reliable, and removes the need for manual intervention, a shipping workflow that promotes ownership and uses guardrails as accelerants, and a recovery model that optimizes for mitigating inevitable failures. Here’s how we’ve built each layer so that velocity is our greatest source of stability.
While our platform consists of various services and frontend applications, I’ll focus here on our Ruby on Rails monolith. It is our core application and the one we deploy most frequently; we also deploy it to three different data‑hosting regions with independent pipelines. Our other services follow similar pipeline principles and safeguards, but the Rails monolith is the clearest example of how we ship at scale.
The automated pipeline is designed to move code from merge to production as fast as possible while enforcing strict safety checks. It is fully automated, and the vast majority of releases require no human intervention—critical for CI/CD at high deployment frequency.
Once an engineer merges code to GitHub, two things happen immediately. First, the build: we compile the Rails application and its dependencies into a deployable asset (a slug) in about four minutes. Second, parallel CI: our test suite runs alongside the build; through extensive optimization, parallelization, and test selection, the vast majority of CI builds finish in under five minutes.
As soon as the slug is built, it’s deployed to a pre‑production environment. CI does not block the progression of the slug to pre‑production. Deploying to pre‑production takes around two minutes. This environment serves no customer traffic, but it is connected to our production datastores, mirrors our production infrastructure variants (e.g., web serving, asynchronous worker), and is configured so that requests exercise the pre‑release code and workers.
Immediately after deployment, we run and await several automated approval gates. We verify that the application boots cleanly on hosts (boot test), confirm the parallel test suite passed (CI check), and execute functional synthetics using Datadog Synthetics on critical flows—such as loading or editing a Fin workflow. If any gate fails, the release is halted and does not go to production.
Once approved, we promote the code to thousands of large virtual machines. A deployment orchestrator triggers these deployments simultaneously, while a decentralized, staggered rollout avoids changing the state of the entire fleet at the same millisecond. Within each machine, a rolling restart mechanism removes a process with old code from the serving path, lets it drain gracefully, and replaces it with a fresh process running the new code. From the moment a deployment starts, first requests are served by new code within roughly two minutes, and the vast majority of the global fleet updates transparently within six minutes. When restarts trigger on every machine, production unblocks so the next deployment can begin.
We treat a stalled pipeline as a high‑priority incident. If the automated system rejects three consecutive release attempts, it pages an on‑call engineer. These are pre‑production blocks, but if the shipping lane stops moving, changes pile up—and our stability relies on building and shipping in small steps. The on‑call’s job is to restore flow so that tiny, safe, frequent updates continue to keep risk low.
Our shipping workflow is built on extreme ownership: tools assist, but the engineer is accountable for quality and the decision to merge. I insist that you are present when you ship. The practical benefit of a 12‑minute deployment cycle is that engineers remain in the zone, focused on the problem they just solved, and ready to validate behavior as it goes live.

To support this, our deployment system sends Slack notifications the moment code is submitted and as it advances through stages, embeds direct observability links to relevant dashboards and logs in every PR and message, and prompts verification so engineers actively watch the dials and test features in production. It is not acceptable to rely on green builds. You’re expected to watch your change go live and if you’re not prepared to rollback, you’re not prepared to ship. We maintain a no‑blame culture: quick rollbacks and immediate reverts are signs of vigilance and ownership, not failure.
We make extensive use of feature flags to turn deployment into a non‑event. By decoupling deployment (moving code to servers) from release (turning features on), we shrink the blast radius of change. Flags can be enabled for all customers, a specific subset, or disabled for everyone in under 60 seconds through our backend UI. Engineers can group flags into beta features and run phased rollouts; we also ensure flags work consistently across non‑monolith applications. In the past three months, we created over 560 flags—and we actively manage them to avoid permanent complexity.
For complex refactors—especially when behavior should not change—we leverage GitHub Scientist, an open‑source experimentation library. It runs candidate logic (new code) in parallel with existing logic (old code) in production, instruments both paths for result and timing comparisons, and keeps existing behavior user‑visible. That means we can iterate on and validate new code under real load without risking the experience, then switch seamlessly when confident.
When engineers need to go deeper before merging, they can generate a slug and deploy it to a virtual machine, detaching a running production host from the serving path and connecting for manual testing. They can also put a pre‑release slug on a serving machine that handles a small percentage of jobs or web requests. Single‑host validation lets us slice observability to those hosts, compare against the main release, and make low‑level changes safer. Staging is a simulation; production is reality. Testing on a single production host validates assumptions with real‑world data without risking the fleet.
Our recovery model starts from a simple principle: stop monitoring systems; start monitoring outcomes. Traditional monitoring tells you if a server is healthy; we care whether customers are healthy. We rely on heartbeat metrics—vital signs that represent the core value our product provides—such as the rate at which messages and comments are created.
Unlike standard uptime checks, heartbeat metrics are binary in spirit. If message send rates dip below baseline, it does not matter if infrastructure dashboards are green. Down is down, and if customers can’t do their job, uptime percentages are irrelevant. By tracking real‑world success rates as a high‑level signal, we catch subtle degradations that traditional alerting either misses or over‑alerts on.
Because we ship in small, incremental steps and maintain previous releases on our virtual machines, our Time to Recover (TTR) is generally very fast. If a heartbeat metric drops or a critical anomaly is detected right after a ship, the system can trigger an automatic rollback, reverting to the release that was running 20 minutes ago—often restoring service before an engineer responds. For complex issues, engineers can initiate a manual rollback through our deployment UI; doing so also locks the production pipeline to prevent further releases while we investigate and remove problematic code.
Resumption of service is not the end. Every incident prompts an incident review, and we don’t just fix the bug. We ask, “How did the machine allow this to happen?” Then we harden the system so it cannot happen again. This loop—fast shipping, fast recovery, rigorous learning—compounds resilience over time.
This operating model aligns to DORA metrics: high deployment frequency, short lead time for changes, low change failure rate, and rapid time to restore service. It’s a CI/CD and SRE‑informed approach that converts speed into a defensive advantage rather than a liability.
Shipping 180 times a day isn’t a vanity metric; it’s a deliberate choice to protect the customer experience. With a 12‑minute window from code to customer, the feedback loop is tight and engineers retain context—and accountability—for the immediate impact of their work. Maintaining this pace requires more than fast CI; it requires judgment, extreme ownership, disciplined use of feature flags, and a recovery model that monitors outcomes. We rely on human expertise, augmented by these layers of defense, to catch issues before they turn into customer pain. We don’t ship fast despite our need for stability; we ship fast to stay in control of change.
Inspired by this post on The Intercom Blog.

I build and scale analytics platforms with a product mindset, and the work starts with the "middleware and compute systems that power analytics at scale." In platforms like Amplitude analytics and other unified analytics platform architectures, that foundation is what makes everything else possible.
Day to day, I oversee the "APIs behind charts, cohorts, and metrics—driving performance, reliability, and platform scalability." When those APIs are fast and resilient, every product team—from growth to customer success—can trust the insights they use to ship, learn, and iterate.
From an engineering leadership standpoint, I partner closely with SRE to define SLOs and error budgets, wire CI/CD pipelines for safe deploys, and track DORA metrics so we improve speed without compromising quality. This combination reduces incident management toil and shortens MTTR while keeping data freshness and query latency within strict thresholds.
From a product management leadership lens, the goal is clarity: crisp APIs, predictable contracts, and transparent stakeholder management across data, engineering, and GTM teams. That alignment empowers product teams with reliable cohorts and metrics, accelerates experimentation, and de-risks roadmaps.
If you’re scaling analytics, invest first in the platform layer: middleware and compute, schema governance, caching strategies, and cost-aware compute. Do that well, and the visible experience—charts, cohorts, and metrics—feels effortless, even as you grow to serve billions of events with confidence.
Inspired by this post on Amplitude – Best Practices.

I’ve spent years helping talented engineers explore what’s next when pure coding no longer feels like the only—or best—path. From hiring across cross-functional teams to mentoring career pivots, I’ve seen firsthand how engineering strengths translate into high-leverage roles that shape product, strategy, and growth.
Software engineers have alternative career options leveraging their skills in roles like product manager, data scientist, business analyst, and 22 more.
When an engineer moves into product management, they’re not starting from scratch—they’re redirecting problem-solving, systems thinking, and customer empathy toward outcomes. In practice, that means mastering product discovery, strengthening stakeholder management, and getting fluent in product roadmapping and sprint planning, so decisions are guided by impact rather than “outputs vs outcomes” confusion. I’ve watched this transition unlock empowered product teams and clearer prioritization across complex backlogs.
Data-oriented paths are equally compelling. If you enjoy experimentation and evidence-based decisions, roles in analytics or data science reward rigor. Think A/B testing, identifying the minimum detectable effect (MDE), and using tools like Amplitude analytics to translate behavioral signals into product bets. Pair that with retention analysis and you’ll become indispensable to growth conversations.
Business-facing roles such as business analyst or product marketing manager are ideal if you’re energized by customer problems and market narratives. Your engineering fluency sharpens value propositions, product positioning, and go-to-market strategy in a way that resonates with both buyers and builders. In my teams, the best bridges between product and revenue often came from former engineers who could articulate trade-offs with clarity.
If operational excellence is your edge, consider SRE, DevOps, or cybersecurity. The same instincts that push you toward clean CI/CD pipelines and resilient architectures translate well into incident management, threat detection and response, and privacy-by-design practices. These roles reward systems thinking and the ability to balance reliability with delivery speed.
For engineers who love community and storytelling, developer evangelism is a natural fit. You’ll translate complex concepts into actionable guidance, from in-app guides and product tours to UX writing and documentation. The best evangelists I’ve worked with turn feedback loops into product insight, strengthening activation and product-led growth without heavy sales pressure.
Customer-facing technical roles—solutions engineer, forward deployed engineer, or technical consultant—let you stay close to the product while solving real-world problems. You’ll drive onboarding quality, user activation, and adoption while surfacing insights that influence roadmaps. Done well, this work tightens the loop between customer outcomes and product decisions.
AI-centered roles are expanding rapidly. If you’re curious about AI Strategy, retrieval-first pipelines, or the practical use of LLMs for product managers, you can bring an engineer’s discernment to a noisy space. The most valuable contributors here pair pragmatic architecture choices with clear risk management and measurable business value, not hype.
Leadership tracks remain a strong option too. The IC to manager transition isn’t about title; it’s about raising the ceiling for others. You’ll coach empowered product teams, shape organizational development, and align initiatives to defensible metrics—think DORA metrics for flow, leading indicators for value, and OKRs that measure outcomes over output.
If you’re exploring a pivot, start small and intentional. Run “career A/B tests” by taking on cross-functional projects, shadowing adjacent roles, or shipping a lightweight portfolio that demonstrates the new muscle. Join a ProductCon session, practice conference networking, and refine a narrative that links your engineering foundation to the outcomes your target role owns.
Finally, map your personal unfair advantages—domain knowledge, systems thinking, customer empathy, or operational rigor—to the roles that value them most. With focus, you can reposition your engineering experience into a differentiated story that accelerates your next chapter. The breadth of options is real, and with a deliberate plan, you’ll turn curiosity into conviction—and conviction into impact.
Inspired by this post on Product School.

Will AI replace software engineers or reshape their roles? Explore risks, opportunities, and alternative career paths in tech.
I’m often asked whether AI will make software engineers obsolete. My short answer: AI is already automating tasks, not eliminating the role. The engineers who learn to orchestrate models, systems, and stakeholders will create more value—not less. The real shift is from keystrokes to judgment, from writing code to designing socio-technical systems that deliver outcomes.
Today’s gen ai assistants—think Claude Code and ChatGPT connector—excel at unit test scaffolding, boilerplate generation, refactoring, docstrings, and code search. When integrated into CI/CD, they can open draft pull requests, annotate diffs, and propose fixes. This lifts developer productivity and frees time for higher-leverage work: problem framing, architecture decisions, and customer discovery.
What changes in the role? We spend more cycles on product discovery, privacy-by-design, and AI Strategy, and fewer on repetitive implementation. We design agentic AI workflows that combine retrieval, tools, and guardrails; we evaluate trade-offs that blend performance, cost, and safety; and we partner with empowered product teams to ship the smallest valuable slice, learn, and iterate.
Measure what matters. If AI is working, DORA metrics should improve: higher deployment frequency, shorter lead time for changes, stable change failure rate, and faster MTTR. Pair that with outcomes vs output OKRs to avoid gaming the system—shaving seconds off a build is meaningless if it doesn’t move activation, retention, or revenue. A unified analytics platform can help connect engineering signals to business impact.
Risk is real—and manageable. AI risk management and data governance are now core competencies, not afterthoughts. Protect IP with robust access controls, context window management, and red-teaming. In production, instrument threat detection and response to catch prompt injection, data leakage, and model drift. Treat this like any other reliability discipline alongside SRE.
If parts of coding get automated, where can great engineers thrive? Several high-impact paths are emerging: platform engineering for LLMs (tooling, evals, observability), SRE for AI-infused systems, developer evangelism and education, product management for AI-native experiences, security engineering focused on model and data threats, and forward deployed engineers who pair with customers to solve messy, real-world problems.
How to upskill fast: build an AI product toolbox and ship small. Prototype gen ai features end-to-end—retrieval, function calling, human-in-the-loop QA—and connect them to your CRM integration or support stack. Use A/B testing with a clear minimum detectable effect (MDE) to validate impact. Leverage CustomGPT workflows for internal enablement and in-app guides or product tours to onboard users safely.
Here’s a pragmatic 90-day plan. Week 0–2: audit your top 10 engineering tasks by time spent; identify 3 that are ripe for AI augmentation. Week 3–6: pilot inside CI/CD with explicit guardrails; track DORA metrics and developer sentiment. Week 7–10: productionize the wins; document runbooks; add incident management paths. Week 11–12: share learnings with product trios, refine your value proposition, and set next-quarter OKRs.
AI won’t replace software engineers; engineers who master AI will outpace those who don’t. If we embrace the shift—toward systems thinking, responsible governance, and customer outcomes—we’ll build better products faster and open new, rewarding career paths. The opportunity is here and compounding.
Inspired by this post on Product School.

An incident fires. Your responders are not short of data; they are short of a trustworthy path through it. Deployment timelines, service ownership, dashboards, logs, runbooks, and prior incidents live in separate places, while the cost of a wrong action rises by the minute.
The decision in front of you is not whether AI can summarize the incident channel. It is whether an agent can shorten the investigation without becoming another failure mode. That requires an operating model covering the agent’s job, context, permissions, interface, and evaluation before you give it meaningful authority.
An incident-response agent should run a goal-directed investigation loop, not wait for isolated prompts like a chatbot. A credible implementation can collect context, form and test hypotheses, and draft fixes inside Slack. The important product decision is where that loop must stop for human judgment.
Model the loop on the work a strong responder already performs:
The incident commander remains accountable for priorities and mitigation. The agent acts as an investigation engine: it gathers, tests, organizes, and proposes. This division is more useful than treating human involvement as a final approval click after the AI has already made every material decision.
Choose the first workflow with care. A good starting point has a bounded service area, dependable read-only signals, known responders, established runbooks, and outcomes you can verify after the incident. A workflow that depends on undocumented tribal knowledge or unrestricted production access is not ready for agentic automation. Fix the operating system around the incident before expecting a model to compensate for it.
Do not begin with the most dramatic remediation you can automate. Early value usually comes from reducing context switching, locating the correct owner, connecting symptoms to recent changes, and eliminating weak hypotheses. Those tasks consume scarce attention but do not require the agent to mutate production.
A capable model cannot reason with operational context it cannot find, distinguish, or trust. If a service has three names across the deployment system, observability platform, and incident channel, retrieval becomes unreliable before model reasoning even begins.
Create a context contract for every service placed within the agent’s scope. At minimum, make these fields explicit:
Start retrieval with exact operational signals. Filter by canonical service, environment, incident time window, deployment identifier, alert type, and ownership tag. Then rerank the surviving records for the current question. This deterministic tagging and reranking foundation is easier to debug than making semantic similarity responsible for every retrieval decision.
Add embeddings where language actually creates ambiguity: matching an unfamiliar symptom to a differently worded historical incident, finding a relevant paragraph inside a long runbook, or connecting terminology used by two teams. Semantic retrieval should widen discovery, not erase exact boundaries such as production versus staging or one tenant versus another.
Require every retrieved item to carry provenance that a responder can inspect: its system of record, service and environment, creation or update time, incident-time availability, and reason for retrieval. This lets the responder notice four common failures quickly:
Treat missing context as an observable product state. The agent should say that it cannot locate a deployment record or dependency map, identify which system was checked, and propose a safe way to continue. A confident answer assembled around a missing record is more dangerous than an explicit gap.
Autonomy is not one switch. It is a set of permissions attached to particular tools, targets, environments, and action classes. Granting broad credentials because the agent usually behaves conservatively turns a model-quality issue into a production-control issue.
| Action class | Appropriate agent role | Required human control |
|---|---|---|
| Read-only investigation | Query approved telemetry, changes, ownership, and runbooks | Audited access with service and environment boundaries |
| Recommendation or communication | Draft a diagnostic check, remediation plan, incident update, or escalation | A responder reviews customer-facing messages and consequential recommendations |
| Bounded, reversible execution | Invoke a preapproved runbook against an explicitly named target | Approval bound to the exact action, target, inputs, and current incident |
| Irreversible or broad execution | Explain the need and prepare a plan, but do not execute during the initial rollout | Existing change controls and accountable operators remain in force |
Do not label an action reversible merely because the interface contains a rollback button. A deployment rollback can still be unsafe after an incompatible schema or data change. A restart can amplify load or destroy useful diagnostic state. Reversibility has to be validated for the specific service state, not inferred from the action name.
For every executable tool, define guardrails outside the prompt:
The action proposal should be a control artifact, not a conversational suggestion. It needs the evidence supporting the action, the exact target, the expected observable result, the maximum intended scope, known preconditions, and what the responder will do if the result does not appear. If the agent cannot supply those fields, it has not earned execution authority for that action.
Keep outward communication on a separate permission path. Drafting a status update is low-risk technically but consequential for customers and the business. Human review should verify what is known, what remains uncertain, and whether the message promises a recovery time the evidence cannot support.
Putting the agent inside the collaboration surface where incidents already unfold reduces the friction of opening another product and re-explaining the situation. It also means the agent’s output competes with urgent human messages. Long narrative answers will be skipped, however intelligent they sound.
Give each investigation update a stable structure:
This is not a request to expose a model’s private, free-form chain of thought. Responders need a structured evidence trail: claims, retrieved signals, tool results, rejected alternatives, and action rationale. That artifact is more useful for review because each part can be checked against the operational record.
Confidence labels are helpful only when they change behavior. Define what the interface does when confidence is low: ask for a missing service identifier, run another safe check, present multiple hypotheses, or escalate to the owner. Do not display a precise-looking score unless you have evaluated whether that score corresponds to actual correctness in your incident set.
Design human correction as part of the main workflow. A responder should be able to reject a hypothesis, correct the service or environment, mark a retrieved record stale, deny an action, and state why. The agent should preserve that decision in the incident record and replan from it. Repeatedly resurfacing a rejected hypothesis erodes trust even when the underlying model is otherwise capable.
Watch for a subtle interface failure: polished summaries can make weak investigations look complete. Make unresolved questions and conflicting signals visually prominent in the message structure. The goal is not to make the agent sound certain. It is to help the incident commander see what is known, what is inferred, and what decision comes next.
A demo proves that the agent can complete a favorable path. It does not prove that the agent will retrieve the right context, resist a misleading correlation, respect permissions, or propose a safe action when production is ambiguous.
Use post-incident time-travel evaluations. Reconstruct what the agent could have known at each point in a real incident. Begin with the original trigger and expose deployments, telemetry, messages, and tool results only when they became available. Hide the final root cause, later analysis, and corrected metadata until the corresponding point in the replay. Otherwise, you are testing hindsight rather than incident response.
Grade the investigation on operational usefulness, not prose quality:
Treat safety failures differently from diagnostic misses. A missed hypothesis is a capability problem. Crossing a permission boundary, inventing evidence, or targeting the wrong environment is a release blocker for that tool path. Averaging all outcomes into one quality score can conceal exactly the failure that matters most.
Re-run the evaluation set after changes to prompts, models, tools, service topology, runbooks, or permissions. An agent can regress even when its general language quality improves. Operational behavior depends on the whole system around the model.
The next outage is the wrong time to discover that your agent cannot distinguish a plausible explanation from verified evidence. Before it happens, choose one bounded incident workflow, define its context contract and permission envelope, and replay several real investigations without future information. If the agent can make its evidence legible, stay inside policy, and consistently move responders toward the next correct decision, you have a foundation worth expanding.