Tag: driver trees

  • How to Choose a North Star Metric That Guides Product Teams

    How to Choose a North Star Metric That Guides Product Teams

    A North Star Metric should help a product organization recognize whether customers are receiving meaningful value. It is not simply the largest number on an executive dashboard or the metric that is easiest to improve.

    The supplied Amplitude – Perspectives material frames the subject as the difference between good and bad North Star Metrics, but it does not provide the underlying criteria or examples. The guidance below therefore applies established product management principles to that decision without attributing unsupported specifics to the source.

    The role of a North Star Metric

    A North Star Metric is a shared measure of the customer value a product delivers. Its purpose is alignment: product, design, engineering, marketing, and leadership should be able to use it when evaluating priorities and discussing progress.

    That makes it different from a financial target, a team-level key performance indicator, or a temporary campaign measure. Revenue and retention remain important business outcomes, but a North Star Metric usually sits closer to the customer behavior that creates those outcomes. It should clarify what valuable product use looks like without pretending that one number can describe the entire business.

    Key takeaways

    • A useful North Star Metric reflects customer value, not activity alone.
    • Teams must be able to influence it through product decisions.
    • The metric needs a precise definition, consistent data, and a meaningful time window.
    • Guardrail metrics are still necessary because optimizing one measure can create unintended effects.
    • A candidate that rewards volume without quality is a warning sign.

    What separates a strong metric from a weak one

    A strong candidate connects three ideas: customers experience value, the organization can influence the behavior, and the behavior is plausibly related to durable product success. The connection does not need to prove causation immediately, but the product team should be able to state the logic clearly and test it over time.

    The metric must also be operational. Everyone should understand what event qualifies, which users or accounts are counted, how often the measure is calculated, and how edge cases are handled. If two analysts can produce materially different answers from the same definition, the organization does not yet have a dependable North Star Metric.

    Finally, the measure should be sensitive enough to inform decisions without becoming noisy. A metric that changes mainly because of seasonality, acquisition spending, or data-pipeline behavior can distract teams from the product experience they are trying to improve.

    Why attractive metrics can still be misleading

    Weak North Star candidates often measure motion rather than value. Total registrations, page views, messages sent, or time spent may rise even when users fail to accomplish their goals. Such measures can still be useful diagnostic indicators, but naming them as the North Star may encourage teams to maximize quantity at the expense of relevance, quality, or trust.

    Lagging financial outcomes present a different problem. Revenue is essential to company health, yet it may not tell a product team which customer experience to improve next. It can also move because of pricing, sales execution, or market conditions. A metric becomes more actionable when teams can trace it through a driver tree to product behaviors they can investigate and influence.

    A practical selection and validation process

    The selection process should begin with the product’s value proposition: what meaningful result is the customer trying to achieve? Teams can then identify observable behaviors that indicate that result occurred, compare candidate measures against historical retention or continued use, and document the assumptions connecting behavior to value.

    Before adoption, the proposed metric should be tested against uncomfortable scenarios. Could it rise while customer outcomes deteriorate? Could a team inflate it through repeated low-value actions? Does it exclude an important user group or business model? These questions expose incentives that a polished metric name can conceal.

    Once selected, the North Star should be paired with guardrails such as quality, reliability, satisfaction, retention, or risk measures appropriate to the product. It should also be reviewed when the strategy, customer base, or value proposition changes. The goal is not to preserve a metric forever; it is to maintain a credible link between product decisions and customer value.

    A well-chosen North Star creates a useful constraint for decision-making. The next step is to define the candidate precisely, challenge the incentives it creates, and confirm that teams can connect their work to its movement without losing sight of broader product health.


    Inspired by this post on Amplitude – Perspectives.


    Book a consult png image
  • Connecting Amplitude Positioning to Product-Led Growth

    Connecting Amplitude Positioning to Product-Led Growth

    For an analytics product, positioning cannot stop at a market-facing promise. The promise has to appear in onboarding, become visible in user behavior, withstand technical evaluation, and give sales and product teams a consistent explanation of value.

    Taken together, two Shivam.Consulting profiles describe complementary sides of that system at Amplitude. The profile of Darshil Gandhi emphasizes competitive, partner, and technical credibility, while the profile of Tommy Keeley concentrates on acquisition, activation, engagement, and experimentation. Their combined lesson is that positioning and product-led growth work best as one evidence loop rather than as separate marketing and product programs.

    Positioning becomes credible inside the product

    Product positioning defines the problem a product addresses, the value it promises, and the reasons a buyer should choose it. Product-led growth puts that proposition under immediate pressure: users encounter the product directly and can compare the promise with the experience.

    The Darshil Gandhi profile reports that Gandhi leads competitive intelligence, partner product marketing, and technical marketing at Amplitude after serving as a principal on a solutions engineering team. The article treats that technical background as important because positioning must reflect real implementations, not merely persuasive language. It connects this approach to field-tested demonstrations, documentation, reference architectures, integrations, and feedback from sales and solutions engineering.

    The Tommy Keeley profile approaches the same credibility question from the user’s side of the interface. It describes guided onboarding, product tours, progressive disclosure, contextual prompts, and other in-product guidance as ways to move users toward an early experience of value. Funnel instrumentation and session replay are presented as tools for locating friction in that journey.

    These perspectives form a useful positioning test. A claim must be technically defensible during evaluation, understandable when a user first enters the product, and observable in subsequent behavior. If one of those conditions fails, stronger copy alone is unlikely to repair the mismatch.

    Behavioral evidence closes the positioning loop

    The two profiles both assign behavioral analytics a role beyond reporting. In the Gandhi article, Amplitude analytics are used to validate claims and identify themes associated with competitive wins. In the Keeley article, behavioral analytics, cohort analysis, funnels, pathing, and retention analysis help determine which actions are associated with longer-term value and where users abandon important journeys.

    This creates a feedback loop between market language and product behavior. Positioning proposes that a capability produces a meaningful outcome. Instrumentation then shows whether intended users reach that capability, adopt it, and continue using the product. Field feedback adds another layer by revealing which claims survive buyer scrutiny and which require qualification or clearer proof.

    The distinction between correlation and causation remains important. Cohort patterns can identify promising behaviors, but an association with retention does not by itself prove that encouraging the behavior will improve retention. The Keeley profile therefore pairs behavioral analysis with controlled A/B testing, minimum detectable effect thresholds, guardrail metrics, sequential testing, and feature flags. In this model, analytics generates hypotheses and experiments provide stronger evidence for decisions.

    The same discipline applies to AI-enabled personalization. The Keeley article describes using generative AI for tailored onboarding, recommended next actions, and summaries of activity patterns, while placing interventions behind feature flags and evaluating them through controlled experiments with privacy-by-design constraints. AI is therefore framed as an extension of the measurement system, not a substitute for a clear value proposition.

    A shared driver tree connects the market promise to growth

    A recurring mechanism across both sources is the driver tree. The Gandhi profile recommends connecting capabilities to customer outcomes so competitive narratives remain consistent. The Keeley profile starts with a North Star Metric and maps drivers across acquisition, activation, engagement, retention, and monetization. Combined, these uses turn the driver tree into a translation layer between positioning and product-led execution.

    At the top sits the outcome the product claims to enable. Beneath it are the behaviors that indicate users are realizing that outcome, followed by the product capabilities and interventions intended to support those behaviors. Competitive intelligence can examine whether the top-level promise is distinctive and relevant. Technical marketing can verify that the enabling capabilities work as described. Growth teams can measure whether users discover and adopt them.

    This structure also changes acquisition decisions. The Keeley profile argues for optimizing beyond clicks toward post-signup behaviors associated with retention. That requires congruence among the landing-page message, the users being attracted, and the experience after signup. A campaign that produces registrations but draws people away from the product’s strongest use case may improve a top-of-funnel measure while weakening the product-led system.

    Growth loops should follow the same logic. The Keeley article identifies collaboration invitations, user-generated content, and shareable artifacts as possible viral mechanisms. Their strategic value depends on whether sharing is a natural expression of the product’s core value. When distribution emerges from useful product behavior, the loop reinforces positioning; when sharing is detached from that value, it risks becoming a short-lived acquisition tactic.

    Key takeaways

    • Positioning should be treated as a testable claim linking a capability, a user behavior, and a meaningful outcome.
    • Technical evidence, field feedback, and behavioral analytics answer different questions; credible differentiation needs all three.
    • A shared driver tree can align competitive intelligence, product marketing, growth, design, engineering, sales, and solutions engineering around the same value logic.
    • Acquisition quality should be judged partly by meaningful post-signup behavior, not solely by traffic or registration volume.
    • Onboarding, in-product guidance, and viral loops should express the core value proposition rather than operate as disconnected growth tactics.
    • Personalization, including AI-enabled interventions, needs feature controls, privacy safeguards, and experimental evaluation.

    Organizational alignment is part of the positioning system

    Neither source presents this work as the responsibility of a single function. The Gandhi profile emphasizes collaboration among competitive intelligence, partner product marketing, technical marketing, sales, solutions engineering, and product. The Keeley profile describes empowered product trios, continuous discovery, and outcome-focused roadmaps that connect engineering, design, and product decisions to measured growth drivers.

    The synthesis suggests a practical division of responsibility without creating separate agendas. Market-facing teams clarify the buyer’s alternatives and the basis for differentiation. Technical teams establish what can be demonstrated and implemented. Product teams reduce the distance between signup and experienced value. Growth teams measure the journey and test interventions. Partners can make integrations and associated use cases more repeatable.

    The forward opportunity is to make this loop increasingly explicit: every major positioning claim can be connected to product evidence, every growth initiative can be checked against the intended value proposition, and every field objection can become an input to product discovery. That approach gives Amplitude’s reported playbooks a broader implication for product-led companies: differentiation becomes more durable when the story, the implementation, and the observed behavior keep correcting one another.

    References

  • An AI Operating Model That Measures Outcomes, Not Activity

    An AI Operating Model That Measures Outcomes, Not Activity

    Your AI team is shipping, dashboards are filling up, and executives are still asking the uncomfortable question: what changed for the customer or the business?

    The answer is rarely another model metric. You need an operating model that connects AI quality to customer behavior, workflow performance, commercial results, and risk. When that chain is visible, you can decide what to scale, what to repair, and what to stop.

    Key takeaways

    • Give every AI initiative an outcome contract that names the target behavior, business result, guardrails, and decision owner.
    • Measure four linked layers: AI quality, user behavior, workflow results, and business outcomes.
    • Preserve the context behind each interaction so you can compare outcomes by customer, workflow, model version, and acquisition path.
    • Run one recurring evidence review where teams make explicit scale, fix, hold, or stop decisions.
    • Use the first 90 days to prove a reusable learning system, not merely a functioning AI experience.

    Start each initiative with an outcome contract

    A feature brief tells a team what to build. An outcome contract tells it why the work exists, how evidence will be interpreted, and who can act on that evidence. It is the smallest practical unit of an outcome-led AI portfolio.

    Write the contract before choosing a model or polishing a prompt. Keep it to one page and require six fields:

    • Target workflow: Name the repeated job being changed, such as resolving a support request or preparing a sales follow-up.
    • Target user behavior: Describe what a person should do differently. Adoption alone is weak; successful completion, accepted recommendations, or reduced rework is stronger.
    • Business outcome: Connect the behavior to retention, expansion, qualified demand, service capacity, or another commercial result.
    • Quality floor: Define the task-level evaluation the AI must pass before exposure expands.
    • Guardrails: Name the safety, privacy, latency, reliability, and cost conditions that must remain acceptable.
    • Decision rule: State what evidence will trigger a scale, fix, hold, or stop decision, and name the person accountable for making it.

    A driver tree makes the logic inspectable. Start with the business result, work backward to the customer behavior that can influence it, then identify the product and AI capabilities that can change that behavior. This prevents a model improvement from being mistaken for business progress.

    The contract also gives empowered teams useful boundaries. Leaders align the portfolio around outcomes and constraints; teams retain room to change prompts, retrieval methods, interaction design, or even the proposed solution. That is the practical connection between AI strategy, continuous discovery, evaluation, delivery, and value capture.

    Build one scorecard across four layers

    AI outcome analytics is not a single north-star metric. It is a chain of evidence. If you measure only the beginning of the chain, you learn whether the system produced an answer. If you measure only the end, you may see revenue move without knowing why.

    Measurement layerQuestion it answersUseful examplesTypical decision
    AI qualityDid the system perform the intended task?Task success, groundedness, safety failures, response varianceChange prompts, context, retrieval, model, or fallback
    User behaviorDid a person trust and use the result?Acceptance, correction, abandonment, repeat use, human escalationChange the interaction, explanation, or moment of assistance
    Workflow outcomeDid the job become meaningfully better?Successful completion, rework, cycle time, resolution qualityExpand, narrow, or redesign the workflow
    Business and risk outcomeDid the change create durable value within constraints?Retention, expansion, qualified leads, cost per successful outcome, incidentsScale, repackage, hold, or stop

    Read the layers from left to right. Good AI quality with weak behavior usually points to product design, trust, or workflow placement. Strong usage with no workflow improvement may indicate novelty rather than value. Workflow gains with poor economics mean the experience works but the architecture or packaging does not.

    Use the workflow attempt as the basic unit of analysis whenever possible. A generic session can contain several unrelated intentions. A workflow attempt lets you connect the user request, retrieved context, model and prompt version, response, correction, completion, and downstream result.

    Persist the properties needed to reconstruct that journey. Customer segment, acquisition context, workflow type, entitlement, experiment group, model version, retrieval version, and human-handoff status often matter more than another page-view event. Carrying critical context across visits lets you trace behavior from early exploration to conversion and expansion instead of losing the causal story at signup.

    Keep the event taxonomy small enough to govern. Instrument decisions and state changes, not every interface movement. For each event, document its owner, trigger, required properties, prohibited sensitive data, and validation method. A dashboard built on ambiguous events creates confidence without clarity.

    Run a weekly loop from evidence to decision

    Analytics creates value only when it changes a decision. Give each AI initiative a recurring evidence review attended by the product trio and the engineering, data, risk, operations, or go-to-market partners needed for that workflow.

    1. Check the contract. Reconfirm the target workflow, primary outcome, evaluation floor, and guardrails. If the goal has changed, update the contract before interpreting the data.
    2. Inspect the scorecard. Review AI quality, behavior, workflow, business, risk, and cost in that order. Look for breaks in the chain rather than averaging them into one health score.
    3. Segment the result. Compare the cohorts that could conceal a failure: new and experienced users, customer tiers, workflow types, channels, experiment groups, and system versions.
    4. Review failure cases. Sample unsuccessful attempts and classify the reason: missing context, poor retrieval, incorrect generation, confusing interaction, policy restriction, latency, or a problem outside the AI system.
    5. Make one portfolio decision. Choose scale, fix, hold, or stop. Record the evidence, owner, next test, and condition for revisiting the decision.

    Do not let offline evaluations and online analytics compete. Offline evaluations test whether a candidate change can handle representative tasks and known edge cases. Online measures show whether the released experience changes real behavior under real conditions. A candidate should clear the evaluation floor before broader exposure, then earn expansion through customer and business evidence.

    When you run an experiment, agree on the hypothesis, primary outcome, guardrails, minimum detectable effect, and stopping rule before looking at results. Feature flags and progressive rollout keep the decision reversible. If the result is ambiguous, improve the test or narrow the population; do not promote the most flattering proxy.

    This rhythm makes learning rate operational. The useful question is not how many experiments ran. It is how many consequential uncertainties were resolved and converted into a product, portfolio, or go-to-market decision. Testable decisions, behavioral analytics, and guarded rollouts make speed credible because the evidence can survive scrutiny.

    Assign decision rights before the dashboard turns red

    AI products cross boundaries that ordinary feature teams can often ignore. Product owns the customer and business outcome. Engineering owns service behavior and remediation. Data or AI teams own evaluation integrity and model observability. Risk, security, legal, and operations own constraints that cannot be traded away informally.

    Write those responsibilities into the operating model. For each risk tier, specify who can approve an initial release, expand exposure, pause the system, change a model or retrieval source, accept a temporary exception, and communicate an incident. A named decision owner is more useful than a large committee with shared accountability.

    Governance should begin during discovery. The team can then choose acceptable data, design consent, build traceability, create fallbacks, and define escalation paths before those choices become expensive. Model cards, data records, evaluation results, release history, and incident decisions should form one audit trail rather than separate compliance paperwork.

    The same principle applies to commercial decisions. Product, finance, sales, and customer success need a shared definition of value. Measure inference and support costs against successful workflow outcomes, not raw requests or tokens. Packaging can then reflect delivered value while protecting margins and avoiding incentives for wasteful usage.

    Use simple decision tests:

    • Scale when the primary outcome improves, quality and safety floors hold, economics remain acceptable, and the result repeats in the intended cohorts.
    • Fix when the chain reveals a local weakness, such as adequate AI quality but low acceptance, or strong adoption but excessive rework.
    • Hold when the evidence is inconclusive, the measurement is unreliable, or a guardrail is close enough to its limit that broader exposure would create avoidable risk.
    • Stop when only proxy metrics improve, the target workflow does not change, or the value depends on manual intervention that cannot be sustained.

    Use 90 days to prove the operating system

    Your first 90 days should produce more than a working use case. They should leave behind a repeatable contract, event model, evaluation set, rollout path, governance record, and decision cadence that the next team can reuse.

    1. Weeks 1–2: choose the workflow. Audit available content and data, map the highest-value repeatable workflows, and select one where behavior and business impact can be observed. Write the outcome contract and assign decision rights.
    2. Weeks 3–4: define the evidence. Build the driver tree, establish the four-layer scorecard, create representative offline evaluations, classify risk, and document the release and stop conditions.
    3. Weeks 5–8: build and instrument. Create the retrieval and prompt baseline, capture lineage and version context, validate events, implement observability, and test graceful fallbacks. Rehearse how the team will diagnose a failed attempt.
    4. Weeks 9–12: release and learn. Ship behind a feature flag, begin with limited exposure, compare behavior and outcomes, inspect failure cohorts, and make explicit scale, fix, hold, or stop decisions.

    At the end, ask for three forms of proof. Can the team explain which customer behavior changed? Can it connect that behavior to a workflow and business result without hand-waving? Can another team reuse the operating artifacts without rebuilding them from scratch?

    If any answer is no, keep the rollout narrow and repair the system of learning. If all three are yes, fund the next workflow using the same operating model. The goal is not a larger collection of AI features. It is an organization that can turn uncertain AI capabilities into measurable outcomes, repeatedly and responsibly.

    References

  • Analytics-Led Growth Engineering: A Practical Operating Model

    Analytics-Led Growth Engineering: A Practical Operating Model

    Your team has dashboards, event data, and a backlog of growth ideas. Yet decisions still come down to whoever has the strongest opinion, and experiment results rarely change the roadmap.

    The missing piece is usually not another analytics tool. It is an operating model that connects user behavior to a decision, a controlled release, and a measurable business result. Here is how to build one.

    Start with a growth constraint, not a dashboard

    Analytics-led growth begins with a constraint you want to remove. A broad instruction such as improve onboarding gives your team too much room to produce activity without progress. Frame the problem as a break in the user journey instead: qualified users reach the setup screen but fail to complete the action associated with first value.

    Connect that problem to your North Star metric through a driver tree. If the North Star depends on retained active accounts, its drivers might include the number of activated accounts, how frequently they return, and how deeply they use the product. Each driver can then be decomposed into observable behaviors.

    This prevents a common mistake: optimizing the easiest metric to move rather than the metric that matters. More tooltip clicks are not useful if they do not increase successful setup. Higher setup completion is still questionable if those users never return.

    Before opening your analytics platform, write down four things: the user segment, the behavior that is breaking, the outcome it should influence, and the decision you will make if the signal changes. If you cannot name the decision, you are probably requesting a report rather than investigating a growth opportunity.

    Build an evidence chain you can trust

    A growth team needs to trace the path from exposure to durable value. That requires more than counting page views. Instrument the events that represent intent, progress, successful value delivery, and return behavior.

    For every important event, define who triggered it, what object it affected, where it occurred, and whether it represents an attempt or a successful outcome. A generic event such as integration clicked cannot tell you whether the connection worked. Separate the attempt, completion, failure, and first successful use.

    Then inspect the journey through three complementary views. Funnel analysis shows where users stop progressing. Cohorts reveal whether the problem is concentrated among particular acquisition channels, plans, roles, or use cases. Retention analysis tests whether an apparent activation gain survives after the initial session.

    Behavior alone will not explain motivation. Pair the quantitative signal with customer interviews, support conversations, or session-level evidence. If a funnel shows that users abandon a configuration step, qualitative evidence can distinguish confusing language from missing permissions, weak intent, or a technical failure.

    Treat instrumentation defects as product defects. An event that fires twice, changes meaning, or omits a critical property can send engineering effort toward the wrong problem. Assign an owner to each decision-critical event and verify it across the full journey before using it to approve a rollout. Reliable behavioral analytics, cohorting, and funnel analysis are the foundation of this operating model, not a reporting layer added after release.

    Turn every growth idea into an experiment contract

    An experiment should begin with a falsifiable claim. Use this structure: for a defined user segment, changing a specific part of the experience should change a target behavior because it removes an identified barrier.

    Complete the contract before implementation. Name the primary success metric, the guardrails that must not deteriorate, the expected direction of change, and the minimum detectable effect. The MDE forces a useful product decision: what is the smallest improvement that would justify shipping and maintaining this change?

    Power considerations belong in planning, not in the explanation written after results arrive. If the eligible audience cannot produce a credible read on the effect that matters, change the experiment. You can target a higher-signal segment, test a stronger intervention, choose a more responsive leading indicator, or treat the release as a qualitative learning exercise rather than claiming a statistical win.

    Pre-commit to the decision rules as well. A positive primary metric with damaged guardrails should not become an automatic launch. A neutral result can still eliminate a weak theory. A surprising segment difference should become a new hypothesis, not an invitation to search repeatedly for a favorable slice of the data.

    This discipline changes backlog quality. Ideas compete on the strength of their evidence, the importance of the driver they address, and the clarity of the learning they can produce. The roadmap becomes a portfolio of testable growth mechanisms rather than a list of requested features.

    Use staged releases to separate learning from risk

    Feature flags let you control exposure without tying every decision to a new deployment. Start with internal validation, expose the change to an eligible cohort, watch technical and user guardrails, and widen access only when the evidence supports it.

    Keep three decisions distinct. The first is whether the change works as designed. The second is whether it improves the intended user behavior. The third is whether that behavior produces a lasting outcome. Passing the first decision does not answer the other two.

    Onboarding illustrates the difference. A clearer tooltip may increase interaction with a setup control. An in-app guide may increase completion of the setup flow. Neither result proves that users reached value or formed a durable habit. Follow the exposed cohort through the activation event and into retention before declaring the intervention successful.

    Small, reversible changes are especially useful here. Progressive disclosure, revised UX writing, a better default, or guidance at a predictable stall point can isolate a mechanism more clearly than a full onboarding redesign. When several elements change together, you may see movement without learning what caused it.

    Make the product trio accountable for learning

    Growth engineering is not an analytics team handing insights to a delivery team. Product, engineering, and design should jointly own the hypothesis, the intervention, the instrumentation, and the interpretation.

    Product connects the opportunity to the growth model and defines the decision. Design identifies the user friction and shapes the smallest credible intervention. Engineering validates event behavior, controls exposure, and protects reliability. All three inspect the outcome together.

    Close each experiment with a short decision record. Capture what you believed, what changed, which users were exposed, what happened to the primary metric and guardrails, what you decided, and which assumption changed. Record neutral and negative results as carefully as wins. Otherwise, old ideas return with new wording and consume another cycle.

    Leaders should review the quality of this learning system, not just the number of tests shipped. Notice whether teams are testing consequential hypotheses, whether events remain trustworthy, whether results lead to explicit decisions, and whether short-term activation gains are being checked against retention. Experiment volume without decision quality is another output metric.

    Key takeaways

    • Define the broken user behavior and the decision it affects before opening a dashboard.
    • Connect activation, depth, and frequency to your North Star through a driver tree.
    • Specify the hypothesis, primary metric, guardrails, MDE, and decision rules before implementation.
    • Use feature flags and staged exposure to manage risk while preserving a valid learning loop.
    • Validate leading indicators against retention, and store every result in a reusable decision record.

    Choose one important journey this week and trace it from first intent to retained value. If the events, ownership, or decision rules break anywhere along that path, fix that link before adding another growth experiment. Compounding growth begins with compounding clarity.

    References

  • Product Analytics for Retention: A Practical Operating System

    Product Analytics for Retention: A Practical Operating System

    You have a retention chart and a familiar problem: the curve is falling, the segments disagree, and every team has a different explanation. Another dashboard will not tell you what to build.

    You need a decision loop that connects retained value to observable behavior. Define the outcome, instrument the journey, locate the behavioral gap, and test the smallest change that could close it. That turns retention analytics into a product operating system rather than a monthly reporting exercise.

    Start with a retention contract, not a dashboard

    Before opening your analytics tool, finish this sentence: “For users who first do [starting action], retention means completing [valuable action] again within [return window].” If your team cannot agree on the blanks, it is not ready to interpret a retention curve.

    The starting action should identify a meaningful cohort. Account creation is often too weak because it combines curious visitors, evaluators, invited teammates, and serious users. Prefer the moment a person begins the journey you intend to improve, such as creating a project, starting an agent, or completing an initial workflow.

    The return action must represent delivered value, not convenient activity. Opening the app, viewing a page, or receiving a notification may be easy to count but weakly connected to the reason someone adopted the product. Choose an action that would make a customer notice if the product disappeared.

    Set the return window around the product’s natural use cycle. A daily workflow and an occasional administrative task should not share the same definition. Document the window, the qualifying action, the excluded users, and whether retention is measured at the user or account level. This is your retention contract.

    Next, build a driver tree connecting the retention outcome to measurable inputs. Put retained value at the top. Beneath it, map activation, repeated value-producing behavior, and the friction that can interrupt either one. This separates the lagging outcome you care about from leading signals a team can move sooner.

    For every leading signal, add a guardrail. If a change increases sessions but reduces task completion, it has created activity rather than value. If it improves first-session completion but does not affect return behavior, treat it as an onboarding improvement until the retention evidence catches up.

    Instrument the journey so the data can survive a decision

    Retention analysis breaks when event names mirror the interface instead of the customer’s progress. A click on “Continue” becomes meaningless after the button moves. An event such as workflow_started or task_completed remains interpretable across interface changes.

    For each critical event, record enough context to reconstruct what happened:

    • The user and, for collaborative products, the account.
    • The channel, surface, or entry point that started the journey.
    • The use case or object involved.
    • The event timestamp and relevant status.
    • The experiment assignment, when the experience is being tested.
    • The event version when its meaning or properties change.

    Give every retention-critical event a plain-language definition and an owner. The definition should state when the event fires, when it must not fire, which properties are required, and how duplicate or failed actions are handled. Keep cohort definitions centralized for the same reason. Product, marketing, and customer success cannot compare decisions if each team silently defines “activated” or “retained” differently.

    Validate the journey before trusting the curve. Trace real test accounts from the starting action through the value event and return action. Compare the interface state, raw events, and resulting cohort membership. Check identity transitions such as anonymous-to-signed-in usage, invitations, account switching, and merged profiles. A polished retention chart built on broken identity resolution is still broken.

    Treat the taxonomy like a product surface. Changes need review, backward compatibility, documentation, and monitoring. This work feels slower than building a dashboard, but it prevents teams from spending an entire planning cycle acting on instrumentation defects.

    Diagnose the behavioral gap before proposing a feature

    A retention curve tells you where return behavior weakens. It does not explain why. Use a fixed analysis sequence so the team does not jump from an interesting segment to a preferred solution.

    1. Inspect the curve shape. An early drop points you toward expectation-setting, onboarding, or initial value. A later decline points you toward repeat value, changing needs, or workflow friction.
    2. Segment with a hypothesis. Compare acquisition source, device, channel, use case, or customer type only when you can explain why that dimension might change the experience.
    3. Compare retained and non-retained cohorts. Look for behaviors that differ in sequence, completion, or repetition, not merely events with high volume.
    4. Build a funnel around the strongest candidate behavior. Find the step where the cohorts separate and inspect how users arrive there.
    5. Review session replay, conversation transcripts, or journey detail at that step. Look for hesitation, repeated attempts, unclear choices, missing context, and premature exits.

    This sequence moves you from outcome to segment, behavior, moment, and observable friction. Stop if the evidence cannot support that chain. A behavior that correlates with retention is a place to investigate, not proof that forcing the behavior will retain users.

    AI products make this distinction especially important. A generic greeting may produce a response without moving the user toward a task. If people hesitate, test a concise follow-up that clarifies the agent’s scope, offers two or three concrete choices, and still accepts free-form input. Measure the chain from continuation to task start, task completion, and return across the first three to five sessions. Do not optimize for extra conversation turns if users remain stuck.

    Pair behavioral evidence with continuous discovery. Analytics identifies the moment worth investigating; interviews and direct observation help explain the need, expectation, or constraint behind it. That combination produces a testable problem statement instead of a feature request decorated with data.

    Turn retention signals into controlled product bets

    Write the opportunity before discussing solutions: “When [cohort] reaches [moment], [observable friction] prevents [valuable behavior], which is associated with lower [retention outcome].” The wording forces you to name the user, the moment, the evidence, and the outcome without pretending you have already established causality.

    Then create an experiment card with:

    • A hypothesis linking the proposed change to a specific behavior.
    • The eligible cohort and trigger moment.
    • One primary retention outcome.
    • A leading indicator that can move earlier.
    • Guardrails for completion quality, errors, or unintended friction.
    • The minimum detectable effect and planned evaluation window.
    • A decision rule for stopping, iterating, rolling out, or reversing the change.

    Choose a change small enough to isolate the mechanism. If the suspected problem is uncertainty at the start of an AI interaction, test the opening sequence rather than redesigning the agent, onboarding flow, and navigation together. A smaller bet makes the result easier to interpret and cheaper to reverse.

    Review experiments on a regular product cadence. Begin with data quality, then evaluate the leading indicator, guardrails, and retention outcome in that order. Inspect the segments named in the original hypothesis rather than searching every possible cut for a favorable result. Record what the team decided, why it decided it, and what evidence would change the decision.

    Your roadmap should name the retention outcome and the behavioral driver, not promise a feature prematurely. “Increase repeat task completion for newly activated accounts” leaves room to test messaging, workflow design, defaults, or assistance. “Build a new onboarding wizard” locks the team into an answer before it has earned confidence in the problem.

    Key takeaways

    • Define retention as a cohort, a value-producing action, and a return window before interpreting any chart.
    • Use a driver tree to connect the lagging retention outcome to behaviors a product team can influence.
    • Standardize event and cohort definitions, then validate identity and journey data with real test accounts.
    • Move from curve to segment, behavior, moment, and friction before proposing a solution.
    • Use controlled, reversible experiments to distinguish a useful behavioral signal from a causal retention lever.

    Start with one journey that matters this week. Write its retention contract, trace the events, and identify the first point where retained and non-retained users behave differently. That single decision-ready path is more valuable than a broad analytics program nobody trusts.

    References

  • How to Prove the ROI of an AI Product Before You Scale It

    How to Prove the ROI of an AI Product Before You Scale It

    Your AI product is getting used. The demos land well, task completion is improving, and internal enthusiasm is high. Then the CFO asks a harder question: what changed in the business because this product exists?

    You cannot answer that question with prompt volume, response quality, adoption, or tickets touched. You need a measurement system that separates activity from incremental value, counts the full operating cost, and makes risk visible before a rollout gets larger. Here is how to build one.

    Start with the decision your ROI model must support

    ROI is not a retrospective slide assembled after launch. It is a decision rule. Before development begins, decide what evidence would justify launching, scaling, redesigning, rolling back, or retiring the capability.

    That distinction changes the conversation. Instead of asking whether the agent is accurate enough or popular enough, you ask whether a measurable change in customer behavior produces a measurable business result without crossing an unacceptable risk threshold.

    Build a driver tree with four levels:

    1. Company outcome: revenue growth, lower cost to serve, or reduced business risk.
    2. Customer outcome: the user completes a valuable job, reaches value sooner, or resolves a problem without unnecessary effort.
    3. Product behavior: the AI capability changes conversion, expansion, self-service completion, containment, handle time, or escalation.
    4. Controllable lever: the team changes the workflow, model behavior, conversation design, human review, or product guidance.

    The chain matters because a model metric is rarely a business metric. Better answer quality may improve task completion, which may improve trial-to-paid conversion. The ROI case depends on the full chain, not the first link.

    Value pathBusiness outcomeLeading evidenceGuardrails
    RevenueHigher conversion, average order value, or expansionTime-to-first-value and self-service completionErrors, complaints, and policy violations
    CostLower cost to serveContainment, deflection, and reduced handle timeEscalations, false resolution, and downstream customer harm
    RiskLower frequency or impact of harmful failuresHuman-review events and detected violationsFalse positives, false negatives, hallucinations, and security breaches

    Choose one primary value path for the investment case. Revenue, cost, and risk can all appear on the scorecard, but declaring all three as primary makes it too easy to rescue a weak result with whichever metric moved after launch.

    A support agent, for example, may appear successful because it contains more conversations. But containment is only valuable if customers actually resolve their problems. A conversation that never reaches a human can reduce measured support volume while increasing complaints or churn risk. This is why revenue, cost, and risk measures must be evaluated together.

    Write the measurement contract before you build the dashboard

    A measurement contract is a short agreement among product, data, finance, and the operational team affected by the AI workflow. It prevents the definitions, cost boundaries, and success thresholds from changing after results arrive.

    Your contract should answer these questions:

    • Who is eligible? Define the users, accounts, tasks, channels, and exclusions. Do not mix workflows with materially different economics.
    • What is the intervention? Name the AI capability and the version being evaluated. A model, prompt, retrieval pipeline, policy, or escalation change can alter the result.
    • What is the primary outcome? Select the business metric that determines whether the hypothesis passed.
    • What are the leading indicators? Use measures such as time-to-first-value, containment, and self-service completion to diagnose movement before lagging results mature.
    • What are the guardrails? Predefine acceptable limits for errors, hallucinations, false positives, false negatives, escalations, complaints, security events, and policy violations.
    • What is the baseline? Freeze the comparison period or control group before exposing the eligible population to the capability.
    • How will incrementality be proven? Specify the experiment, holdout, assignment unit, and minimum detectable effect.
    • What costs count? Agree on model or API consumption, labeling, evaluation, human review, and ongoing oversight before calculating value.
    • What action follows each result? Record the thresholds for launch, scale, redesign, rollback, and retirement.

    The contract should distinguish an outcome OKR from an output OKR. Shipping the agent, generating responses, and increasing feature use are outputs. Improving conversion, lowering verified cost to serve, or reducing harmful failures are outcomes. Outputs can explain what happened, but they cannot establish value on their own.

    Instrument the complete journey, not just the conversation

    An AI log tells you what the model did. An ROI dataset must also tell you what the user did next.

    Connect the journey from eligibility to business outcome:

    1. The user or account became eligible for the capability.
    2. The AI experience was offered, viewed, and engaged.
    3. A task was attempted, completed, abandoned, or repeated.
    4. A response was accepted, corrected, regenerated, or sent for human review.
    5. The interaction was contained, escalated, or handed to another workflow.
    6. The downstream conversion, expansion, support, retention, or complaint event occurred.
    7. The associated model cost, labeling work, and human-oversight cost were recorded.

    Carry a stable user or account identifier, experiment assignment, agent version, and journey identifier across those events. Without that connective tissue, the team may have an impressive agent dashboard and no defensible way to attribute a business outcome to the experience.

    Use behavioral analytics and session replay to understand why a metric moved. Use journey mapping and retention analysis to locate the friction worth solving in the first place. Product tours and in-app guidance can then help eligible users reach a validated workflow. This creates a closed loop from journey friction to experiment and measurable outcome, instead of a collection of disconnected AI metrics.

    Calculate economic value without turning activity into savings

    Start with net business value:

    Net business value = incremental revenue + cost avoided – total operating cost – quantified risk loss

    If finance requires an ROI percentage, divide net business value by the agreed investment base. Keep both the numerator and denominator visible. A percentage without its cost boundary is easy to inflate and hard to audit.

    Count only incremental revenue

    Do not credit the AI product with every transaction it touched. Credit it with the difference between the exposed population and the valid control or holdout.

    A practical revenue calculation is:

    Incremental revenue = eligible volume x measured outcome lift x value per additional outcome

    The measured outcome might be trial-to-paid conversion, self-service upsell, average order value, or expansion. Use the same eligibility definition, attribution window, and revenue treatment for the intervention and control. If the AI experience merely appears somewhere in a successful journey, that is influenced revenue, not proof of incremental revenue.

    Separate capacity from cashable savings

    Cost claims require more care than a deflection count. A contained interaction may create capacity without reducing expenditure. That capacity can still be valuable, but it should not be presented as cash savings unless spending actually changes.

    • Capacity created: employees have time available for other work, but the existing cost base remains.
    • Variable cost avoided: the company no longer incurs a cost that would have grown with each additional interaction.
    • Cashable savings: an approved budget, vendor charge, or staffing requirement is actually reduced.

    Report these separately. Otherwise, the same saved minute can be counted once as employee capacity and again as reduced spend.

    Validate that a deflected task was resolved, not abandoned or displaced to another channel. Then calculate avoided cost from the incremental lift in verified resolution, not the total number of conversations the agent handled.

    Include the operating costs that make the agent dependable

    Model or API cost is only one part of the investment. Include labeling, evaluation, human review, and operational oversight. If a safer workflow requires more review, that review is part of the product’s economics, not an external inconvenience to exclude from the model.

    Segment cost by agent, workflow, and outcome. Cost per response is useful for infrastructure management, but cost per verified successful outcome is the better economic unit. A cheap response that triggers retries, escalations, or corrections may be more expensive than a higher-cost response that completes the job.

    Do not bury risk inside an average ROI number

    Risk adjustment should make uncertainty visible, not create false precision. Use three layers:

    1. Hard guardrails: security and policy conditions that trigger containment or rollback regardless of financial upside.
    2. Observed risk indicators: error, hallucination, escalation, complaint, false-positive, and false-negative rates tracked by workflow and cohort.
    3. Financial adjustment: expected loss deducted from net value only when the probability and impact assumptions are credible enough for finance and risk owners to accept.

    Do not let a low-frequency, high-consequence failure disappear inside a high average success rate. If the downside cannot be defensibly monetized, keep it as an explicit decision constraint rather than assigning it a convenient dollar value.

    Prove incrementality before claiming impact

    The strongest ROI calculation still fails if the attribution is weak. A before-and-after improvement may come from seasonality, pricing, traffic quality, a support policy change, or another product release. The AI capability needs a counterfactual: what would have happened to comparable eligible users without it?

    Use an A/B test or holdout whenever the product and risk profile allow it. Make these choices before launch:

    • Assignment unit: Randomize at the level where the outcome occurs. If expansion is measured per account, account-level assignment can prevent users in the same customer organization from receiving conflicting experiences.
    • Primary outcome: Pick the metric that determines success and keep diagnostic metrics secondary.
    • Minimum detectable effect: Precompute the smallest lift worth detecting based on the baseline, available population, and business value. If the experiment cannot detect a decision-relevant change, extending the metric list will not fix it.
    • Guardrails: Test quality, escalation, complaints, security, and policy outcomes alongside the primary metric.
    • Analysis population: For a product-level ROI claim, analyze eligible users according to their assigned experience. Looking only at people who voluntarily used the agent introduces selection bias.
    • Measurement horizon: Keep the holdout long enough to observe the outcome named in the contract. Leading indicators can guide iteration, but they should not be substituted for retention, churn, Net Recurring Revenue, or other lagging outcomes.

    If randomization is not practical, use a fixed holdout or a frozen comparison period and document the limitations. A weaker design can still inform a decision, but the ROI claim should carry less confidence. Do not quietly promote correlation to causation because the rollout has executive attention.

    Interpret the result as a system. Suppose self-service completion rises but the business outcome does not. The agent may be solving a low-value task, attracting users who would have converted anyway, or shifting effort to a later step. If conversion improves while complaints or policy violations cross the guardrail, the value hypothesis may be valid but the implementation is not ready to scale.

    This is eval-driven development applied to product economics: define acceptable behavior and business success, measure both under controlled conditions, diagnose the failures, and repeat the test after a meaningful change.

    Turn ROI into a portfolio operating system

    A one-time business case goes stale as models, prompts, traffic, user behavior, and operating costs change. Maintain an Agent Analytics view for every production capability.

    Each agent scorecard should show:

    • The primary business outcome and current experiment result.
    • Leading journey metrics from eligibility through verified completion.
    • Revenue contribution, cost avoided, and total operating cost using the agreed definitions.
    • Quality and risk guardrails, including escalations and human-review events.
    • Performance by relevant customer, task, and journey cohort.
    • The agent, model, policy, and workflow version associated with the result.
    • The current decision status: exploring, launching, scaling, redesigning, contained, or retiring.

    Use the dashboard to make portfolio decisions, not merely to report trends:

    • Scale when the primary outcome clears the precommitted threshold, guardrails hold, net value is positive, and the result remains credible across the cohorts that matter.
    • Redesign when leading indicators improve but the business outcome does not, or when human review and escalation erase the economic gain.
    • Contain or roll back when a hard security, policy, or customer-harm threshold is breached, even if average financial performance is positive.
    • Retire when controlled measurement shows no decision-relevant incrementality or when dependable operation costs more than the value created.

    Review operational signals with frontline teams because they can explain patterns hidden by aggregate metrics. Review portfolio value in QBRs with product, data, finance, and risk owners so investment follows evidence rather than novelty.

    Only accelerate adoption after the workflow has demonstrated unit value. In-app guides, product tours, and lifecycle nudges can bring more eligible users into a validated flow. Measure whether those interventions increase the business outcome, not merely clicks or agent sessions. Scaling exposure to an unproven workflow scales its cost and risk as readily as its potential benefit.

    Key takeaways

    • Treat ROI as a precommitted decision rule for launch, scale, redesign, rollback, or retirement.
    • Connect model behavior to customer behavior and then to revenue, cost, or risk through a driver tree.
    • Freeze the baseline, cost boundary, guardrails, attribution method, and success thresholds before results arrive.
    • Credit only incremental revenue and verified avoided cost. Keep created capacity separate from cashable savings.
    • Include model consumption, labeling, evaluation, human review, and oversight in the operating cost.
    • Use controlled experiments or holdouts, with a decision-relevant minimum detectable effect, to separate causal impact from correlation.
    • Keep severe risk conditions as explicit constraints when they cannot be responsibly converted into a financial estimate.
    • Scale adoption only after the AI workflow has shown positive unit value under acceptable risk.

    Pick one high-friction customer journey and complete its measurement contract before the next roadmap review. If the team cannot name the baseline, control, primary outcome, cost boundary, guardrails, and decision thresholds, the capability is still an exploration. Label it honestly, instrument it properly, and earn the right to make an ROI claim.

    References

  • From Prototype to Production: How I Built Reliable AI-Generated Opportunity Solution Trees

    From Prototype to Production: How I Built Reliable AI-Generated Opportunity Solution Trees

    I just wrapped an all-out engineering sprint. That still sounds odd coming from me, because while I’ve written code on and off for years, I don’t self-identify as an engineer. I’m a product manager who used to be a designer. It’s been a long time since I wrote code for a living.

    But AI has expanded what’s just now possible—for our products, and for us. It’s pushed me to do more than I imagined. In that spirit, I want to share a recent engineering story. It includes technical details, and a year ago I couldn’t have done any of it. I learned it with the help of AI, and my aim is to show what’s now within reach.

    I’ve been building two services with a partner at Vistaly: AI-generated interview snapshots and AI-generated opportunity solution trees. We put out a call for alpha partners, received over 100 applicants, and selected eight design partners to start.

    Opportunity Solution Tree diagram with a blue Desired Outcome branching to green Opportunity nodes, yellow Solution nodes, and orange Assumption Tests for product discovery and AI workflows.
    A clear, color‑coded map from desired outcome to opportunities, solutions, and assumption tests—showing how to structure discovery work and prompt AI to generate, compare, and validate product ideas.

    Each team uploaded three customer interviews. I identified the key moments and opportunities and then generated an opportunity solution tree from those snapshots. I provide the AI services; Vistaly is building the UI and workflows around them.

    Early feedback was strong. Teams immediately asked to upload more interviews—exactly the kind of demand signal you hope to see—so we got to work making that possible.

    Dark interface screenshot of an opportunity solution tree with colored cards and dotted connectors, showing merged, moved, and evidence-added Opportunity notes about onboarding, support, and bot readiness.
    Go behind the scenes as AI turns raw feedback into a clear Opportunity Solution Tree. Linked cards reveal user needs—onboarding, support offload, and bot-readiness signals—so product teams can spot priorities and next steps at a glance.

    Updating an opportunity solution tree with new interview content is far harder than generating a new tree from scratch. I initially underestimated the complexity. Our goal wasn’t to produce a tree and declare it truth. We wanted teams to engage, correct, and collaborate with the AI—scaffolding cross-interview synthesis instead of doing it for them.

    To support that, we needed a way to communicate precisely how a tree would change after new interviews were added. We took inspiration from git diff and set out to build the equivalent for opportunity solution trees—step-by-step change sets that explain each proposed modification.

    Diagram of an opportunity solution tree with an Outcome node pointing to Opportunity A and Opportunity B; B branches to child opportunities and shows source evidence, labeled “Updates Can't Result in Data Loss.”
    A clear visual of AI‑generated opportunity solution trees: outcomes feed opportunities that branch into sub‑opportunities, while evidence is preserved. The structure ensures updates stay traceable and never cause data loss.

    That decision was right, but the lift was larger than I expected. It wasn’t enough to generate an updated tree; I also had to provide a clear, ordered walkthrough of what changed and why.

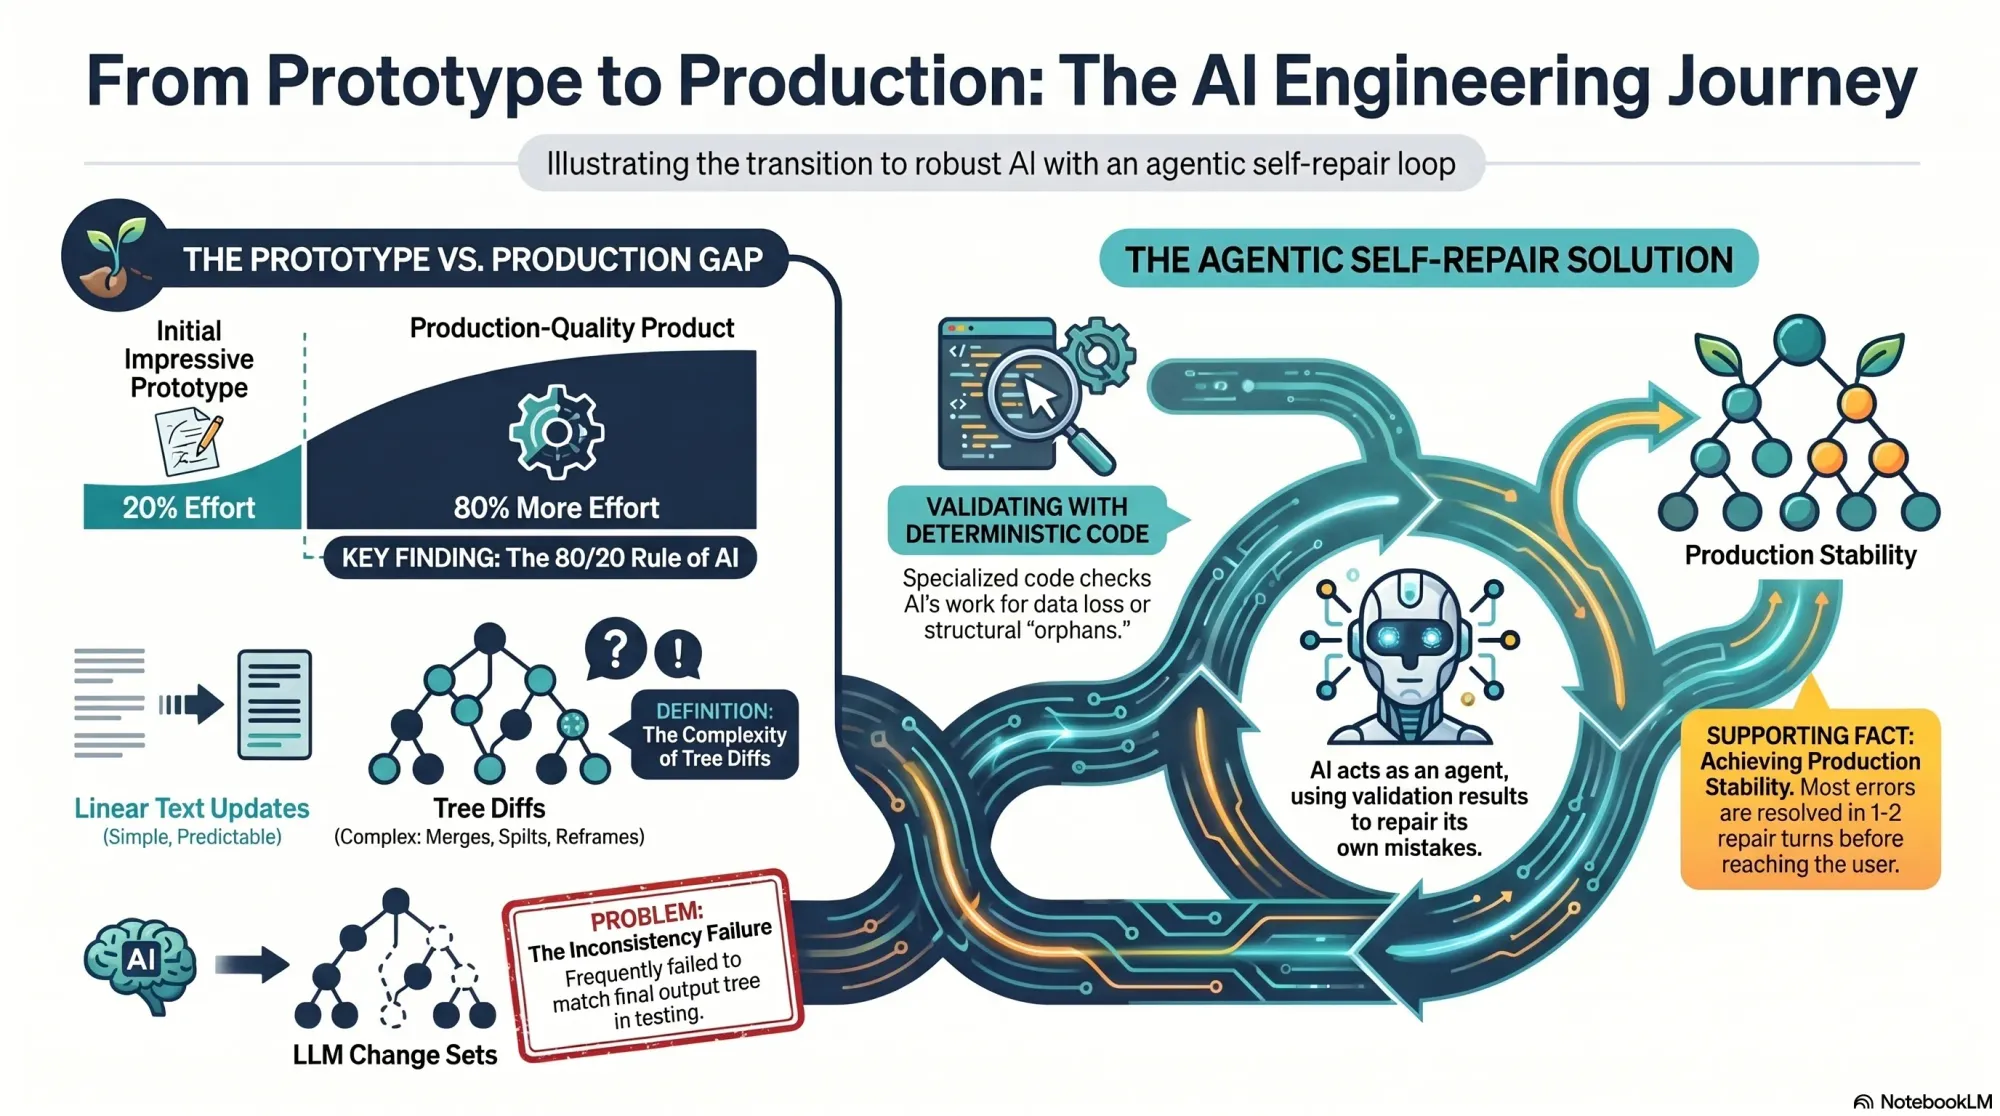
    I often see the same pattern with AI: it’s easy to get to an impressive prototype, but much harder to reach a production-grade product. That was exactly my experience here. My service actually comprised two sub-services: generating a new tree from scratch and updating an existing tree with new interviews. The first worked well in alpha; the second had to be built before anyone could add a fourth interview.

    Opportunity Solution Tree diagram: teal Outcome links to Opportunities A and B; Opportunities C and D branch under B; right panel lists the change set steps for adding nodes.
    Explore how an outcome expands into an Opportunity Solution Tree: Opportunities A and B stem from the goal, with C and D nested under B, while a concise change set tracks every node added along the way.

    On the surface, these services look similar. In reality, updates must preserve existing structure unless new evidence requires a change. You have to account for compound operations—merges, splits, deletes—while guaranteeing no data loss. Every node has source opportunities (supporting evidence from interviews) and children (tree sub-opportunities), and neither can be dropped.

    In classic AI fashion, I got a reasonable version working in a few days and shipped it to our design partners. One team quickly hit our beta limits and asked to convert to a paid subscription so they could keep going. They showed a willingness to pay, converted, and started uploading aggressively.

    Diagram of an Opportunity Solution Tree showing how parent 'Opportunity A' with children x, y, z is split into 'Opportunity A' and 'Opportunity B' to reassign evidence and connections.
    Watch an Opportunity Solution Tree evolve: the original parent A with x, y, z branches is split into A and B, shifting evidence while preserving links—mirroring how AI refines scope and structure in discovery.

    At the 14th, 15th, and 16th uploads, the cracks appeared. We saw odd behavior in some trees. The Vistaly team noticed that the change sets—the step-by-step instructions emitted by my service—didn’t always reconstruct the final tree my service also emitted. We needed those steps to match exactly, so teams could review and accept, modify, or reject each change with confidence.

    They flagged the issue the day I was flying to New Orleans for Jazz Fest. In hindsight, I’m glad I didn’t grasp the scope of what awaited me. I had roughly 80% of the work still to do to make tree updates rock solid. At least I got to enjoy the music first.

    Flowchart merging two opportunity solution trees: Opportunity B with children y and z, and Opportunity C with t, u, v, consolidated into one tree led by Opportunity C connected to five child opportunity nodes.
    From fragments to focus: this diagram shows how Opportunities B and C are merged into a single Opportunity Solution Tree, removing duplicates and unifying context so AI can rank and explore five related opportunities with clarity.

    Back home, I started diagnosing. My service was a pipeline: several LLM-driven steps followed by deterministic code to compare trees and produce change sets. As I dug in, I realized that approach was flawed. Tree diffs, unlike linear document diffs, are ambiguous.

    In a document, if I add a sentence, the diff shows an addition. If I delete a paragraph and rewrite it, the diff shows a removal and an addition. Simple. But trees are different. Suppose I split opportunity A into A and B, and later merge B with C. The split can disappear from the final diff.

    Diagram of an opportunity solution tree labeled 'Input Tree' showing an Outcome node branching to Opportunity A and C, each with child nodes x-z and t-v, with arrows indicating hierarchy.
    Peek inside our process: a simple opportunity solution tree maps an outcome to prioritized opportunities A and C with downstream options x-z and t-v. A clear snapshot of how AI organizes product discovery.

    When the model splits an opportunity, it must distribute A’s source opportunities and children between A and B. For instance, if A has source opportunities 1, 2, 3 and children x, y, z, after the split A might keep 1, 2, and x, while B takes 3, y, and z.

    Now suppose the model merges B into C. If C originally had source opportunities 4 and 5 and children t, u, v, then after the merge C now has source opportunities 3, 4, 5 and children t, u, v, y, z. When you compare the original and final trees, it looks like A somehow donated some evidence and children directly to C. The split and merge that explain why are invisible to a naive diff.

    Opportunity Solution Tree diagram titled Output Tree: a blue Outcome node branches to green Opportunity A and Opportunity C, which expand to nodes x-v with arrows; Product Talk badge.
    See how an AI-generated Opportunity Solution Tree unfolds: one Outcome flows to Opportunities A and C, then into options x–v. Clean colors and arrows reveal the hierarchy from goal to opportunities at a glance.

    That was the core insight: we didn’t just need to show what changed—we needed to show why it changed. I had to reconstruct each move step-by-step. That meant getting the model to show its work, which opened a new can of worms.

    I refactored my prompts so the model produced both the final output and the exact change set it used to get there. The action language was explicit: add, delete, reframe, merge, split, and so on. Crucially, I asked the model to describe its moves in user-meaningful terms—“split A into A and B, then merge B into C”—not as opaque reassignments of sources and children.

    Diagram of an AI-generated Opportunity Solution Tree: blue Outcome node with children Opportunity A and Opportunity B; B branches to Opportunity C and D. A right-hand list shows the change set for each step.
    Watch an opportunity solution tree take shape: start with the outcome, add opportunities A and B, then extend B to C and D. The paired change set makes every edit transparent—ideal for AI-assisted product discovery.

    For each LLM step, the model now emitted its recommendation and the corresponding change set. This helped, but it wasn’t perfect. After extensive testing and error analysis, two classes of errors emerged: (1) the model attempted an invalid move, and (2) the change set didn’t actually generate the recommendation.

    Category 1 felt like designing a game while the model played it creatively. For example, what happens when the model tries to merge a parent with a child? If opportunity A has children B, C, and D and the model merges A with B, the merge is directional. If the instruction is “keep A, delete B,” that works—the parent absorbs the child. But if the instruction is “keep B, delete A,” then C and D become orphans. These puzzles were solvable and even fun.

    Diagram of Opportunity Solution Tree merge rules: merging node B into parent A is allowed, while merging A into B is not because it would orphan opportunities B, C, and D.
    Visual explainer from Product Talk on AI-generated Opportunity Solution Trees. It contrasts an allowed merge (B into A) with a not-allowed merge (A into B) that leaves child opportunities orphaned, guiding safe hierarchy edits.

    Category 2 was harder. Despite prompt iterations, I could only push the discrepancy rate down to about 1 in 40 instances. With 10–20 LLM calls per run, that meant roughly half of all runs still failed. Not acceptable for production. I hit a wall. A paying customer was waiting, and more design partners were queued up.

    Next, I tried to correct the model’s mistakes with deterministic code. I had promised that my change sets would generate the output tree, so I wrote verifiers: detect conflicts (e.g., delete a node, then try to use it later), guard against data loss, prevent orphaned nodes, and more. Detection was straightforward; correction was not. Fixing issues required guessing the model’s intent. If the sequence said “delete A, then merge A with B,” should I remove A entirely or salvage A’s sources and children by merging into B? There were dozens of such cases with no unambiguous answer.

    Workflow diagram titled 'My Simple Repair Loop' showing an iterative validation cycle: Generate the Change Set → Run the validation tool → Check Result, with branches to retry on failure or exit on pass.
    A step-by-step loop shows how changes are validated: generate a change set, run a validation tool, review the result, then repeat on failure and exit on pass—mirroring iterative work behind AI-built Opportunity Solution Trees.

    After 11 straight days of deep work—including weekends—I was exhausted. I dislike hustle culture; this isn’t how I design my life. But I was stuck, and then I had an insight.

    On a walk with my husband (also an engineer), I realized I could have the LLM repair its own mistakes. My data contract with Vistaly requires that the change set must generate the output tree. I had already built robust validation code. I knew exactly when a change set failed—and why. No amount of prompt tuning alone was fixing it. So I turned the validator into a tool for the model and created a simple agentic loop.

    The loop works like this: the model proposes a change set, calls the validation tool, and gets back a pass/fail plus specific feedback. If it fails, the model uses those instructions to repair the change set and calls the tool again. Iterate until success or a max number of turns.

    I prototyped in Node.js with a single model call, a verifier pass, and a repair attempt. At first, the loop didn’t converge—it just accumulated compute. I experimented with how to communicate errors, how much context to include, and how to sequence feedback. Eventually, it clicked: the model began fixing its own mistakes and typically returned a valid change set in one or two repairs. It was, in practice, eval-driven development applied to LLM outputs.

    I had already built an agent loop utility for another AI workflow, so I productionized quickly: model call, optional tool invocation, tool result returned to the model, repeat until the validator signals success or the loop times out. I integrated the new loop into the pipeline and shipped the revamped service to Vistaly on Monday at noon. They’re integrating now, and it will be in the hands of our design partners shortly. I’m relieved—and ready for a day off.

    Reflecting on the last two weeks, a few things stand out. First, I shed limiting beliefs about being an engineer. To make this reliable, I had to solve legitimately hard problems, and that feels good.

    Second, this was genuinely fun. Designing the action set and watching the model push those boundaries was like working through elegant puzzles. Models are incredibly creative, and harnessing that creativity with the right constraints is deeply satisfying.

    Third, I learned when I can and can’t trust Claude to write code for me. Since Opus 4.6 came out, I gave Claude a much longer leash. After the past two weeks, Claude is back on a short leash. I found a lot of gaps in my implementation in areas where I simply trusted that Claude got it right, when in fact it didn’t. If you don’t have the right infrastructure—planning, testing, code review—this can be disastrous. I’ll be investing more here and sharing what I learn.

    Finally, if this work had been spread over two months, it would have been thoroughly enjoyable. I’m discovering how much I like being an AI engineer. It feels like a new chapter where I can combine opportunity solution trees with modern AI engineering—and deliver real value to product teams doing continuous discovery.

    I’m excited to share more of what we’re building with Vistaly and to onboard more design partners soon. If you’re interested, get on the waiting list. And if you’ve been hesitant to stretch beyond your current skill set, I hope this story nudges you to take the first small step toward what’s just now possible.


    Inspired by this post on Product Talk.


    Book a consult png image
  • AI-Assisted Product Strategy: A Practical Operating System

    AI-Assisted Product Strategy: A Practical Operating System

    You can get an AI model to produce a roadmap in minutes. That is precisely the problem. A polished roadmap can hide weak evidence, unresolved trade-offs, and a strategy that never made a real choice.

    The useful question is not whether AI can do product management work. It is where AI should accelerate the path from evidence to decision, where human judgment must remain explicit, and how you will know the resulting strategy is working. The operating system below gives you that separation.

    Key takeaways

    • Give AI a defined role in the decision process. It can extract, organize, challenge, and draft; the product leader still owns choices, trade-offs, and commitments.
    • Build a strategy chain from customer problem to business result before asking AI for initiatives. Otherwise, the model will fill strategic gaps with plausible language.
    • Ground every workflow in canonical product context, and require every important claim to point back to evidence.
    • Use AI to shorten discovery synthesis, not to turn a limited set of interviews or support conversations into false market certainty.
    • Carry the same strategic hypothesis through the roadmap, experiment, launch, and learning review. Changing the success definition between those stages makes measurement meaningless.

    Start with decision architecture, not a better prompt

    Most weak AI-assisted strategy work begins with an underspecified request: analyze this feedback, prioritize these ideas, or build a roadmap. The model responds by making silent assumptions about the customer, the business objective, and the meaning of priority. Its output may read well while answering a question nobody deliberately chose.

    Write a decision brief before opening the model. This is not a conventional product requirements document. It is a compact contract defining the decision AI is helping you make.

    • Decision: State the choice in one sentence. For example, decide which onboarding opportunity deserves discovery capacity in the next planning cycle.
    • Target customer and context: Name the segment, job, and situation. Feedback from an administrator configuring an account should not be blended with feedback from an end user completing a daily task.
    • Desired outcome: Identify the customer behavior you want to change and the business result it is expected to influence.
    • Evidence in scope: List the interviews, behavioral data, support conversations, journey maps, and prior experiments the model may use.
    • Constraints: Include privacy requirements, technical dependencies, commercial commitments, capacity limits, and non-goals.
    • Decision owner: Name the person accountable for accepting the trade-off. An AI-generated recommendation does not distribute accountability.

    Build a strategy chain the model can inspect

    Your strategy should form a traceable chain:

    1. Choose the customer and job that matter.
    2. Define the value proposition, including what must match the market and what should be meaningfully different.
    3. Name the customer outcome and business outcome.
    4. Break that outcome into drivers the product can influence.
    5. Select an opportunity supported by evidence.
    6. Form a testable product bet.
    7. Decide what evidence would justify continuing, changing, or stopping.

    A driver tree makes this chain concrete. It creates a visible connection between roadmap work and measures such as activation, retention, expansion, and Net Recurring Revenue. AI is useful here as a critic. Ask it to identify unsupported jumps, duplicated drivers, initiatives disguised as outcomes, and metrics the proposed product change cannot plausibly affect.

    Keep outputs and outcomes separate. Shipping an AI onboarding assistant is an output. Changing a defined activation behavior for a defined customer segment is an outcome. The model can help rewrite output-oriented objectives, but it cannot choose a credible target without baseline data, business context, and an accountable owner.

    Force a distinction between fact, inference, and assumption

    Require the model to label every material statement as one of three things:

    • Observed: Directly supported by a supplied interview, event, support conversation, or experiment.
    • Inferred: A reasonable interpretation that combines observations but is not explicitly stated by the customer or proven by the data.
    • Assumed: Necessary for the recommendation to work but not yet supported by the supplied evidence.

    This simple classification prevents an attractive narrative from laundering assumptions into facts. It also improves discovery planning: the most consequential assumption with the weakest evidence becomes a candidate for the next test.

    A useful instruction is: Use only the supplied material. For every recommendation, show the observations that support it, the inference connecting those observations to the recommendation, the assumptions that remain, and the evidence that could disprove it. If support is missing, say that it is missing.

    Build a controlled workflow from context to decision record

    AI assistance becomes reliable when it is a workflow rather than a chat session. A chat encourages improvisation: context changes, instructions disappear, and nobody can reconstruct why an answer looked different the next time. A workflow gives each pass a defined input, output, and approval gate.

    Ground the model in canonical product context

    Start with a retrieval-first set of canonical documents. At minimum, that context should include the current vision, product strategy, target segments, value proposition, OKRs, metric definitions, analytics dashboards, relevant discovery evidence, decision history, and definition-of-done checks.

    Canonical does not mean comprehensive. More context can make conflicts harder to notice. Give each item an owner, a freshness indicator, and an authority level. If an old positioning document conflicts with the approved strategy, the workflow should identify the conflict rather than silently averaging the two.

    Include exclusions as well. Tell the model which documents are historical, which metrics are deprecated, which segments are out of scope, and which proposals have already been rejected. Without those boundaries, previously abandoned ideas can return as apparently new recommendations.

    Separate extraction, synthesis, challenge, and approval

    1. Extract: Pull observations, customer language, events, metrics, decisions, and unresolved questions from the supplied material. Preserve links to the original evidence.
    2. Synthesize: Group related observations and propose opportunity statements. Keep contradictory evidence visible.
    3. Challenge: Look for alternative explanations, missing segments, weak causal claims, metric gaming, dependencies, and reasons the recommendation could fail.
    4. Decide: Have the accountable product leader and relevant partners accept, modify, or reject the recommendation. Record the trade-off explicitly.
    5. Publish: Store the decision, evidence, owner, expected outcome, guardrails, and next review trigger in the system the team already uses.

    Do not combine these passes into one request for a final answer. Extraction should not quietly prioritize. Synthesis should not hide inconvenient evidence. A challenge pass should test a proposed direction without changing the original evidence set. The human approval gate should be visible, not implied by the fact that somebody copied the output into a roadmap.

    Raw interviews, support threads, CRM records, and analytics exports can contain personal or confidential data. Do not paste them into an unapproved model. Minimize the data, remove identifiers that are not needed for the decision, use the governed environment approved by your organization, and retain only what the workflow requires. Privacy-by-design belongs at intake because redacting an output does not undo an inappropriate disclosure in the input.

    For recurring workflows, add acceptance criteria and evaluation cases. A discovery synthesis evaluation might check whether every theme retains evidence links, whether contradictions survive summarization, and whether unsupported market-size claims are rejected. A strategy evaluation might check whether every initiative maps to an outcome driver and whether an output has been mislabeled as an objective. Re-run those checks when the model, prompt, context set, or output schema changes.

    Use AI in discovery without laundering uncertainty

    Discovery generates exactly the kind of material language models handle well: interview transcripts, support conversations, journey notes, behavioral patterns, and open-ended hypotheses. AI can reduce the time between collecting this material and discussing it. It cannot make a biased sample representative or turn a correlation into a cause.

    Run synthesis as part of a weekly learning cadence that combines customer evidence with journey and behavioral analysis. Waiting for a large quarterly research readout increases the distance between observation and decision. Treating every new conversation as a roadmap mandate creates the opposite problem. A regular review gives the team a stable point at which evidence can accumulate, conflict, and change an existing belief.

    A cluster is a lead, not a finding

    Theme clustering is useful for navigation. It is not proof of importance. A frequent topic in support data may reflect product friction, a noisy customer segment, a documentation gap, or a recent incident. The model sees only the supplied dataset, not the market outside it.

    Require each proposed opportunity to include:

    • The affected segment and the context in which the problem occurs.
    • The job the customer is trying to complete.
    • Links to supporting observations, including direct customer language where it preserves important nuance.
    • The observed count within the supplied dataset, clearly distinguished from prevalence in the customer base or market.
    • Behavioral evidence that supports or challenges the qualitative pattern.
    • The outcome driver the opportunity could influence.
    • Contradictory evidence and plausible alternative explanations.
    • The unanswered question that creates the greatest decision risk.
    • The next piece of evidence that would materially change the decision.

    Then place the opportunity in an opportunity solution tree. Keep the opportunity separate from candidate solutions. If the branch says customers need an AI assistant, it has already collapsed a customer problem into a preferred implementation. Rewrite it in terms of the customer’s obstacle or desired progress, then generate multiple ways to address it.

    At the weekly review, ask four practical questions: What did the team observe? Which belief changed? Which important assumption remains weakly supported? What evidence should be collected next? AI can prepare the evidence packet and show deltas from the prior review. The product trio should decide what the evidence means and whether it changes the opportunity being pursued.

    Connect roadmap, experiment, launch, and learning

    A strategy loses integrity when each delivery stage invents its own explanation. The roadmap promises one outcome, the experiment measures another, the launch emphasizes a feature, and the retrospective celebrates shipping. AI can help maintain the thread, but only if the same hypothesis and metric definitions travel with the work.

    Decision layerUseful AI assistanceRequired human judgmentArtifact to preserve
    StrategyCheck the chain from customer value to business result and expose unsupported jumpsChoose the segment, differentiation, outcome, and trade-offsStrategy brief and driver tree
    DiscoveryExtract observations, cluster themes, retain contradictions, and draft opportunitiesInterpret evidence and choose the next uncertainty to reduceEvidence-linked opportunity record
    RoadmapMap candidate initiatives to drivers, surface dependencies, and prepare option comparisonsAllocate capacity and accept opportunity costPrioritization decision record
    ExperimentDraft hypotheses, instrumentation, guardrails, edge cases, and analysis checksApprove the test design, statistical assumptions, and decision ruleExperiment brief
    LaunchAdapt release notes, in-product guidance, support material, and segment messagingApprove claims, rollout risk, positioning, and readinessLaunch plan and approved message set
    LearningSummarize funnels, cohorts, retention patterns, qualitative feedback, and anomaliesDecide whether to continue, revise, expand, or stopLearning review and updated decision

    Make the roadmap show its reasoning

    Ask AI to produce roadmap options, not a single supposedly objective ranking. Each option should show the outcome driver it targets, evidence strength, important dependencies, unresolved risk, stakeholder impact, and the work displaced by choosing it. A priority score can organize inputs, but it cannot resolve a strategic disagreement about which customer or outcome matters most.

    Every roadmap item should answer: Why this customer problem, why now, what behavior should change, which business result should follow, and what observation would make the team reconsider? If the answer is merely that customers requested it or a competitor has it, the strategy is incomplete.

    Make experiments decision-ready before they run

    An AI-drafted experiment brief should contain a falsifiable hypothesis, eligible population, primary metric, guardrail metrics, instrumentation plan, exposure logic, expected mechanism, known confounders, and decision rule. For A/B testing, define the minimum detectable effect before interpreting results. The value must be tied to a practically meaningful change and checked against baseline behavior and available traffic; a model cannot infer those constraints from a feature description.

    Instrumentation deserves its own review. Specify the event, properties, eligibility conditions, trigger, and expected sequence in the funnel. Use behavioral analytics to check that exposure and activation are measured consistently across variants. Feature flags can separate deployment from release, support a controlled ramp, and limit exposure while the team checks behavior.

    For an AI-powered product experience, add eval-driven checks alongside product metrics. Define the behavior the model should exhibit, edge cases it must handle, unacceptable outputs, privacy constraints, and regression cases. Product success cannot compensate for a model behavior that violates an explicit safety or trust requirement.

    Keep launch language tied to the original value proposition

    AI can adapt UX copy, product tours, tooltips, release notes, in-app guides, and support macros for different segments. Give every channel the same approved value proposition, capability boundaries, terminology, and claims. Otherwise, speed creates message drift: the release note promises an outcome the interface does not support, while the support macro describes a different workflow again.

    After release, bring the original decision brief into the learning review. Examine the target cohort, funnel behavior, activation, retention, qualitative feedback, and guardrails. Do not ask only whether the feature was adopted. Ask whether the intended customer behavior changed, whether the assumed mechanism appears credible, and whether the business outcome remains a reasonable consequence.

    Scale the workflow only when another person can audit it

    Before expanding AI assistance across the product organization, hand one completed decision package to a colleague who was not part of the workflow. They should be able to identify the governing strategy, trace each important claim to evidence, see which assumptions remain open, understand the trade-off, and find the metric that will trigger the next decision.

    If they cannot, do not solve the problem with a longer prompt. Repair the missing artifact, unclear ownership, broken evidence link, or inconsistent metric definition. That is where strategic reliability lives.

    Start with one decision entering your next weekly discovery review. Build its evidence set, label observations and assumptions, run separate synthesis and challenge passes, and publish the human decision with its reversal signal. Once that chain survives review, reuse the workflow. The goal is not more AI-generated product work. It is a shorter, more inspectable path from customer evidence to a measurable strategic choice.

    References

  • 4 Costly Agent Analytics Myths—And the Data-Backed Metrics I Rely on Instead

    4 Costly Agent Analytics Myths—And the Data-Backed Metrics I Rely on Instead

    In my work with product, operations, and support leaders, I’m often asked to help make sense of Agent Analytics—what to track, how to attribute outcomes, and where to invest. After reviewing countless dashboards and running experiments across human agents and AI agents, I’ve learned that some of the most common measurement beliefs are precisely the ones that lead teams astray.

    What comes up in conversation with leaders about Agent Analytics, and why not everything is what it seems.

    Below, I unpack four pervasive myths I encounter and share the data-centered practices I use to replace them. My goal is simple: help you upgrade the way you measure performance so you can improve customer outcomes, accelerate learning, and scale impact with confidence.

    Myth 1: “Lower average handle time (AHT) means higher performance.” AHT is useful but incomplete. When teams optimize solely for speed, they often push complexity into repeat contacts, reopens, or escalations. In the data, that shows up as a weak or negative relationship between lower AHT and durable outcomes like first contact resolution (FCR), customer effort, or revenue per conversation.

    Reality and what I measure instead: I right-size speed by pairing AHT with intent-level resolution and recontact rate. For simple intents (password reset, billing address update), shorter is usually better. For complex intents (tiered troubleshooting, multi-step verification), “right-speeding” wins—slightly longer interactions that prevent rework. Practically, that means segmenting by intent complexity using behavioral analytics, tracking weighted “intent resolution rate,” and monitoring repeat-contact windows (24–168 hours) to catch downstream pain.

    Myth 2: “AI agent containment tells the whole story.” A high containment rate can mask failure modes such as unresolved intent, silent abandonment, or low-quality handoffs that frustrate customers and spike human workload later.

    Reality and what I measure instead: I break containment into three parts for voice and chat flows: (1) intent resolution without escalation, (2) graceful handoff quality when escalation is necessary, and (3) post-handoff efficiency and satisfaction. For voice AI agent experiences, I also track escalation clarity (did the transcript summarize history and intent?), time-to-human, and customer satisfaction on the combined interaction. This provides a fuller view of customer support ai strategy effectiveness and avoids over-crediting automation for partial wins.

    Myth 3: “Quality is subjective, so it can’t be measured at scale.” Teams often default to sporadic QA because they assume it can’t be standardized across channels or agent types. The result is noisy feedback loops and stalled coaching.

    Reality and what I measure instead: Quality becomes measurable when it’s grounded in observable behaviors linked to outcomes. I use a rubric anchored in behavioral analytics (e.g., verified customer need, correct resolution path, policy compliance, empathy markers) and validate it via correlation with FCR, recontact, and retention analysis. To scale, I combine calibrated human reviews with AI-assisted scoring, check inter-rater reliability weekly, and use driver trees to connect quality levers to business results. This creates a consistent, coachable signal for both human agents and AI flows.

    Myth 4: “If the dashboard is green after launch, we’ve won.” Early wins can reflect novelty effects, cherry-picked routing, or short-term incentives that don’t persist. Declaring victory too soon locks in fragile gains and hides regressions across cohorts.

    Reality and what I measure instead: I treat go-live as the start of learning. I use A/B testing with a clear minimum detectable effect (MDE), stagger ramps, and hold out stable control cohorts for at least one full demand cycle. I track outcomes vs output OKRs—focusing on intent resolution, customer effort, and revenue/customer health over vanity metrics. I also monitor seasonality and channel mix shifts inside a unified analytics platform to ensure improvements generalize beyond the first week.

    How I operationalize this day to day: (1) define intents and complexity upfront, (2) unify journey data across channels, (3) instrument resolution and recontact rigorously, (4) apply driver trees to isolate what actually moves outcomes, and (5) iterate via disciplined experiments rather than sweeping changes. This approach aligns product and operations, speeds up coaching, and ensures AI investments compound rather than decay.

    If you’re rethinking your Agent Analytics stack, start by replacing each myth with a sharper metric: pair AHT with intent-level resolution, pair containment with handoff quality and satisfaction, pair QA with outcome-linked rubrics, and pair green dashboards with robust experiments. The payoff is a measurement system that earns trust, guides better decisions, and consistently improves customer and business results.


    Inspired by this post on Pendo – Best Practices.


    Book a consult png image
  • CPO Leadership in the AI Era: A Practical System for Focus

    CPO Leadership in the AI Era: A Practical System for Focus

    You open a portfolio review and find an AI request from nearly every direction. One team wants an assistant. Another wants an agent. A third has a promising prototype that now needs production funding. Every request sounds plausible, yet approving all of them would spread the company across disconnected experiments.

    This isn’t primarily a prioritization problem. It is a leadership-system problem. Your job as CPO is to define the customer advantage worth pursuing, concentrate attention on a few coherent bets, specify the evidence that earns more investment, and make it clear what the company will stop doing. The roadmap should record those choices. It should not make them for you.

    Allocate attention before you allocate roadmap space

    AI expands the number of things a product team can plausibly build. It does not expand engineering capacity, customer attention, management bandwidth, or the company’s tolerance for operational risk at the same rate. That mismatch is why an orderly backlog can still represent a deeply unfocused strategy.

    A prototype adds to the confusion because it compresses the distance between an idea and a convincing demonstration. A good demo shows that a capability may be technically possible under selected conditions. It does not establish that customers will adopt it, that it will perform reliably across real workflows, that its economics will work, or that competitors cannot reproduce it.

    Before discussing priority, force each proposed investment through four decisions:

    • Customer advantage: What will a specific customer be able to do materially better, faster, or more safely?
    • Behavioral outcome: What observable change would show that the advantage matters, such as stronger activation, repeated use, retention, or expansion?
    • Business consequence: Which company outcome should move if the customer behavior changes, such as NRR, gross margin, payback, or cost-to-serve?
    • Opportunity cost: Which existing initiative, workflow, or commitment will receive less attention if this bet is funded?

    The fourth decision is where focus becomes real. If a proposal enters the portfolio without displacing time, money, or executive attention somewhere else, the company has not prioritized it. It has merely added it.

    A shared driver tree makes these trade-offs visible. Start with the company outcome. Connect it to the customer behavior that must change, the product lever expected to change that behavior, and the evidence required from the current initiative. If a team cannot draw a credible path through those layers, pause the funding discussion until it can. That is more useful than arguing about whether the item belongs near the top or middle of a feature list.

    Your leadership context changes how you create this clarity. In a founder-led company, you often need to influence without becoming deferential: preserve the ambition in the founder’s vision while pressure-testing assumptions with customer evidence, data, and portfolio consequences. Under a hired CEO, the emphasis shifts toward explicit investment theses, capital allocation, and a tighter connection among product, financial, and go-to-market plans.

    In either setting, ambition must be more precise than a mandate to become an AI company. Name the customer capability you want to own, the workflow in which it matters, and the durable advantage the company can build around it. Technology is an ingredient. Customer advantage is the strategic claim.

    Turn AI feature requests into testable investment theses

    A feature request arrives with a solution already embedded in it. An investment thesis keeps the solution open long enough to test whether the opportunity deserves capital. That distinction matters when models, interfaces, and implementation patterns are changing faster than an annual plan can absorb.

    Rewrite each material AI proposal using this structure:

    <!– wp:list {
  • A Practical Customer Insight System for Product-Led Growth

    A Practical Customer Insight System for Product-Led Growth

    You have customer interviews, support tickets, sales objections, funnel dashboards, and a backlog full of requests. Yet activation is still stalled, retention remains uneven, and every team has a different explanation for why.

    The problem is rarely a shortage of feedback. It is the absence of a reliable path from customer evidence to a self-serve product experience. You need an insight system that identifies the real obstacle, proves that it matters to the right segment, and scales the solution without making every customer depend on a call, a CSM, or a custom implementation.

    Start with the growth outcome, not the feedback inbox

    A customer insight is not a quote, a feature request, or a chart. It is an evidence-backed explanation of why a defined group of customers is or is not reaching an outcome.

    That distinction matters in product-led growth. A request can be sincere and still point toward the wrong solution. A funnel can reveal a drop-off and still tell you nothing about the customer’s intent. An insight connects the customer’s job, observed behavior, friction, and business consequence closely enough to support a decision.

    Begin with the outcome you need to understand:

    • Activation: Are new customers completing the behavior that represents first value?
    • Adoption: Are activated customers using enough of the core workflow to make the product part of their routine?
    • Retention: Are the right customers continuing to receive value after the novelty and onboarding assistance disappear?
    • Expansion: Is deeper usage creating a credible path to more seats, more workflows, or additional capability?

    Build a driver tree beneath that outcome. If activation is the target, its branches might include setup completion, successful data connection, first completed workflow, and collaboration. If expansion is the target, the branches might include activation depth, feature breadth, additional users, and new use cases. The tree gives customer evidence a destination. An observation that cannot be tied to a growth outcome or one of its drivers may still be interesting, but it is not ready to shape the roadmap.

    Define each metric before gathering evidence around it. Product teams often use terms such as activation, onboarding, and first value as if they were interchangeable. They are not. A dependable metric catalog specifies the formula, behavioral event, cohort, time window, exclusions, owner, and lineage. Without that contract, two teams can analyze the same customer journey and reach incompatible conclusions because they silently measured different things.

    The same discipline applies to revenue outcomes. Net recurring revenue can be expressed as starting monthly recurring revenue plus expansion, less contraction and churn, divided by starting monthly recurring revenue. That lagging result becomes useful for product discovery only after you connect it to leading behaviors by segment. Otherwise, you know revenue moved but not what product behavior might explain the movement.

    Capture each candidate insight in a standard record:

    • The target segment and use case.
    • The job the customer is trying to complete.
    • The expected growth outcome and driver-tree branch.
    • The observed behavior, including where the journey changes or stops.
    • The customer’s stated friction, goal, or workaround.
    • The consequence for time-to-value, adoption, retention, or expansion.
    • The evidence supporting the interpretation and the evidence still missing.
    • The next decision the insight is meant to inform.

    Keep observation, interpretation, and decision separate. “Customers abandon setup after reaching permissions” is an observation. “They do not trust the permission model” is an interpretation. “Redesign the permissions screen” is a decision. Combining all three in one sentence makes an assumption look like evidence.

    Move insights through three levels of leverage

    Product-led growth does not require you to avoid high-touch customer work. It requires you to learn from that work without making high-touch intervention the permanent delivery model.

    I use three levels to manage that transition: close customer diagnosis, repeatable internal operations, and customer-facing product. Each level answers a different question.

    1. Diagnose the problem in context. Work closely enough with a customer to see the entire job: the intended outcome, existing process, product configuration, behavior path, workaround, and point of failure. The objective is learning, not merely satisfying the account’s request.
    2. Turn the diagnosis into a repeatable internal workflow. Standardize the inputs, analysis, output, and recommended action so customer success, sales, or support can apply the learning to other relevant accounts. This stage tests whether the insight travels beyond the original customer.
    3. Promote the proven pattern into the product. Give customers the diagnosis, recommendation, or improved workflow directly. The product must work reliably across its intended audience without a specialist interpreting every result.

    The first version can be deliberately manual. One customer automation analysis took more than half a day to prepare and visualize. It predicted a 70% automation rate for that customer, which the customer then achieved. A single match does not prove that the method generalizes, but the manual work exposed a useful taxonomy and a measurable hypothesis. That taxonomy could then be operationalized across more customers before becoming customer-facing.

    The lesson is not that every manual analysis deserves automation. Manual work is a discovery instrument. It lets you identify the variables, edge cases, and next actions before engineering a permanent system around them.

    Use a promotion gate before moving an insight from one level to the next:

    • Problem repeatability: The same underlying job and obstacle appear across the intended segment, even if customers describe them differently.
    • Diagnostic stability: Different people can use the same inputs and reach a consistent interpretation.
    • Action repeatability: The recommended intervention helps customers take a recognizable next step rather than producing an interesting report.
    • Outcome visibility: You can observe whether the customer completed the behavior the intervention was meant to change.
    • Bounded exceptions: You understand where the method fails, which configurations require special handling, and when a human must intervene.
    • Product leverage: Self-service delivery creates enough customer value to justify product complexity, maintenance, and support.

    Stopping at the internal-workflow level can be the correct decision. If an analysis is valuable only for a narrow set of complex accounts and still requires expert judgment, forcing it into a universal feature can make the product harder to understand. Productization is earned through generalization; it is not the automatic reward for discovering a customer problem.

    Combine customer language, behavior, and commercial impact

    No single signal can carry a product decision. Interviews reveal goals and reasoning but not prevalence. Behavioral data reveals sequences and drop-offs but not intent. Support and sales conversations expose recurring friction but overrepresent customers who chose to speak. Revenue data shows consequence but rarely identifies the mechanism.

    SignalWhat it can tell youWhat it cannot establish alone
    Customer interview or workflow observationThe job, desired outcome, constraints, vocabulary, and workaroundHow common the problem is or whether a proposed change will alter behavior
    Product behaviorWhere users stop, repeat actions, take alternate paths, or differ by cohortWhy the behavior occurred or what outcome the user expected
    Support, success, and sales conversationsRecurring confusion, implementation blockers, objections, and unmet expectationsThe rate among all customers exposed to the same experience
    Commercial outcomesWhich segments expand, contract, renew, or leaveWhich product mechanism caused the result
    Experiment or staged interventionWhether a defined change moves a specified behavior for the eligible cohortWhy every customer responded as they did or whether the effect will persist indefinitely

    Triangulation means linking these signals at the level of a segment and use case, not dropping them into one large feedback pile. Segment retention and adoption by plan, customer size, and use case. Then compare customers who reached the target outcome with customers who encountered the suspected obstacle.

    A practical investigation sequence looks like this:

    1. Define the eligible cohort using the metric contract.
    2. Locate the behavioral inflection: the step, sequence, or period where successful and unsuccessful journeys diverge.
    3. Inspect the surrounding support conversations, implementation notes, and known configuration differences.
    4. Talk with customers from both sides of the divergence. Ask them to reconstruct what they were trying to do, what they expected, and what they did next.
    5. Write the narrowest explanation consistent with the evidence, including plausible alternatives.
    6. Specify the behavior that should change if the explanation is correct.

    For example, suppose customers complete a technical connection but do not proceed to the collaborative part of a workflow. The evidence does not yet justify “build better team invitations.” Customers may not understand the next step, may not need collaborators for that use case, may lack permission to invite them, or may not have received enough value to involve colleagues. Each explanation implies a different solution and a different test.

    This is also where AI-assisted analysis either becomes valuable or produces confident noise. An agent can help retrieve related conversations, run a defined funnel, compare cohorts, and assemble prior experiment results. It cannot compensate for contradictory activation definitions or an event taxonomy that nobody owns. A retrieval-first system grounded in canonical metrics, event definitions, cohort logic, dashboards, and versioned analysis gives the agent something stable to reason from.

    Preserve provenance. Every generated synthesis should retain links to the customer evidence, metric definition, query, and decision record behind it. Apply the same permissions and PII controls used for the underlying systems. Faster synthesis is useful only when a product manager or analyst can inspect how the conclusion was formed.

    Prioritize customer problems by leverage, not request volume

    The loudest request is not necessarily the largest opportunity. Enterprise accounts generate detailed feedback because they have access to account teams. New self-serve users often leave silently. A raw count therefore measures how feedback entered the company as much as it measures customer need.

    Frequency without a denominator is especially misleading. “This appeared in many tickets” is weaker than “this appears among customers who attempted this workflow.” Always compare the affected group with the population exposed to the same experience, then keep the result segmented by use case and customer type.

    Before assigning a score, run each opportunity through six questions:

    • Outcome: Which activation, adoption, retention, or expansion driver does this problem obstruct?
    • Segment: Does it affect the customers and use cases the product is designed to serve?
    • Evidence: Do customer language and observed behavior support the same explanation?
    • Consequence: Does the friction delay value, block a core job, increase dependency on assistance, or precede contraction?
    • Leverage: Can a reusable product change solve the problem without recreating a custom service for every account?
    • Testability: Can you define the eligible cohort, expected behavior change, observation window, guardrail, and decision rule before shipping?

    If an opportunity fails the outcome or evidence question, investigate it rather than prioritizing it. If it fails the leverage question, consider an internal tool, implementation playbook, or targeted service. If it fails testability, improve the instrumentation before making a broad release.

    Write the opportunity without embedding the preferred feature:

    For [segment] trying to [complete a job], [observable friction] prevents or delays [customer outcome]. This appears in [customer evidence] and [behavioral or commercial evidence]. If the explanation is correct, changing [part of the experience] should move [leading behavior] while preserving [guardrail].

    That statement gives design and engineering room to find the smallest appropriate intervention. The answer may be clearer positioning, contextual education, a better default, a repaired workflow, a new capability, or a human-assisted path for exceptional cases.

    Do not use in-app guidance to wallpaper over a missing capability. Guides, tours, and contextual tooltips can make the next value-producing action clearer when the product already supports the customer’s job. They cannot make an irrelevant or broken workflow valuable.

    Define success before implementation. Name the primary behavior, eligible cohort, measurement window, and guardrails. If you run an A/B test, establish the minimum detectable effect and decision criteria in advance. If the eligible population cannot support a reliable experiment, use a staged release and cohort evidence, but do not describe an observational difference as causal proof.

    Make customer learning part of the operating cadence

    A strong insight repository can still become a graveyard if it is separated from planning and growth reviews. Put customer learning into the cadence where trade-offs are made.

    Use a weekly driver-tree review for operating decisions. Review movement in the relevant outcome by segment, newly triangulated insight records, active tests, and results from prior interventions. Every item should leave the meeting in a named state: gather evidence, test a hypothesis, operationalize internally, productize, monitor, or stop. Record the owner, missing evidence, next action, and reason for the decision.

    Keep strategic and execution cadences distinct. QBRs are useful for examining value realized, retention risks, and expansion paths with customers. OKRs translate the resulting priorities into owned cross-functional work. The weekly review manages learning and experiments between those larger checkpoints. This prevents a quarterly customer conversation from becoming an isolated presentation with no route into product execution.

    Assign clear responsibilities:

    • Product owns the problem framing, decision record, and promotion between levels of leverage.
    • Research and design protect the customer’s context, job, language, and workflow.
    • Data protects metric validity, cohort logic, instrumentation, and the distinction between correlation and causation.
    • Customer success, support, and sales contribute evidence with account and use-case context rather than forwarding unqualified requests.
    • Engineering identifies technical constraints, edge cases, observability needs, and the ongoing cost of operating the solution.

    Close the loop in three places. Tell participating customers what was learned or changed without promising that every request will ship. Tell internal teams why the opportunity advanced or stopped. Feed the result back into the insight system so future decisions can retrieve the hypothesis, intervention, and observed outcome.

    If AI helps operate that system, evaluate it as a product rather than trusting plausible prose. Useful quality dimensions include faithfulness to metric definitions, numerical accuracy, latency, and actionability. Log accepted answers, material edits, and overrides. Those signals reveal where retrieval, taxonomy, permissions, or evaluation cases need improvement.

    Key takeaways

    • Anchor customer evidence to a defined growth outcome and driver tree before discussing solutions.
    • Treat feature requests as entry points for investigation, not as validated insights.
    • Combine customer language with behavioral and commercial evidence at the segment and use-case level.
    • Move learning from close diagnosis to a repeatable internal workflow before making it a universal product feature.
    • Prioritize problems that are consequential, repeatable, measurable, and suitable for self-service delivery.
    • Use a weekly decision cadence so each insight advances, gathers evidence, or stops.

    At your next growth review, choose one stalled outcome and trace it to one customer segment, one behavioral inflection, and the conversations surrounding that moment. Write the insight record before proposing a feature. Then decide whether the next move is deeper diagnosis, an internal workflow, or a product experiment.

    That small discipline changes the purpose of customer feedback. It stops being material for a backlog and becomes a system for helping more customers reach value on their own.

    References

  • How We Taught Agentic AI to Speak Product Analytics—and Unlocked Actionable Insights

    How We Taught Agentic AI to Speak Product Analytics—and Unlocked Actionable Insights

    I set out to solve a deceptively simple problem: help our teams ask product questions in plain English and get trustworthy, analysis-grade answers—fast. That required more than a powerful model; it demanded agents that genuinely understand the language of product analytics, from behavioral analytics nuances to the messy reality of event taxonomies, funnels, and cohorts. In this post, I share how we engineered agentic AI that speaks our domain fluently and turns questions into decisions.

    The core challenge wasn’t data volume or dashboard sprawl; it was semantics. Different teams said “activation,” “onboarding,” or “first value” and meant overlapping but distinct things. Our PMs, analysts, and engineers navigated a maze of synonyms across Amplitude analytics, Pendo, and our unified analytics platform. Generic LLMs stumbled on these nuances, so we built a shared ontology—driver trees anchored to a clear North Star—with canonical definitions for activation, retention, and conversion, plus consistent event naming and cohort logic.

    We started with a rigorous metric catalog: every KPI linked to its drivers, exact formulas, cohorts, and time windows; every event mapped to a product taxonomy; every dashboard and SQL snippet versioned with ownership and lineage. That catalog became the ground truth for agents. We embedded data governance and privacy-by-design from the start—permissioning for fields and queries, PII redaction, and scoped access that reflected how product teams actually work.

    Next, we built a retrieval-first pipeline to ground the agents in our corpus before generation. We indexed metric definitions, dashboards, experiment readouts, runbooks, and high-signal Slack threads so the agent could cite relevant artifacts, not just predict plausible text. With careful context window management and prompt engineering, the agent retrieves definitions and prior analyses, then plans multi-step actions: run a query, compare cohorts, check “minimum detectable effect (MDE)” for an A/B test, and summarize findings with references.

    Architecturally, we treated this as “Agent Analytics”: an orchestrator that selects tools based on intent—querying Amplitude analytics or Pendo for behavioral paths and funnels, hitting our warehouse for cohort tables, or pulling experiment metadata and anomaly detection alerts. Tool use is permission-aware, auditable, and designed to fail safe. The agent’s outputs include citations back to the exact definitions, dashboards, and SQL used, so reviewers can validate and iterate.

    Quality came from eval-driven development, not intuition. We built a gold set of representative product questions (activation inflections, retention analysis by segment, funnel drop-offs after feature launches) and scored the agent on faithfulness to definitions, numerical accuracy, latency, and actionability. We incorporated regression checks to catch drifts after schema changes, and we tuned prompts to reduce overconfident answers and push for clarifying questions when context was missing.

    Safety and reliability were non-negotiable. We layered AI risk management with role-based access, guardrails that block destructive queries, and risk scoring for unfamiliar joins or sudden spikes in metric deltas. The agent logs every step—what it retrieved, which tools it called, and why—so analysts can replay and refine the chain of thought with transparent provenance.

    The payoff: product teams now self-serve nuanced questions in minutes instead of days, and our analysts spend more time on discovery than report wrangling. Retention analysis improved as the agent standardized cohort logic; conversion investigations accelerated thanks to consistent funnel definitions; and cross-functional decisions aligned around the same driver trees and shared language. Most importantly, the agent turned ambiguous asks into structured analyses that stand up to scrutiny.

    For fellow product leaders, my lesson is simple: start with semantics, not models. A crisp ontology, disciplined taxonomy, and clear ownership will outperform a flashy stack riddled with ambiguity. Avoid technology FOMO; favor retrieval-first grounding, small sharp tools, and continuous discovery with your product trios. When your organization speaks a common analytics language, agents can finally think with you, not just for you.

    Next, we’re extending the agent’s planning skills to recommend experiment designs, estimate power and “minimum detectable effect (MDE),” and propose driver-tree-informed bet sizing. We’re also tightening feedback loops so every accepted answer, edit, or override strengthens the retrieval corpus and evaluations. The vision: a calm, reliable layer that makes rigorous product analytics feel conversational—and helps teams move from questions to confident action.


    Inspired by this post on Amplitude – Best Practices.


    Book a consult png image