I’ve watched the rise of product engineering up close, and it’s reshaping how we build software. The old model of rigid handoffs and separate functions is giving way to small, empowered product teams where engineers own the customer problem end to end. That shift isn’t just cultural—it’s a performance advantage that compounds with every release.
I often summarize it this way: “Product engineers are taking over. They ship code, talk to users, and own outcomes—no handoff required. Here’s what the role is, and why it matters now.”
When I say “product engineer,” I’m describing a builder who goes beyond writing code. I expect them to partner in product trios with product management and design, participate in continuous discovery, and make decisions grounded in product strategy and real customer insight. They don’t toss features over a wall; they own the problem, the solution, and the measurable outcome.
Why now? Modern delivery practices like CI/CD and feature flags compress feedback loops, while behavioral analytics and session replay make customer friction visible in real time. As expectations rise for quick iterations and clear value, teams that reduce handoffs and align around outcomes outperform on DORA metrics such as deployment frequency and lead time for changes.
Day to day, a strong product engineer blends discovery and delivery. They join customer interviews, review support tickets, analyze usage patterns, and run A/B testing to validate hypotheses. Then they ship code in small, safe increments, instrument telemetry, and watch adoption and retention signals to confirm they’re moving the numbers that matter.
Team shape matters. I favor compact, cross-functional squads anchored by product trios, each with explicit outcomes vs output OKRs. Product engineers often operate like forward deployed engineers, partnering with customer success and solutions engineering to learn at the edge of real-world usage. This proximity to customers turns ambiguity into insight—and insight into product leverage.
Accountability is concrete. We track DORA metrics for delivery health and pair them with product outcomes such as activation, time-to-value, and Net Recurring Revenue (NRR) drivers. The combination keeps us honest about both how fast we move and whether what we ship truly works for customers.
The hiring profile is distinct. I look for engineers who are curious about the “why,” comfortable with trade-offs, and energized by customer conversations. They can navigate architectural complexity, but they also translate user feedback into crisp product bets. Many grow into natural facilitators of discovery rituals and developer evangelism across the organization.
If you’re getting started, pilot a single squad. Establish clear outcomes vs output OKRs, invest in CI/CD and feature flags, and commit to continuous discovery with weekly customer interviews. Give the team ownership of a KPI tied to product strategy, and measure progress with DORA metrics plus usage and retention signals. The early wins—fewer handoffs, faster learning, tighter feedback loops—build momentum quickly.
In short, product engineers thrive where accountability, autonomy, and user empathy meet. They reduce wasteful coordination, shorten the path from insight to impact, and ensure we ship code that customers actually adopt. That’s why this role is reshaping how software gets built—and why the teams that embrace it will set the pace for everyone else.
Package supply chain security is not simply a matter of choosing reputable libraries. The practical challenge is controlling an expanding dependency graph, the code that executes during installation, the resources that installed software can reach, and the automated tools allowed to make those decisions.
A useful defensive model follows the path an attack must take: enter through a package or dependency, execute in the development environment, discover valuable information, and transmit it elsewhere. Organizing safeguards around that sequence produces a stronger posture than relying on any single scanner, sandbox, or package reputation signal.
Package risk grows through the dependency graph
Developers usually evaluate the packages they select directly. The less visible risk lies in transitive dependencies: packages installed because another dependency requires them. The source article illustrates the scale of this effect by reporting that installing Jest brought in 266 packages. That example is not evidence that those dependencies were malicious; it shows how one deliberate choice can create hundreds of additional trust relationships.
This changes the unit of review. The relevant question is not only whether a named package appears legitimate, but whether its complete dependency graph is proportionate to the job. A small utility that introduces unfamiliar native modules, unrelated capabilities, or an unexpectedly broad tree deserves more scrutiny than its simple interface might suggest.
Manifests such as package.json, pyproject.toml, and requirements.txt make dependency installation repeatable. Repeatability alone, however, does not guarantee safety. If version ranges or unresolved transitive dependencies allow later releases to enter automatically, two installations based on the same manifest can produce different risk profiles. Pinning direct and transitive versions converts an evolving external graph into a more deliberate, reviewable input.
Match defenses to the stages of a package attack
The source article says an analysis covering more than 230,000 malicious-code incidents found a recurring pattern: malicious code first needs an entry point, then searches the device for sensitive data, and finally uses a network connection to exfiltrate what it finds. This reported pattern suggests three distinct control points.
Reduce risky entry and automatic execution
A waiting period for newly published packages can reduce exposure to releases that have not yet attracted community scrutiny. The article recommends installing only packages that are at least seven days old. That is a risk filter, not a guarantee: an older malicious package can remain undetected, while a legitimate urgent fix may occasionally justify an exception.
Installation scripts require separate treatment because they may execute before a developer has inspected the installed code. Disabling automatic install hooks by default creates a decision point. A package that depends on a post-install action can still be used, but the script, its purpose, and the capabilities it invokes should be reviewed first.
Constrain access after installation
Pre-install review cannot catch every problem. The next layer limits what package code can inspect or modify if it does execute. Sandboxed folders and isolated development environments can reduce the blast radius, but the source cautions that isolation by itself does not prevent malicious code from entering. Access boundaries therefore complement package controls rather than replace them.
Limit unnecessary network egress
Stolen information has less value to an attacker if malicious code cannot transmit it. Restricting unnecessary outbound connectivity addresses the final stage of the reported pattern. This layer matters because a package may evade provenance review and execute inside an environment despite earlier controls. Entry controls, resource boundaries, and egress restrictions together create independent opportunities to interrupt the attack.
Provenance is a decision process, not a trust badge
No single popularity or identity signal proves that a release is safe. The source proposes evaluating maintainer history, download patterns, repository activity, signed releases, and consistency across registries. Their value comes from comparison: a sudden change in maintainership, an unusual release pattern, or a mismatch between repository and registry information may warrant investigation even when each signal looks plausible in isolation.
Context also matters. Dependency behavior should be compared with the package’s stated purpose. A capability that is normal for a database driver may be difficult to justify in a formatting utility. This purpose-to-capability test helps teams focus limited review time on anomalies rather than treating every dependency as equally suspicious.
These checks work best when they lead to a clear disposition: approve the package and lock the reviewed version, replace it with a narrower dependency, inspect it more deeply, or decline it. Provenance information without a decision rule can become documentation that does not change behavior.
AI coding agents must inherit the same installation policy
AI-assisted development introduces a governance problem as much as a technical one. A coding agent may be able to select and install a package while pursuing a larger task, compressing several human decisions into one automated action. If it can also reach broad areas of the file system and use the network, a malicious dependency may encounter a larger potential blast radius.
The source describes workflows in which Claude searches, creates, and edits files across a broad knowledge system, including notes derived from downloaded PDFs. That breadth provides productivity value, but it also makes one-folder isolation impractical for the reported workflow. The proposed response is disciplined configuration: hooks require the agent to follow the same package-age, install-script, provenance, and dependency rules expected of a human developer.
This principle is more durable than a rule tied to one assistant. Package policy should apply consistently whether an installation is initiated by a developer, an AI agent, a local automation script, or a build process. The initiator may change; the acceptable evidence, permissions, and exceptions should not.
Key takeaways
Review the full dependency graph, because the packages selected directly represent only part of the installed attack surface.
Use a waiting period for new releases as one filter, while preserving a documented path for justified exceptions.
Prevent install scripts from running automatically until their purpose and behavior have been examined.
Combine provenance checks with a purpose-to-capability test and an explicit approve, investigate, replace, or reject decision.
Pin direct and transitive versions, then run recurring audits to detect issues discovered after installation.
Apply the same package rules to coding agents, automation, local development, and build environments.
Layer installation controls, resource constraints, and network egress limits so that one missed signal does not determine the outcome.
A mature package security posture will increasingly depend on making these controls routine and machine-enforceable. As development becomes more automated, the teams best positioned to move quickly will be those that turn package trust from an informal judgment into a consistent operating policy.
Reusing an AI agent capability can accelerate delivery, but reuse also multiplies the consequences of an undetected defect. A retrieval component, tool-call routine, or safety check may appear in several workflows, so its quality cannot depend on the team that happens to integrate it next.
The practical answer is to package each reusable skill with an evaluation contract: defined behavior, test fixtures, observability, guardrails, and outcome measures that travel with the component. Read together, the two source articles outline how modular workflow design and eval-driven development can reinforce each other from prototype through production.
Reuse requires a contract, not just a prompt
The AI skills library article describes modular capabilities for retrieval and grounding, summarization, classification, tool use, data enrichment, safety controls, and evaluation harnesses. Its central architectural idea is consistency: common interfaces and conventions allow teams to compose capabilities and replace implementations without rebuilding an entire flow.
That modularity addresses code and workflow reuse, but it leaves an important product question: what must remain true when an implementation is replaced? The product-manager evaluation playbook supplies the missing half. It calls for versioned prompts, tools, and datasets; fixed offline scenarios; production experiments; and traces that expose how an agent reached an answer.
The synthesis is an evaluation contract attached to every reusable skill. The contract defines acceptable inputs and outputs, relevant policies, expected telemetry, representative tests, and promotion thresholds. A skill is then reusable because its behavior can be checked repeatedly, not merely because its code can be imported.
This distinction matters most in composed workflows. A summarizer that performs well on clean text may behave differently after a weak retrieval step. A tool-use component may generate a plausible response even when the underlying action fails. Reusable interfaces make these components interchangeable; evaluation contracts make the substitutions accountable.
Measure four layers of agent quality
No single score can represent the quality of a reusable agent workflow. The evaluation article separates concerns such as task success, factuality, safety, latency, cost, evidence quality, and product outcomes. The skills-library article adds operational concerns around guardrails, runtime metrics, and production monitoring. Combined, they suggest a four-layer model.
Evaluation layer
Question it answers
Reusable evidence
Reported signals
Component behavior
Does the skill perform its assigned task?
Fixed fixtures, golden examples, and domain scenarios
Task success, factuality, and retrieval evidence quality
Safety and policy
Does it remain within required boundaries?
Adversarial cases, policy checks, and guardrail configurations
Safety performance, PII handling, and content-policy adherence
Operational performance
Can it run reliably within product constraints?
Traces, logs, version records, and production dashboards
Latency, cost, tool success, and fallback behavior
Product impact
Does better agent behavior create user or business value?
Experiment definitions and driver-tree mappings
Task completion, satisfaction, activation, retention, and NRR
The layers should remain distinguishable even when a dashboard brings them together. If a workflow’s task-success score rises while latency or cost deteriorates, the trade-off should be visible. If offline factuality improves without changing completion or satisfaction in production, the result should not automatically be treated as a product win.
Retrieval-first workflows illustrate the value of separation. The evaluation playbook recommends assessing the quality of retrieved evidence independently from generation. That boundary makes a failure attributable: the system can distinguish missing or irrelevant evidence from a generator that mishandled useful context. The same principle applies to classification, tool selection, tool execution, and response composition.
A reusable workflow needs a controlled promotion path
The two sources describe complementary stages rather than competing evaluation methods. The skills-library article starts with a quick-start chain, configurable skills, guardrails, evaluation datasets, and instrumentation. The evaluation playbook places fixed offline suites before user exposure, followed by controlled online validation. Together they form a promotion path from composable prototype to measured production capability.
Offline evaluation establishes eligibility
A candidate workflow should first face stable examples representing core scenarios, known failure modes, edge cases, adversarial prompts, and domain-specific questions, as reported by the evaluation playbook. Stable fixtures make comparisons reproducible when a prompt, model, tool, retrieval strategy, or policy changes. Running these checks through CI/CD, as proposed in the skills-library article, turns evaluation into a regular release control instead of a separate audit.
Model-based judges can expand coverage for qualities such as helpfulness, coherence, and adherence, but the evaluation article cautions that they require calibration against a small, high-quality human-labeled set. It also recommends monitoring judge drift and retaining human review for edge cases or flows where mistakes carry greater consequences. A reusable judge configuration should therefore include its rubric, reference labels, version, and conditions for escalation.
Online evaluation establishes value
Passing offline checks shows that a variant is eligible for controlled exposure; it does not prove that users benefit from it. Both articles describe feature flags and A/B testing as mechanisms for comparing workflow variants in production. The evaluation playbook identifies conversation outcomes, tool success rates, human-support fallbacks, and user satisfaction as useful online signals.
This staged approach also limits ambiguity. An offline regression can block a weak component before exposure, while an online experiment can test whether an eligible improvement changes real behavior. Promotion should depend on both: acceptable component performance and evidence that the complete workflow advances its intended outcome.
Traces turn composition failures into fixable problems
Composability increases the number of boundaries at which a workflow can fail. The evaluation playbook treats traces as the backbone of agent evaluation because they record inputs, intermediate actions, invoked tools, and final responses. The skills-library article similarly connects reusable chains to logs, traces, metrics, and production dashboards.
A final-answer score alone may reveal that a workflow failed, but a trace can localize the failure. It can show whether retrieval supplied poor evidence, classification selected an unsuitable route, a tool call failed, a guardrail intervened, or generation ignored valid context. This makes evaluation useful for component ownership: teams can repair the relevant skill rather than adding a broad prompt patch to the entire chain.
Trace analysis also supports reuse decisions. If one component repeatedly causes latency, cost, or safety regressions across several workflows, improving that shared component may create more value than optimizing each application independently. Conversely, a component that succeeds in one context but fails in another may need a narrower contract rather than a universal interface.
Versioning is essential to that diagnosis. The evaluation playbook recommends versioning prompts, tools, and datasets, while the skills-library article emphasizes swappable implementations and comparable variants. Without linked versions for the component, evaluation set, judge, and workflow configuration, an apparent improvement may be difficult to reproduce or attribute.
Governance and product outcomes belong in the same system
Reusable workflows can spread good controls, but they can also propagate weak ones. The skills-library article reports guardrails for PII redaction, content-policy checks, and rate limiting, alongside configuration intended to support privacy-by-design. Packaging these controls as reusable capabilities can make the approved path easier to adopt, while evaluation fixtures test whether the controls continue to work as surrounding workflows change.
Governance should not be reduced to a final pass-or-fail gate. Safety, privacy, and policy behavior need their own cases and traces throughout development. The amount of human review can then reflect the cost of error, consistent with the evaluation playbook’s recommendation to retain human oversight for higher-risk flows.
The same evaluation system must connect technical quality to product value. The evaluation playbook proposes a driver tree that links per-turn measures such as helpfulness, safety, and latency to session outcomes such as task completion, and then to product measures including activation, retention, and Net Recurring Revenue. This hierarchy prevents a local metric from becoming the objective by default.
For product teams, the resulting unit of roadmap work is not simply a new skill. It is a versioned capability with evidence about behavior, operational fitness, policy compliance, and contribution to an intended outcome. That shared definition gives product trios, engineers, and governance stakeholders a more precise basis for deciding whether to reuse, revise, or retire a component.
Key takeaways
Package each reusable agent skill with an evaluation contract covering behavior, fixtures, telemetry, policies, and promotion criteria.
Keep component quality, safety, operational performance, and product impact distinct so improvements and trade-offs remain attributable.
Use fixed offline evaluations to establish release eligibility, then controlled online experiments to determine real-world value.
Trace intermediate steps and tool activity so failures can be assigned to the correct component instead of patched at the final response.
Version workflows, prompts, tools, datasets, and judges together so results remain comparable and reproducible.
As skill libraries expand, their lasting advantage will come from accumulated evidence rather than component count. Teams that make evaluation portable alongside implementation can reuse workflows without surrendering visibility, governance, or product accountability.
I’m getting sharper, more specific questions about scale from enterprise customers every quarter, and that’s exactly how it should be. Teams want to know how our platform behaves during their highest-volume moments — the Black Friday sales, the sporting events, the production incidents — and they want confidence their growth won’t outpace the systems they depend on.
We welcome those questions. They’re the right ones to ask of any critical component of your business.
Today, our systems handle serious scale. At daily peak, we see over 150,000 customer requests per second coming into the platform, with more than 70,000 asynchronous requests per second flowing through the background systems. During our busiest days of the week, we handle over five million conversations and more than 100 million comments being added across the platform.
We also design for individual customer spikes, not just aggregate platform traffic. We can handle a single customer workspace spiking with hundreds of comments per second, or around 100 new conversations per second. Sustained over a full day, that would map to millions of conversations from a single customer.
While those numbers matter, they age quickly. Every growing software company can publish a bigger number every year, month, week. What ultimately matters is whether the architecture has clear scaling levers, whether we understand the pressure points in the system, and whether we can add capacity before customers need it.
Every system has limits. Competence is knowing where they are, measuring them, and moving them before customers reach them.
Here’s how we do that in practice.
We build on boring foundations because at the edges, we try hard not to be clever. We use AWS for the infrastructure primitives AWS is very good at running. We do not want our engineers spending their best energy recreating S3, load balancers, queues, or commodity infrastructure patterns. We want that energy spent on the parts of the system that are specific to our customers and our product.
“That is a deliberate trade-off. It gives us fewer systems to understand, deeper expertise in the ones we do run, and more leverage when we need to scale.”
This extends a principle I’ve embraced for years: run less software. The point isn’t to minimize the stack for its own sake; it’s to compound expertise. When many teams build on the same small set of technologies, our tooling, observability, and operational practice all improve together. Boring technology choices aren’t a lack of ambition — they reserve our ambition for the nuanced scaling challenges that matter.
The source of truth is the hard part. You can scale stateless web traffic by adding machines, add queue consumers, and add cache. Those are real problems — just not the hardest ones. The source-of-truth database is where the most important data lives, where the hardest correctness guarantees exist, and where maintenance windows often come from. It has to be correct, fast, resilient to failover, capable of large migrations, and able to keep serving traffic while we improve it. As customers grow, it cannot require a full re-architecture every time the next ceiling appears.
That is why we moved to Vitess, managed by PlanetScale. The goals were clear: improve availability, reduce operational complexity, make large table migrations safer, simplify MySQL scaling, and eliminate customer downtime from routine database maintenance and failovers. When we first laid out this direction, the largest part of the migration was still ahead of us. We completed that migration in 2025, and the benefits are now part of how we operate the platform day to day.
Today, our highest-scale source-of-truth data is spread across 128 shards. The database layer handles around two million requests per second, with more than ten million cache reads per second in front of it. For the largest customers, we can isolate and scale database capacity independently, including dedicating a shard to a single customer when needed.
We have not come close to needing that, which is significant. The goal of architecture like this is not to run every system at the edge of its capacity, but rather to have room to move before customers need it. Vitess gives us native sharding, query routing, online schema change capabilities, connection pooling, and resharding primitives built for this kind of workload. Instead of application code carrying all of the sharding complexity, the database layer can do more of the work. That reduces cognitive load for engineers and removes whole classes of operational risk.
Ultimately, this gives us practical scaling options instead of hard architectural rewrites, and lets us do routine database improvement without planned customer-impacting maintenance windows.
Search is not a hidden bottleneck for us. Search underpins core product surfaces across the platform — from vector search in our AI features to realtime reporting — and if it’s slow or unhealthy, customers feel it. Scaling isn’t just adding more machines; often the better approach is making the product do less unnecessary work. Today, our Elasticsearch clusters support a much higher-throughput product than in the past, with more than 650TB of storage, more than 1.7 trillion documents, and peaks above 40,000 requests per second. We’re serving a larger product surface more efficiently, not just running a bigger cluster.
More importantly, when an index gets too large or traffic distribution turns unhealthy, we don’t want a high-risk, manual migration. We reshape Elasticsearch indexes online by partitioning by customer ID, dual-writing to old and new indexes, backfilling, validating, gradually moving customers with feature flags, and deleting the old index only when we’re confident. We’ve used this pattern for years to make large search migrations safer and more incremental — a core playbook in our platform scalability and SRE practices.
Fairness is non-negotiable in a multi-tenant system. A single customer’s high-volume moment should not quietly become everyone else’s latency problem. We design for this at multiple layers. For asynchronous work, we use overflow queues and queueing strategies that prevent one high-volume workload from consuming shared capacity in a way that hurts quieter tenants. AWS SQS fair queues are one example of a primitive we use extensively. They’re designed for exactly this class of problem. When one tenant creates a backlog in a shared queue, fair queues help reduce the dwell-time impact on other tenants.
We also build application-level guardrails so customer isolation doesn’t depend on every engineer remembering every rule in every code path. In a large multi-tenant Rails application, the safe path must be built into the system. The focus is primarily about correctness and customer data separation, but the broader operating principle is the same: important customer boundaries should be enforced by infrastructure and application frameworks.
The same thinking applies to scale. We want customer-specific load to be visible, attributable, and controlled. When a customer spike happens, we should be able to understand it as that customer’s workload, protect the rest of the platform, and add capacity where it’s actually needed.
Fin adds a new dimension to scaling. Our AI Agent Fin introduces a new set of infrastructure challenges. To provide reliable AI-powered support at scale, we need to operate across multiple model providers, route across them based on capacity and latency, and protect customer-facing workloads from lower-priority work. The details differ from traditional SaaS infrastructure, but the principle is the same: understand the bottlenecks, build clear scaling levers, and monitor the customer outcome. AI providers are not commodity storage systems, and we do not design as if they are.
That is why we have invested in Fin-specific reliability systems. Fin now fully resolves over two million conversations per week. At that scale, high availability cannot depend on a single model, a single provider, a single region, or a single pool of capacity. Our LLM routing layer supports cross-vendor failover, cross-model failover, latency-based routing, capacity isolation, and load testing. We also maintain buffer capacity with major providers, with headroom to handle 2x to 3x normal Fin traffic at any point. For enterprise customers, this matters because AI support volume can spike just like human support volume — and the AI layer must absorb that spike without relying on one fragile upstream path.
When customers depend on Fin to absorb a spike in support demand, the AI layer needs the same operational discipline as the rest of the platform.
Performance tests help, but production traffic is reality. Real customers use products in ways no synthetic test will perfectly predict: launches, incidents, seasonal patterns, gaming events, sudden changes in end-user behavior. Those moments give us data that no lab can fully reproduce. Often, a large customer event barely moves the platform-wide graphs because our customer base is broad enough that one industry’s peak aligns with another’s quiet period. Black Friday and Cyber Monday are good examples. Many ecommerce customers are at their busiest, while many B2B SaaS customers are quieter. At the aggregate platform level, the change can be much less dramatic than people expect.
“That does not mean those events are unimportant. It means we need to look at both levels: the health of the overall platform and the experience of the individual customer having the spike.”
Sometimes, these events teach us something specific. In one case, a very large customer used the Messenger in a way that exercised the full Messenger lifecycle even though the visible user experience did not require it. Under normal traffic, this was fine. During a major customer-side incident, their users refreshed aggressively, generating a much larger burst of Messenger traffic than the integration actually needed. The platform stayed available, but the event exposed unnecessary work in that integration path. We built a lighter-weight integration path that served the customer’s actual use case with far less work per request, making future spikes easier to absorb.
We treat large customer events this way even when there’s no broad customer impact. They’re opportunities to understand real scaling properties and make the next event safer — a habit that anchors our incident management, observability, and FinOps practices.
Scale is also an operating model. The infrastructure matters, but it’s not enough. You can have the right database architecture and still hurt customers if you detect issues late, recover slowly, communicate poorly, or fail to learn from incidents.
“That is why our operating model starts with customer outcomes. If the customer cannot do the job they came to do, the system is unhealthy. It does not matter how many dashboards are green.”
Heartbeat metrics tell us whether customers can do the core jobs they hire us to do. They cut through infrastructure noise and answer the question that matters most during an incident: are customers able to use the product successfully?
This shapes how we ship. Today, we average around 250 ships to production per workday, with an average merge-to-production time under 10 minutes. That isn’t a vanity metric — it’s part of the safety model. Smaller changes are easier to understand, easier to observe, and easier to roll back. Feature flags let us separate deployment from release. Automatic rollback and heartbeat-driven detection help us recover quickly when a change hurts customers. These are the very DORA metrics we hold ourselves to in order to balance CI/CD speed with stability.
“Fast shipping is not the opposite of reliability. Done properly, it is one of the ways you stay in control of change.”
The bar is high. Engineers are expected to understand the impact of their changes, watch them go live, and act quickly if something looks wrong. Resuming service is not the end of an incident. We expect teams to understand the root cause, fix the contributing systems, and prevent recurrence. That’s how scale stays safe over time.
Scheduled maintenance should be extraordinary. Historically, database maintenance was a main reason for maintenance windows: upgrading a database, changing instance sizes, performing failovers, or moving large tables could require customer-impacting downtime. With the move to Vitess and PlanetScale, we changed what routine database improvement looks like. We can upgrade, scale, and improve critical database infrastructure without turning that work into planned customer-impacting downtime — and we do this in practice, not just as a goal.
This matters because customers rely on our platform for live operations. If their support team, Messenger, Help Desk, or AI Agent is unavailable, the impact is immediate. Scheduled maintenance cannot be treated as a casual operational convenience.
“Our posture is simple: routine infrastructure improvement should not require planned customer-impacting downtime.”
Scheduled maintenance should be exceptional, non-routine, clearly communicated, and minimized in frequency, duration, and customer impact. That’s the practical benefit of the architecture work: better scaling is not only about handling more traffic, but also reducing the operational moments that might inconvenience customers.
What this means for customers is simple: be skeptical of vague scale claims. The question isn’t whether a vendor says they can scale — it’s whether they can explain how, where the limits are, what they measure, how they recover, and what they’ve changed after learning from production. We understand the scaling properties of our systems, have clear levers to add capacity at the right layers, design for customer isolation and fairness, monitor customer outcomes directly, and use real production events to make the next one safer. Scale is never finished. Every large customer event, traffic spike, migration, and incident teaches us something about the real behavior of the system — and we use that data to keep improving. That’s what you should expect from a platform you depend on during your busiest moments.
Your Amplitude dashboard is populated, but the room still debates whether the numbers are real. Engineering sees successful requests. Product sees unexplained breaks. Each feature adds more events, yet confidence in the data keeps falling.
You do not fix this by collecting more data or polishing the dashboard. You fix it by treating instrumentation as a product interface: designed around a decision, expressed as a clear contract, reviewed with the code, tested against real journeys, and monitored after release.
Design the decision before you name the event
The most common instrumentation failure starts before an engineer writes code. A stakeholder asks to track a page, button, or feature without saying what decision the data must support. The resulting event may be technically valid and still be useless.
Begin with a decision statement: If this behavior differs by this segment or step, I will change this part of the product. That sentence forces you to identify the behavior, comparison, and possible action. If nobody can describe the action, the proposed event is probably speculative inventory rather than decision-grade data.
Suppose you need to decide whether team invitations are blocking activation. A useful behavioral sequence might contain Workspace Created, Invitation Sent, Teammate Joined, and First Shared Action Completed. The important work is not typing those labels. It is defining what each one means.
Does Invitation Sent fire when someone clicks the button, when the request succeeds, or when the message is accepted for delivery?
Does Teammate Joined mean the invite was accepted, the new user signed in, or the user entered the intended workspace?
Can retries emit the same behavior more than once?
Can an existing user join through a path that bypasses the invitation flow?
Which actor owns the event: the inviter, the invitee, the workspace, or some combination?
Those distinctions determine whether the funnel represents the customer journey or merely the user interface. A click is evidence of intent. A confirmed state change is evidence of completion. Track both only when you have a real use for both, and do not give them names that imply the same meaning.
Use events for behaviors that happened and properties for the context needed to interpret them. If email and link invitations represent the same business action, use one Invitation Sent event with an invitation channel property. Split them into separate events only when their meanings, lifecycles, or downstream decisions genuinely differ.
Before approving an event, require answers to five questions: Who will use it? What decision will it change? What exact condition emits it? What else could produce the same signal? What will you do if the result moves? This keeps the tracking plan small enough to govern and precise enough to trust.
Turn the tracking plan into an executable contract
A tracking spreadsheet is not a contract if the implementation can drift from it unnoticed. The definition must be specific enough for an engineer to implement, a reviewer to challenge, and an automated check to validate.
Data quality has several independent layers. Structural validity asks whether the payload follows the expected schema. Semantic validity asks whether the event means what its name claims. Coverage asks whether every intended surface and journey emits it. Identity integrity asks whether behavior is attached to the right user, account, or workspace. Passing one layer does not prove the others.
An event can therefore be perfectly formatted and analytically false. Invitation Sent with a valid channel property still misleads you if it fires before the backend confirms success. This is why human-readable names and strict schema validation are necessary controls, but not the whole quality system.
Contract field
What to specify
Failure it prevents
Decision and metric
The product question, downstream measure, and action the signal can change
Events collected without a defined use
Canonical event
One stable, human-readable name and any forbidden aliases
Several names for the same behavior
Trigger and completion boundary
The exact state transition, success condition, and behavior on failure or retry
Clicks or attempts being counted as completed outcomes
Emitter and source of truth
The client, server, worker, or other component responsible for emission
Double counting when multiple layers report the same action
Actor and entity
The user, account, workspace, or object to which the behavior belongs
Metrics grouped around the wrong unit of analysis
Required properties
Names, types, allowed values, null rules, and derivation logic
Broken segments and silent type drift
Identity behavior
Expected handling before sign-up, after login, after logout, and during account changes
Split histories, merged users, and misplaced account activity
Environment and release context
How production, test data, application versions, and relevant platforms are distinguished
Test traffic contaminating decisions or regressions being hidden in aggregates
Owner and lifecycle
The accountable team, review status, downstream consumers, and deprecation path
Orphaned events that nobody can safely change or remove
QA evidence
The automated assertion, tested journey, sample payload, and production verification
Approval based only on code inspection
Property rules deserve the same precision as event rules. Decide whether an absent value means unavailable, not applicable, or an instrumentation defect. Keep types stable. Define bounded values where the business vocabulary is bounded. Avoid using display copy as an analytical value because a harmless wording change can fragment the data.
Treat a property type change, trigger change, or identity change as a breaking contract change. Adding a new optional property is usually less disruptive than changing what an existing field means. When meaning must change, introduce an explicit migration plan and identify which historical comparisons will no longer be valid.
Identity needs its own test plan. Exercise an anonymous visit followed by registration, a returning-user login, logout on a shared device, switching between workspaces, and any cross-device journey you intend to analyze. Verify the resulting user and account histories instead of assuming the SDK calls produce the business behavior you want.
Apply data minimization at the contract boundary. Every property should have a decision use, an owner, and an acceptable data classification. Do not collect free-form or sensitive values merely because they might become useful later. Preventing unnecessary capture is safer than trying to contain it after it has entered the analytics pipeline.
Make the pull request your instrumentation quality gate
Developer-first instrumentation does not mean product hands analytics to engineering and walks away. It means the analytics contract follows the same change-management path as the behavior it describes. The code, definition, tests, and review evidence move together.
Start in a feature branch. Run the setup workflow there so configuration and instrumentation changes are visible before they reach the main branch.
Update the analytics contract in the same pull request as the feature. A behavior change without its contract delta is incomplete; a contract change without its implementation is unverifiable.
Review the emission boundary. Confirm that the event fires on the intended success condition, has one authoritative emitter, handles retries deliberately, and does not fire on rendering unless rendering is the behavior you mean to measure.
Run structural checks in CI/CD. Validate canonical names, required properties, types, permitted values, environment configuration, and forbidden fields. Fail the build when a known contract is violated.
Run behavioral tests around the analytics client. Exercise success, failure, cancellation, and retry paths, then assert which events should and should not be emitted. A negative assertion is often what catches inflated success metrics.
Verify the journey in a non-production environment. Capture the observed sequence and payload, then compare them with the contract. Keep this traffic distinguishable from production behavior.
Define the production check before merging. Name the owner, expected signal, dimensions to inspect, downstream chart or cohort affected, and response if the data does not match the release.
Automated checks are strongest at detecting known structural failures. They can prove that a required field exists; they cannot decide whether the field represents the right business concept. Keep a lightweight semantic review in the pull request. Engineering should own trigger and runtime correctness. The product or analytics owner should own meaning and downstream use. Bring in privacy or security review when the identity model or captured data changes.
The reviewer should be able to reconstruct the analytical meaning without reading every implementation detail. Include the decision statement, contract change, sample payload, tested journey, and affected measures in the pull request. That context preserves intent when the original team has moved on and makes later taxonomy changes auditable.
Do not turn the gate into an analytics committee. Most changes need a clear owner and one qualified reviewer, not a meeting. Escalate when a change redefines a shared event, alters identity, introduces sensitive data, or breaks historical comparability. Routine additions that conform to the contract should remain routine.
Prove production data is decision-grade, then keep proving it
A successful deployment proves that code reached production. It does not prove that actual customers, application versions, queues, retries, and identity transitions produce trustworthy analysis. The final quality gate operates on observed production behavior.
Inspect new or changed instrumentation by release, platform, environment, emitter, and relevant customer segment before relying on an aggregate. Aggregates can hide a missing platform, a version-specific regression, or duplicate client and server events.
Presence: Did the intended event appear after the release, and is an unexpected absence explained by traffic or by a defect?
Completeness: What share of observed events contains each required property, and where are missing values concentrated?
Conformance: Did new property values or types appear outside the agreed contract?
Uniqueness: Do retries, page transitions, or multiple emitters create suspicious duplicate patterns?
Sequence sanity: Can a completion event occur without the prerequisite behavior, and is that a legitimate alternate path?
Identity continuity: Do anonymous, authenticated, user, and account histories connect in the journeys that matter?
Comparability: Did the release change the meaning or population of an existing metric even though its name stayed the same?
Set alert and acceptance thresholds from expected traffic, historical behavior, and the cost of a wrong decision. A universal percentage would create false precision. An event used for an executive activation metric deserves a tighter response than a diagnostic event used occasionally by one feature team.
Give every important event a visible trust state. Proposed means the contract exists but the code does not. Instrumented means the code is deployed. Observed means production data has arrived and basic checks passed. Trusted means the owner has verified the real journey and approved downstream use. Deprecated means new analysis should stop depending on it. This vocabulary prevents a dashboard builder from treating mere event presence as approval.
When production data is wrong, treat it like a data incident. Record the affected event, properties, segments, and time window. Identify the dashboards, experiments, and decisions that consume it. Stop or correct the bad emission. Backfill only when the intended values can be reconstructed deterministically from reliable records; otherwise, preserve the gap and mark the period as non-comparable. A plausible-looking repair is more dangerous than an explicit hole because it hides uncertainty.
Add the failure mode to the contract test after the repair. If a retry caused duplicates, add a retry case. If one platform omitted a property, cover that platform. If identity changed during a workspace switch, turn that journey into a regression test. The incident should leave the instrumentation system harder to break in the same way.
Govern by change triggers rather than recurring ceremony. Review instrumentation when a team launches a new journey, moves an event between client and server, changes identity behavior, modifies a shared taxonomy, adds a platform, or sees unexplained production drift. This focuses attention where meaning can change.
Start every event with a decision, observable behavior, and named owner. If the possible action is unknown, do not collect the event by default.
Define trigger, emitter, actor, properties, identity behavior, environment handling, and QA evidence as one versioned contract.
Ship the contract, implementation, automated checks, and journey evidence in the same pull request.
Separate structural validation from semantic review. A valid payload can still represent the wrong behavior.
Promote events from instrumented to trusted only after production verification, and mark damaged periods instead of silently presenting them as comparable.
Use the next feature as the boundary for change. Pick one consequential customer journey, write its contract, put the instrumentation through the pull request, and verify it after release. Do not wait for a company-wide taxonomy rewrite. One fully governed journey will expose the missing standards and give you a working pattern for the next one.
If your team cannot show the contract, test evidence, production check, and current trust state behind a metric, do not use that metric for a roadmap or growth decision yet. Label the uncertainty, repair the signal, and make trust part of the definition of done.
You are not deciding whether an AI model can find bugs in a pull request. You are deciding whether an automated reviewer can participate in a production control without leaving your team unable to explain, challenge, or reverse its decision.
If the only evidence behind an approval is a bot comment that says the change looks safe, keep the system advisory. An auditable AI reviewer needs a bounded mandate, a deterministic approval policy, traceable evidence, and a feedback loop tied to production outcomes. Build those controls first, and faster review becomes a consequence rather than a gamble.
Start with a decision contract, not a model prompt
An approval is a policy decision. The model can supply findings, evidence, and a recommendation, but it should not define the conditions under which its own recommendation becomes authoritative.
Write a decision contract before selecting a model or tuning a prompt. It should answer five questions:
What may the system decide? Typical outcomes are approve, request changes, provide non-blocking comments, or escalate to a person.
Which changes are eligible? Eligibility should be determined by explicit repository, path, change-type, test, ownership, and reversibility rules.
Which checks are mandatory? An eligible pull request should not be approved if a required review lens failed to run, returned incomplete evidence, or produced an unresolved blocking finding.
When must the system abstain? Missing context, conflicting findings, unavailable tools, excessive scope, low-confidence evidence, and protected code paths should cause escalation rather than optimistic approval.
Who owns the result? Name the engineer accountable for the change, the owner of the review policy, and the person or group authorized to change the automation boundary.
The core approval rule can be expressed plainly: the change is eligible, every mandatory check completed, no blocking issue remains, the evidence record is complete, and no human-review requirement was triggered. Encode that rule in a controller your team can inspect and test. Do not bury it inside natural-language instructions to the model.
This separation gives you a clean control plane. Review agents analyze the change. A policy engine evaluates their structured results. A narrowly permissioned service performs the approved action. The model never gets to reinterpret the boundary at the moment it encounters a difficult pull request.
Auditability does not require a future model run to reproduce the same words. Model endpoints, retrieved context, and dependencies can change. It requires the original decision to remain reconstructable from preserved inputs, outputs, policies, tool results, and versions. A skeptical engineer should be able to determine why the pull request was approved without trusting the personality or reputation of the bot.
Split the review into specialist checks with explicit evidence
A single prompt asking whether a pull request is safe compresses several different judgments into one opaque answer. Decompose the review so that each judgment has a clear purpose, input set, output schema, and failure mode.
A practical review pipeline can include these specialist lenses:
Problem-definition quality: Is the requested behavior specific enough to review, and are the acceptance conditions testable?
Intent alignment: Does the diff implement the stated change without silently expanding or contradicting it?
Scope and dependency impact: Which callers, data flows, interfaces, jobs, or services can the change affect outside the edited files?
Logical correctness: Do the changed execution paths handle expected states, boundary conditions, and failure paths?
Test adequacy: Do the tests exercise the behavior that changed, and did the required checks actually run against the reviewed commit?
Security and privacy: Does the change alter trust boundaries, permissions, authentication, secrets, sensitive data handling, or externally controlled inputs?
Local engineering guidance: Does the implementation comply with versioned repository conventions, architectural constraints, and known anti-patterns?
Deployment and recovery: Can the change be observed, disabled, or rolled back without creating a second unsafe operation?
Every specialist should return the same minimum structure: a check identifier, pass/fail/escalate status, a concise claim, evidence tied to files or tool output, the applicable rule version, severity, and a recommended action. A finding such as a possible regression is not auditable. A finding that identifies the affected path, explains the conflicting behavior, points to the relevant code, and names the violated policy is.
Run independent checks before aggregation, and preserve every result even when the final decision is approval. The aggregator may deduplicate findings, but it should not erase dissent. If the intent checker says the change is aligned while the execution-path checker finds a contradiction, route the conflict to a person.
Review context must extend beyond the visible diff. A seemingly harmless one-line copy change was once found to contradict validation behavior elsewhere in the codebase. That is the kind of defect a diff-only reviewer is structurally unlikely to see. Give relevant checks controlled access to callers, validators, schemas, tests, ownership metadata, and versioned internal guidance, then record exactly which context each check used.
More context is not automatically better. Retrieval should be targeted and attributable. When a finding depends on an internal rule, capture the rule identifier and version. When it depends on a test, capture the command, commit, status, and output reference. When it depends on inferred execution flow, record the relevant path so a maintainer can inspect it.
Treat pull-request text, code comments, test fixtures, generated files, and documentation on the changed branch as untrusted data. They can contain instructions designed to redirect an agent. Load approval policy from a protected service or the trusted base branch, not from files the pull request can rewrite. Run proposed code in an isolated environment, mediate tool calls through an allowlist, and keep approval or merge credentials outside the model’s reach. The policy controller should translate a valid decision into an action; the model should never hold the credential that performs it.
Set the automation boundary with hard eligibility gates
Do not begin by assigning every pull request a risk score and approving anything below a convenient number. A composite score can hide a disqualifying condition: a tiny authorization change may receive a low size score even though its blast radius is high. Apply hard gates first. Use scoring only to route changes that remain eligible after those gates.
Common reasons to require human review include:
Authentication, authorization, permissions, cryptography, secrets, or trust-boundary changes.
Payments, billing, entitlements, destructive data operations, or irreversible migrations.
Public API contracts, shared schemas, release infrastructure, or broadly consumed dependencies.
A pull request that changes its own review policy, test requirements, ownership rules, or deployment controls.
Missing required tests, failed or stale CI results, unavailable analysis tools, or a mismatch between the reviewed commit and the tested commit.
Changes spanning too many concerns, components, or execution paths for the approved review envelope.
An active incident, an unclear rollback path, or a direct request for human review.
There is no universal line-count threshold for a small pull request. Derive limits from your architecture and incident history, then version them. A change to a central permission function may be riskier than a much larger isolated test refactor. Scope should include dependency reach and behavior change, not just added and deleted lines.
A staged authority model keeps the boundary legible:
Mode
What the AI reviewer may do
Who decides the merge
Appropriate use
Shadow
Produce a private decision record without affecting the pull request
Human reviewer
Baseline evaluation and policy tuning
Advisory
Post evidence-backed, non-blocking findings
Human reviewer
Measuring usefulness and false alarms in normal work
Blocking
Request changes for narrow, testable policy violations
Human reviewer after resolution
Stable rules with clear evidence and an appeal path
Bounded approval
Approve only changes that pass every eligibility and review condition
Policy controller within its delegated scope
Validated low-risk change classes with complete audit records
Mandatory escalation
Summarize evidence and route the change
Named human owner
Sensitive paths, conflicting findings, missing evidence, or any requested human review
Do not turn bounded approval into an auto-approval quota. Coverage is a result of demonstrated safety, not a target that should pressure teams to weaken eligibility rules.
One high-frequency engineering environment reports that more than 93% of pull requests across two main codebases are agent-driven and more than 19% are approved without a human reviewer. Its reported median merge time fell from 75.8 minutes with human review to 14.6 minutes with AI approval, while downtime from breaking changes declined 35% as deployments doubled. Those organization-level results show that bounded automation can coexist with high deployment frequency and improving safety outcomes. They do not prove that AI approval caused the downtime reduction, and they should not be imported as another team’s launch threshold.
Keep the escape hatch explicit. Any engineer should be able to request a human review without defending the choice. The accountable engineer should still watch the change in production and be ready to roll it back. Automated approval changes who performs a review step; it does not transfer ownership of the production outcome to a model.
Preserve the evidence, then earn autonomy through evaluation
Build a decision record that survives model and policy changes
Create an append-only decision event for every review attempt, including abstentions and failed runs. At minimum, retain:
Repository, pull-request identifier, base commit, reviewed head commit, author, accountable owner, and timestamps.
The pull-request description and acceptance criteria as they existed when the decision was made.
Model provider and model identifier, relevant runtime settings, retrieval configuration, and tool versions.
The context each specialist received, including immutable references or preserved snapshots for mutable material.
Structured specialist outputs, supporting evidence, tool invocations, CI results, conflicts, and failures.
The deterministic rule evaluation that produced approve, block, comment, or escalate.
Subsequent human overrides, appeals, edits, approvals, merges, rollbacks, hotfixes, and linked incidents.
Store concise decision rationale and inspectable evidence, not hidden chain-of-thought. An auditor needs to know which claim was made, what supported it, which rule applied, and how the controller reached the outcome. Private internal reasoning is neither necessary nor a reliable substitute for those artifacts.
Apply the same security discipline to review logs that you apply to source code. Minimize captured secrets and personal data, control access, define retention, and log policy changes. If a model or retrieval service cannot handle the code under your data-governance requirements, that repository is not eligible for the workflow.
Evaluate decisions, not polished comments
A review can sound thoughtful and still approve the wrong change. Build an evaluation set around decisions and evidence rather than writing quality.
Assemble representative cases. Include clean pull requests, valuable historical human findings, escaped defects, incident-causing changes, incomplete requirements, sensitive paths, cross-component changes, and attempts to manipulate the reviewer through repository content.
Label the expected control outcome. For each case, identify whether the correct action is approve, request changes, or escalate. Record the evidence that an acceptable review must surface.
Separate clear cases from disputed ones. Known incident causes and explicit policy violations can provide strong labels. Ambiguous architectural judgments need maintainer adjudication, and disagreement should remain visible rather than being forced into false certainty.
Freeze a holdout set. Use one portion to improve prompts, retrieval, and policy. Keep another portion unseen until release evaluation so repeated tuning does not create a misleading score.
Compare equivalent cohorts. Evaluate AI and human review on the same risk classes and change types. Comparing AI-approved low-risk changes with all human-reviewed pull requests confounds reviewer quality with task difficulty.
Track metrics that expose different failure modes:
Decision accuracy: How often did the system choose the expected approve, block, or escalate outcome?
False auto-approval rate: How often did it approve a labeled case that should have been blocked or escalated? Break this out by severity and risk class.
Blocking precision: Of the findings that stopped a change, how many maintainers judged valid and actionable?
Known-defect recall: Which seeded or historically verified defects did the review catch? Label this carefully; it is not recall over every defect that might exist.
Evidence completeness: Can every decision be traced to required checks, immutable inputs, policy versions, and supporting artifacts?
Abstention and override rates: Where is the system uncertain, and where do engineers reverse it? Investigate patterns by repository and change class.
Delivery performance: Measure review latency and merge time, but only alongside quality metrics.
Production outcomes: Track rollbacks, hotfixes, escaped defects, incidents, downtime, and customer impact for comparable risk cohorts.
Comment helpfulness is useful feedback, but it is not a safety metric. Engineers may like a concise reviewer that misses a critical defect, or dislike a strict reviewer that correctly blocks an unsafe change. Keep usefulness, correctness, and production impact as separate measures.
Roll out by change class and turn escapes into regression tests
Move from shadow mode to advisory comments, then to narrow blocking rules, and only then to bounded approval. Start with one repository and one low-risk, reversible change class. Write the exit criteria before the pilot begins, including acceptable false-approval and false-block rates, required audit completeness, escalation behavior, and production guardrails.
Canary each expansion. Maintain a kill switch that disables new automated approvals without removing the accumulated evidence. If a required service, model, retrieval index, test runner, or policy store is unavailable, fail closed and return the pull request to the human path.
When an approved change causes a production problem, diagnose the control layer that failed:
Was the change wrongly eligible?
Did retrieval omit relevant code or guidance?
Did a specialist miss or misclassify the defect?
Did the aggregator suppress a conflict?
Did the policy permit approval despite the evidence?
Did CI test a different commit or an incomplete environment?
Did production monitoring fail to surface the effect promptly?
Add the case to the regression suite, version the corrective policy or guidance, rerun the holdout evaluation, and preserve the relationship between the incident and the updated control. That is eval-driven development applied to governance: every escape should make a specific layer harder to fail in the same way again.
Key takeaways
AI output is an input to approval, not the approval policy itself.
Use deterministic eligibility gates before any model-based risk judgment.
Decompose review into specialist checks that return claims, evidence, rule versions, and explicit pass/fail/escalate states.
Keep policy and credentials outside the pull request and outside the model’s control.
Preserve enough evidence to reconstruct the original decision even when the model, repository, or internal guidance later changes.
Expand autonomy only when evaluation and comparable production cohorts support it; never optimize for auto-approval coverage by itself.
Your first useful milestone is not an AI-approved pull request. It is a shadow decision that a maintainer can reconstruct, dispute, and improve. Once that record is dependable, grant the smallest reversible slice of authority, watch what reaches production, and make every expansion earn its place.
PR review bots are all the rage, but they cost a premium. We built our own for cheap that work just as well, if not better. Here's how.
As a VP of Product Management, I care deeply about the velocity and quality of our software delivery. The decision to build our own pull request (PR) review agents came from a simple calculus: we needed tighter control over developer experience, CI/CD integration, and cost—without sacrificing accuracy or reliability. The result was a pragmatic system that accelerates reviews, improves code quality, and pays for itself through faster feedback loops.
Before we wrote a line of code, we defined success. Our objectives were to shorten review cycles, reduce back-and-forth on style and test coverage, and surface risks earlier—measured against DORA metrics like lead time and deployment frequency. That focus aligned the team, guided our build vs buy decision, and anchored scope to the highest-impact use cases.
We started rules-first, AI-optional. The initial release enforced guardrails that are universally valuable: linting and formatting checks, required test coverage thresholds, commit message standards, ownership validation (CODEOWNERS), and basic security scans. These automated gates eliminated predictable review friction, freeing engineers to focus on logic and architecture rather than style debates.
Then we layered intelligence where it mattered. We added lightweight, explainable checks for common code smells and dependency risks, plus optional natural-language summaries that turn large diffs into concise context. Where appropriate, we introduced agentic AI workflows to triage PRs by risk, draft review comments, and suggest missing tests—always keeping humans in the loop. This hybrid approach kept costs low and outcomes high.
Integration with our CI/CD pipeline was non-negotiable. We wired GitHub/GitLab webhooks to a stateless service that queued work, executed checks in containerized workers, and posted results back as status checks and review comments. Caching, parallelization, and smart diff-scoping ensured we only computed what changed, keeping the experience snappy even on large repos.
Adoption hinged on developer experience. We made the bot’s feedback fast, specific, and actionable, with clear remediation steps and links to documentation. Feature flags allowed teams to opt into new checks gradually. ChatOps commands enabled quick overrides for emergencies, while policy-as-code kept rules visible, versioned, and auditable.
We treated this like any product: eval-driven development for accuracy, ongoing telemetry for false-positive rates, and explicit SLAs for response times. We instrumented outcomes end-to-end—tracking PR cycle time, comment-to-merge ratios, and rework—so we could prove the ROI and tune the system without guesswork.
The outcome: a reliable PR review companion that runs on a shoestring budget, integrates cleanly with our workflows, and measurably improves engineering throughput. If you’re weighing build vs buy, start small with rules that deliver immediate value, then layer intelligence where it earns its keep. With a clear product strategy, you can stand up capable PR review bots quickly—and scale them as your needs grow.
If you’re ready to try this yourself, begin with your top three friction points in code reviews, wire them into your CI/CD checks, and pilot with a single team. Iterate weekly, measure relentlessly, and let your developers be your strongest signal. You’ll be surprised how far a pragmatic, product-led approach can take you.
Inspired by this post on Amplitude – Perspectives.
Today, I’m excited to share 12 major updates to Fin’s Procedures and Simulations—the foundation that lets Fin handle complex work while keeping teams fully in control of the customer experience.
In my work building AI workflows with product and support leaders, I’ve seen how the right blend of natural language instructions, deterministic controls, and fully agentic behavior turns Fin into a reliable problem solver. Procedures make this blend possible by enabling Fin to act like a human—yet with the repeatability and governance of software. Simulations then let us test those complex Procedures at scale before they reach customers, so we can deploy with confidence.
Together, these capabilities make Fin self-manageable, transparent, and ready for genuinely complex work.
Here’s what’s new at a glance: we’ve made Procedures easier to build and maintain; enhanced deterministic controls for precision and policy compliance; expanded agentic behavior so Fin can adapt in real time; and delivered more powerful Simulations to validate end-to-end workflows before go-live.
Why did we build this? Many teams see early AI gains in speed, coverage, and cost to serve—but then hit a ceiling. They keep AI confined to simple automation and information retrieval, rather than setting it up to handle the nuanced, multi-step workflows they still trust to humans. We designed Procedures and Simulations to remove that ceiling, so teams can confidently set up, govern, and iterate on complex AI workflows without bottlenecks.
Follow the AI lifecycle as it cycles from Analyze to Train to Test to Deploy. This streamlined loop spotlights the TRAIN phase, underscoring faster iteration and feedback that power more capable procedures and realistic simulations.
We also heard that teams needed an easy way to connect data so Fin could reliably check customer status or eligibility and then take action. And they didn’t want to route through engineering every time they needed to create or amend logic for mid-conversation decisions. Procedures combines natural language instructions and intuitive data connector setups. You tell Fin in your own words how you want it to behave, and you’ll be guided through creating conditional steps so Fin will react consistently, with the option to add in any code snippets for circumstances where absolute precision is required. Once you build one Procedure, we believe you’ll want to build several, so Fin will constantly read the conversation it’s in to ensure it’s following the most relevant Procedure, and jump to a more relevant one if the user intent changes.
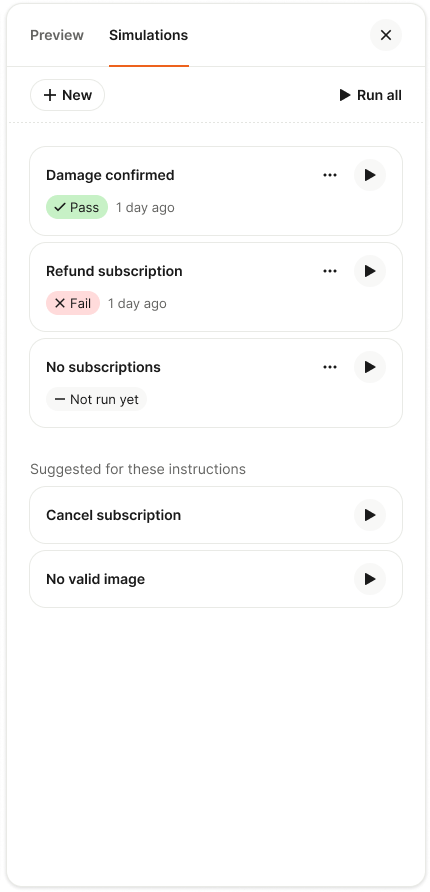
I know that taking something like this live the first time can feel like a leap of faith. That’s exactly why we built Simulations—to test Procedures comprehensively, uncover edge cases, and launch with confidence.
Reaching mature deployment takes a deliberate, ongoing commitment to training workflows, validating them before deployment, measuring performance in production, and refining them over time. At Intercom, we call this the Fin Flywheel: train, test, deploy, analyze. Procedures form the foundation of the train stage, and Simulations make the test stage reliable at scale. Together, they enable Fin to handle complex work, and teams to stay in control of it.
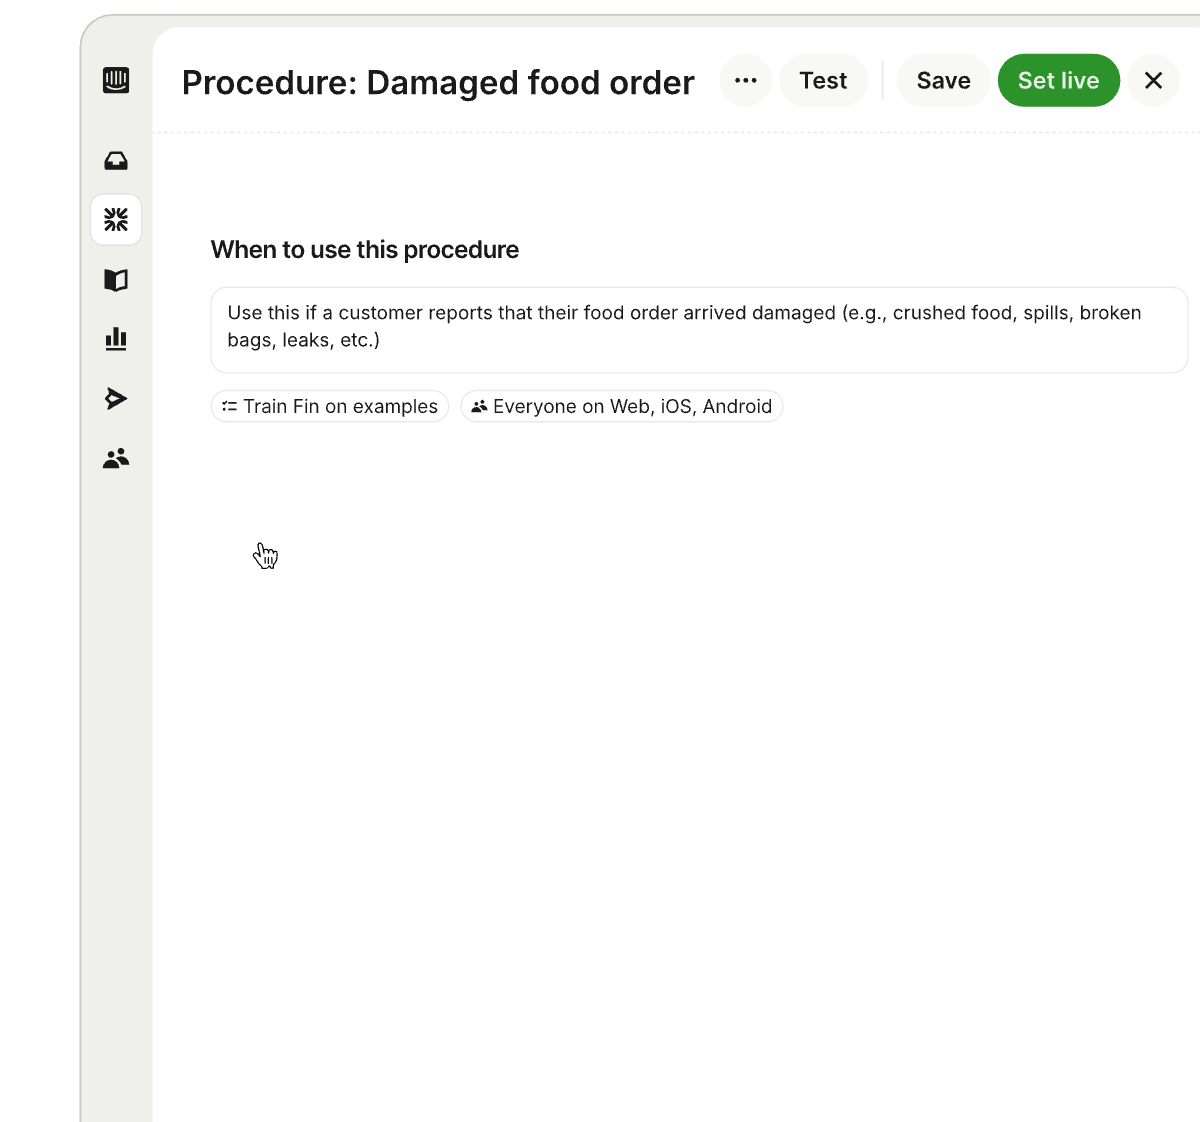
Procedures: Define exactly how Fin handles complex work. With Procedures, I can set Fin up to resolve complex, time-consuming queries that require multiple steps or business logic. Fin follows standard operating procedures and applies sound judgment—just like a seasoned teammate—so even complicated queries are resolved in controllable, predictable ways.
A snapshot of the Procedures builder in action, mapping a clear path for handling damaged food orders while letting teams train Fin on examples, target channels, quickly test updates, and publish with Set live.
Procedures combine three powerful elements. First, natural language instructions. You write a Procedure in plain language, just like documenting a process for a new teammate. You can paste in your existing SOPs, write from scratch, or let AI draft them for you, then iterate yourself.
What’s new: Draft Procedures with AI. Share an outline of your process and Fin drafts a complete Procedure using your conversation history, knowledge hub content, and relevant data. If additional context is needed, it prompts you with clarifying questions to make sure the Procedure is thorough and tailored to your use case, significantly reducing setup time. For example: if you’re creating a refund workflow, the system can draft conditional paths for eligibility, approval thresholds, and verification steps based on your historical cases and policies.
What’s new: Break complex workflows into Sub-procedures. Write a process once and reference it across multiple Procedures by breaking it down into reusable steps, called Sub-procedures. This makes workflows easier to read, faster to build, and simpler to maintain as things change.
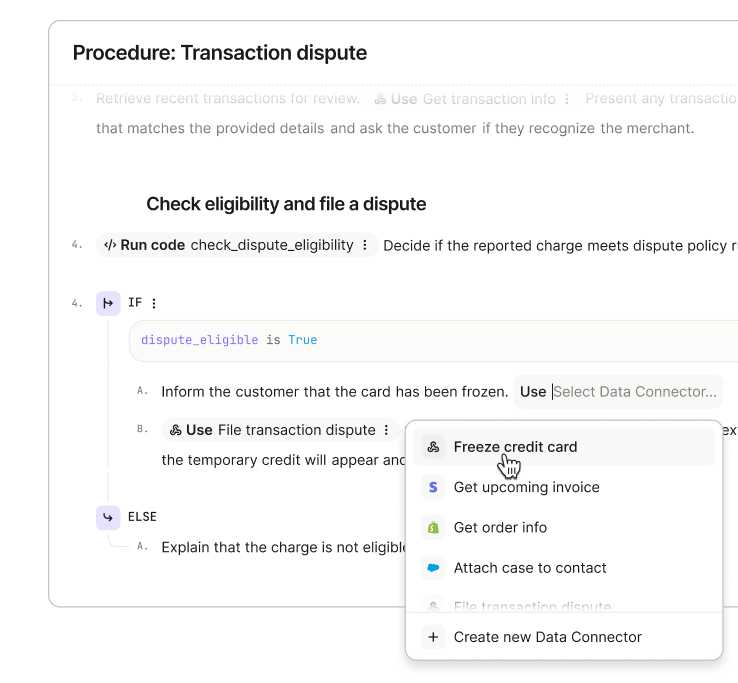
Second, deterministic controls. Natural language is flexible, but some steps need to be exact. You can layer in deterministic controls where precision matters, starting with a fully natural language Procedure and introducing structure gradually where it adds value: conditional steps (branching logic) to handle decision points so Fin’s behavior is consistent and predictable; data connectors so Fin can pull information from your tools or take actions automatically; code snippets for when absolute accuracy is essential; and checkpoints to pause for approval or hand off to a teammate.
Fin demonstrates structured troubleshooting: a transaction dispute flow with eligibility checks, clear IF/ELSE steps, and quick Data Connector actions like freezing a card or pulling invoices, streamlining complex support tasks.
What’s new: Instruct Fin to read specific content from your knowledge hub. You can set clear rules for Fin to reference a specific policy or article from your knowledge hub in defined situations so Fin always surfaces the right context in a conversation.
What’s new: Explicit Procedure switching under defined conditions. You can set rules that deterministically trigger a switch to a different Procedure, for example, escalating to a complaints Procedure if specific risk signals are detected mid-conversation.
What’s new: Internal notes for human handoffs. When Fin hands off to a teammate, it can now include internal notes with relevant context so the person picking up the conversation knows exactly what happened and what needs to happen next.
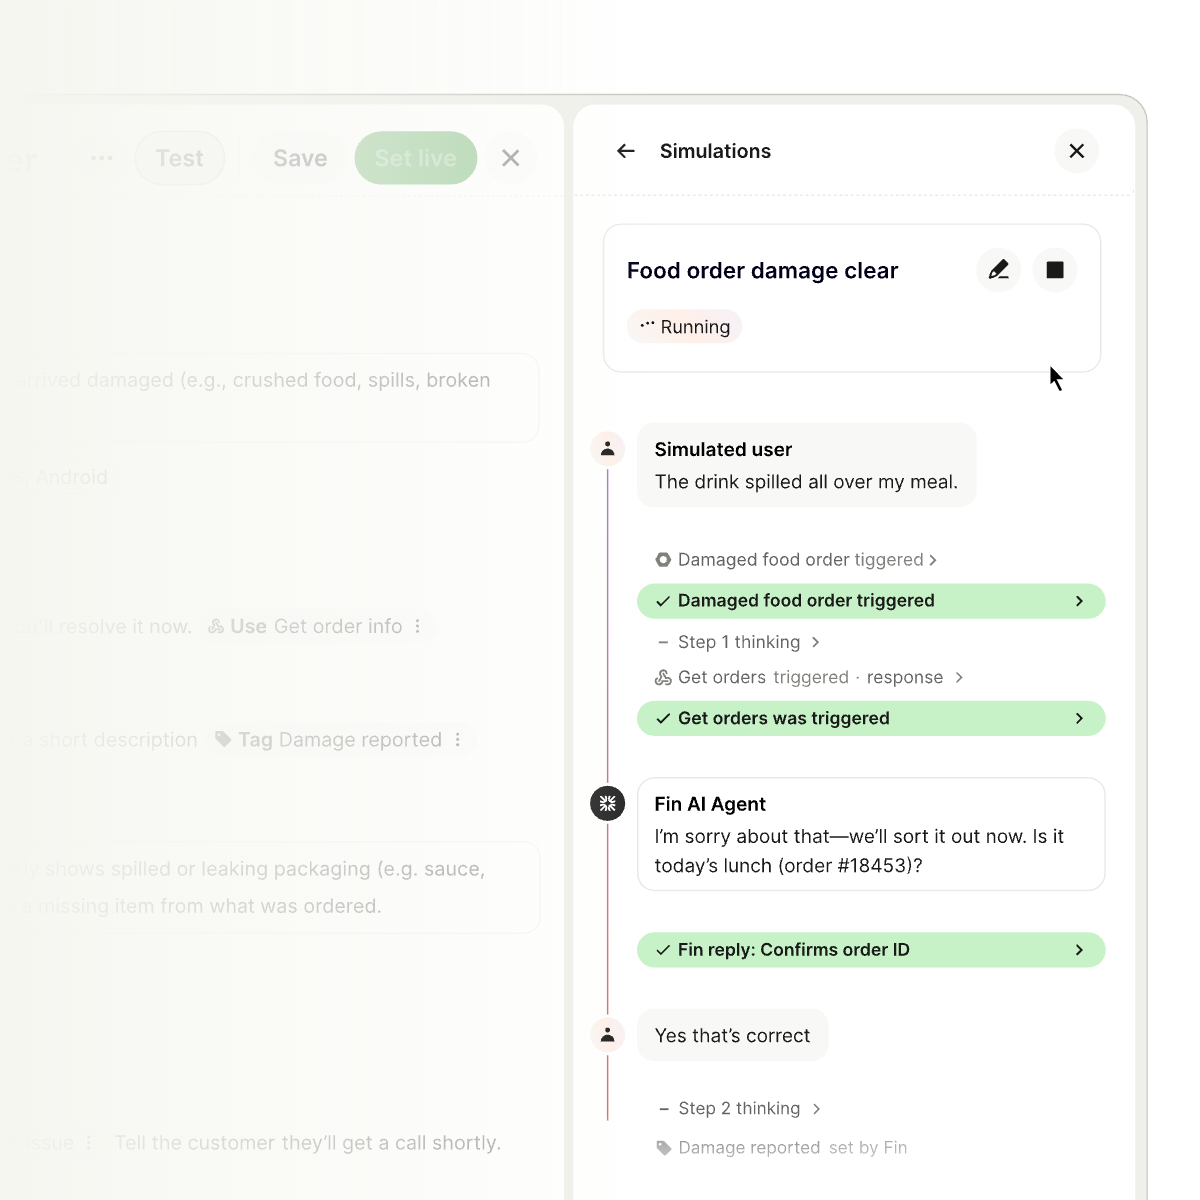
Third, fully agentic behavior. Because real conversations rarely follow the happy path, Procedures let Fin reason through what’s happening and adapt—jumping to the right step or switching Procedures entirely if a customer changes their mind or the issue shifts.
Procedures and Simulations in action: Fin rehearses a food order damage scenario, confirming details and progressing through each trigger. Teams validate complex flows end to end as steps turn green and outcomes are tracked.
What’s new: Automatic Procedure switching. If a customer starts in a billing workflow but then asks about cancelling their subscription, Fin transitions to the relevant Procedure without forcing the customer to restart.
What’s new: Structured data extraction from uploaded files. Fin can now extract structured data directly from PDFs and images uploaded by customers—like invoices, forms, or receipts—and use that data within the conversation. Customers don’t have to copy and paste or repeat themselves.
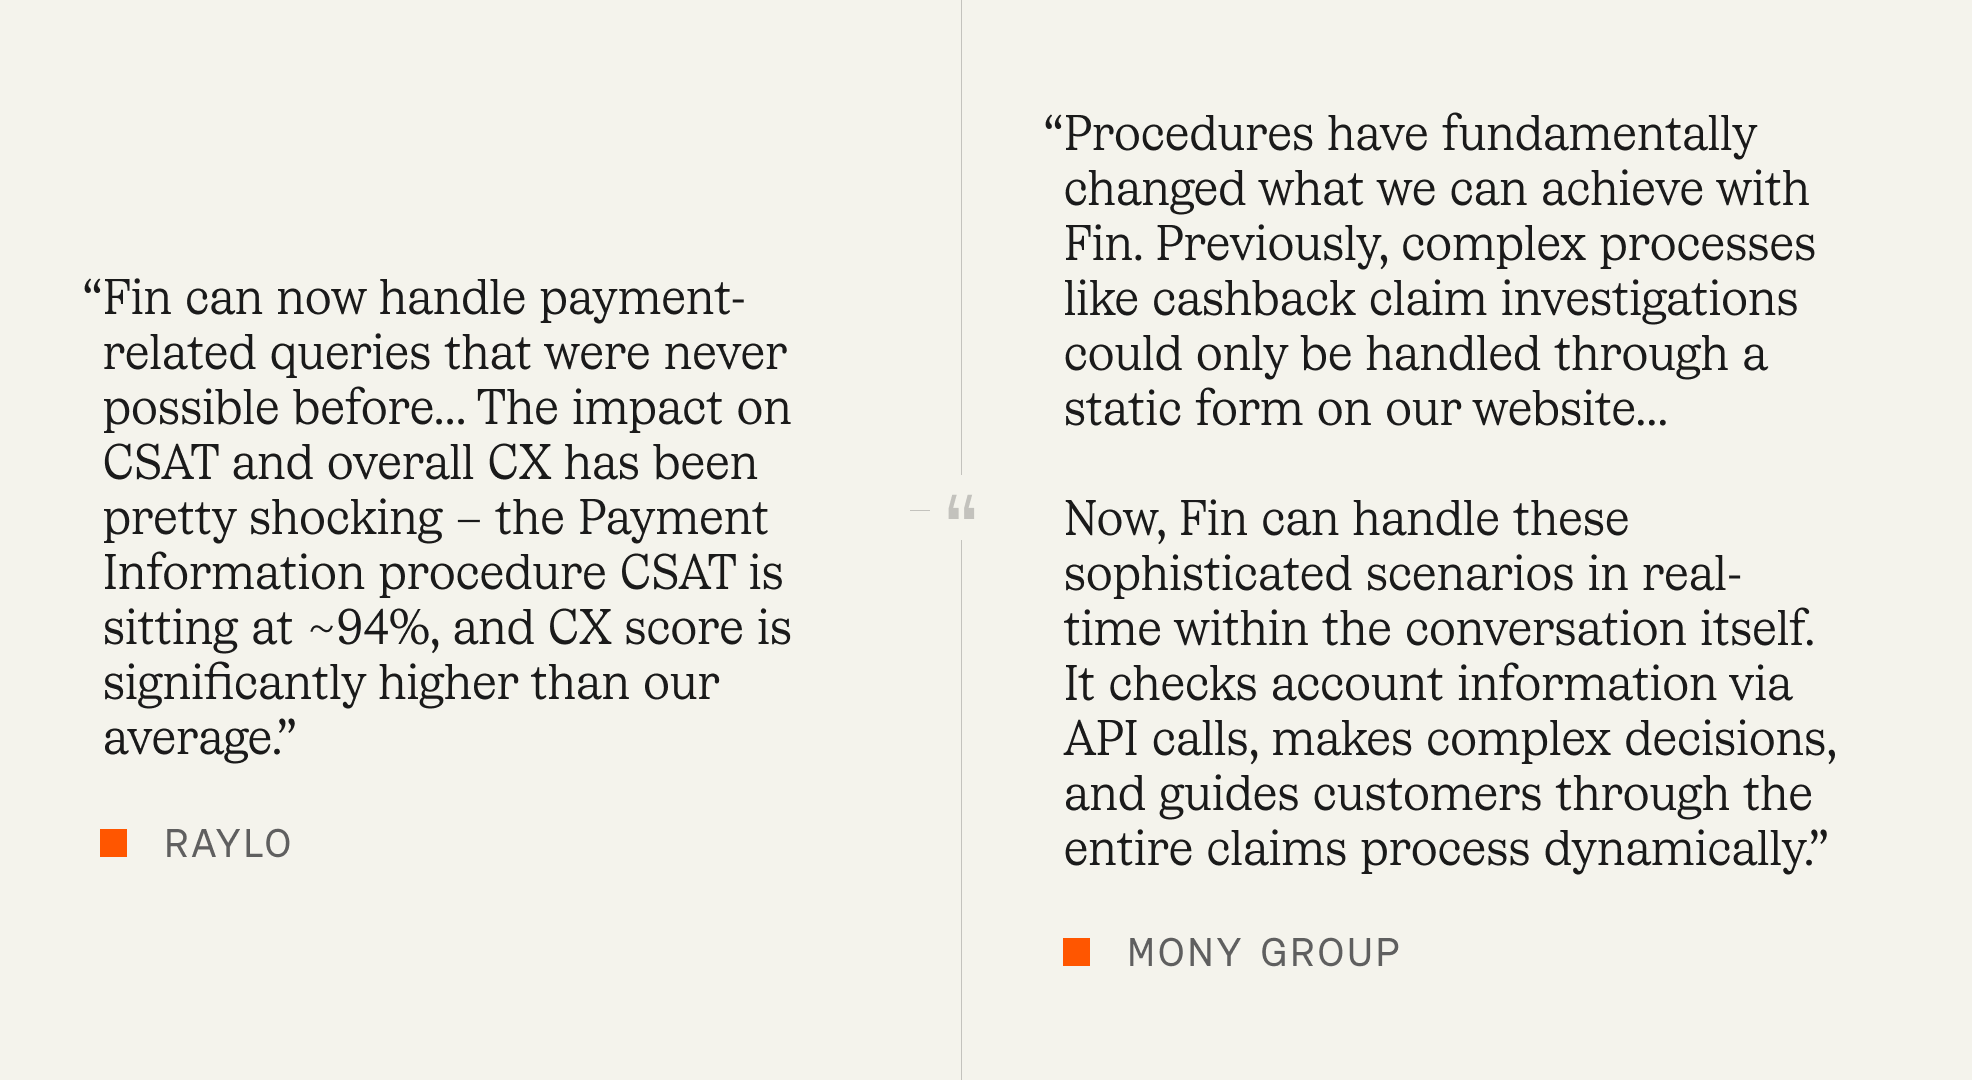
As MONY Group put it:
“ If a customer starts down one path but their issue turns out to be something else entirely, Fin adapts seamlessly – no more getting stuck in loops or forcing customers into the wrong workflow. ”
Simulations help teams rehearse procedures and verify outcomes before going live. Run all tests or launch a new one to ensure Fin handles tricky customer scenarios—from damage confirmation to refunds and missing subscriptions.
The result is a conversation that feels fluid, but always follows your intended rules.
Making complexity easier to manage is just as important as unlocking new capabilities. Beyond the core updates, we’ve focused on creation, governance, and scale—while keeping ownership with your team.
What’s new: Improved instruction authoring. We’ve made it easier to write, edit, and structure Procedures, so building and updating them takes less time and requires less effort.
What’s new: Reporting on when Procedures trigger, resolve, or hand off. You can now track how Procedures are performing directly within the Procedures UI, seeing exactly when they trigger, when they resolve, and when they hand off to a teammate. This visibility helps you spot issues early and improve over time.
Customer stories from Raylo and Mony Group show how Fin now resolves payment issues and complex claims in-chat, checks account data via APIs, and lifts CSAT to about 94%, highlighting the impact of Procedures and Simulations.
Simulations: Test complex workflows at scale before they reach customers. Simulations let you validate how Procedures will perform before anything goes live, and continuously revalidate as things change. Deploying complex AI can feel uncertain; Simulations remove that uncertainty so you can launch with confidence and iterate safely.
You can simulate full conversations. For any Procedure, choose a user or customer segment and run a complete, multi-turn simulated conversation. You see every step Fin takes, how it applies your rules, reasons through decisions, and where it passes or fails—giving you the observability to debug and fix issues before they ever reach customers.
What’s new: Upload images for richer testing. Simulations now support image uploads, so you can test workflows that involve receipts, invoices, or forms—the same inputs your customers actually send.
What’s new: Clearer visibility into Fin’s reasoning. You can now see exactly how Fin is thinking through each step of a Simulation, making it easier to understand behavior, catch unexpected decisions, and refine Procedures with confidence.
You can also use AI to create, store, and rerun tests. Writing test coverage manually doesn’t scale. Fin’s AI Assistant generates Simulations directly from your Procedures, suggesting realistic edge cases like partial refund disputes, missing invoice uploads, or no subscription found, so you can expand coverage without expanding overhead. All the Simulations you create are stored in a central library. When a product changes, a policy updates, or a Procedure is edited, hit “run all” to instantly check whether anything has regressed. This applies the same rigor to AI automation that engineering teams bring to software testing.
What’s new: AI-suggested Simulations. You can now use AI to generate a full set of Simulations from any Procedure. The AI Assistant suggests realistic variations based on your workflow, so you can build comprehensive test coverage fast.
Customers are already seeing this in production. “Fin can now handle payment-related queries that were never possible before… The impact on CSAT and overall CX has been pretty shocking – the Payment Information procedure CSAT is sitting at ~94%, and CX score is significantly higher than our average.” – Raylo
“Procedures have fundamentally changed what we can achieve with Fin. Previously, complex processes like cashback claim investigations could only be handled through a static form on our website… Now, Fin can handle these sophisticated scenarios in real-time within the conversation itself. It checks account information via API calls, makes complex decisions, and guides customers through the entire claims process dynamically.” – MONY Group
Procedures and Simulations are available now. I’m eager to see how teams use these updates to scale agentic AI, deliver faster resolutions, and raise the bar for customer experience—without sacrificing control, compliance, or quality.
Shipping AI agents is not like shipping a typical feature. The system learns, reasons, and takes action in unpredictable environments, and when it’s customer-facing, the stakes are high. Over the past few years, I’ve refined a practical checklist that helps my teams move quickly without breaking trust. It balances speed with safety, and ambition with accountability—exactly what you need to scale agentic AI in production.
This checklist was forged in real launches—some smooth, some humbling. Early on, I watched an otherwise brilliant agent confidently offer a refund policy we didn’t have. That one incident made it clear: AI agents require a higher bar for guardrails, evals, and observability. Today, I won’t greenlight an AI rollout without these steps being explicit, owned, and testable.
Start with outcomes, not output. I define the job-to-be-done, the target users, and the measurable business impact using outcomes vs output OKRs and driver trees. Success is not “ship an agent,” it’s “reduce first-response time by 40% with no drop in CSAT,” or “increase qualified demo bookings by 20% at a lower cost per acquisition.” Clear outcomes give the agent a purpose and the team a north star.
Prepare the knowledge the agent will use. A retrieval-first pipeline beats raw prompting for most enterprise cases. I inventory sources of truth, set access controls, and enforce data governance from day one. That includes PII handling, redaction, retention policies, and privacy-by-design. If the agent can’t reliably retrieve the right fact at the right time, the rest doesn’t matter.
Choose models and prompts with discipline. I align model selection with context window management, cost, latency, and tool-use requirements. Then I build prompts and tools together, not in isolation, and I keep temperature, stop conditions, and function-calling explicit. Most importantly, I use eval-driven development: golden datasets, task-specific metrics (accuracy, helpfulness, latency, cost), and target thresholds that must be met before widening rollout.
Manage AI risk upfront. I treat jailbreaks, toxicity, and data leakage as product risks, not just security issues. I implement layered defenses—input/output filtering, policy checks, rate limits, and abuse monitoring—and define escalation paths and human-in-the-loop handoffs for ambiguous cases. Every risky capability needs an owner, a playbook, and a test.
Build the pipeline that lets you iterate safely. Prompts, tools, policies, and retrieval configs go through the same CI/CD rigor as code. I use feature flags for progressive delivery, canary cohorts to limit blast radius, and clear rollback procedures. Observability isn’t optional; I track latency, token usage, cost, failure modes, and user outcomes. I also watch DORA metrics and deployment frequency to ensure we’re improving the engine, not just the output.
Constrain autonomy intentionally. Agent behavior design matters as much as model choice. I set step limits, define tool whitelists, separate read vs write permissions, and specify decision checkpoints. When the agent is uncertain or confidence drops below a threshold, it hands off to a human or a deterministic workflow. Guardrails aren’t barriers; they’re bumpers that keep you on the track.
Instrument what users experience, not just what models produce. I track activation, task success, self-serve completion rates, and time-to-value. I pair Agent Analytics with journey analytics so I can see where the agent helps or hurts. I also invest in UX trust cues—transparent explanations, undo paths, and in-app guides—so users feel in control. When the agent changes behavior through learning, the interface should make that understandable.
If you’re shipping a voice AI agent, test in realistic conditions. I set targets for ASR accuracy, barge-in responsiveness, TTS prosody, and end-to-end latency. I predefine safe transfer logic for complex calls and ensure compliance for call recording and data retention. Voice amplifies both the magic and the mistakes; operational excellence is non-negotiable.
Plan the business rollout like a product, not a press release. I align pricing (often consumption SaaS pricing), packaging, and SLAs with actual unit economics—tokens, inference, and retrieval. I equip solutions engineering with playbooks and reference architectures, wire up CRM integration for attribution, and put feedback loops into Intercom or the support stack so we learn from every interaction.
Run operations like an SRE team. I define incident severity for AI-specific failures (e.g., harmful output, runaway cost, degraded retrieval), add alerting, and keep runbooks current. I schedule postmortems that feed directly into eval baselines and backlog priorities. Continuous discovery isn’t a ceremony; it’s the safety net that keeps improvements compounding.
Close the loop on compliance and governance. From day zero, I document data flows, vendor scopes, and audit logs. I verify regulatory compliance and adopt privacy-by-design so I’m not retrofitting later. Transparency, user consent, and opt-outs aren’t just legal checkboxes; they’re trust-building tools that differentiate your product.
The result of this checklist is speed with confidence. It gives my teams a common language to debate trade-offs, a clear path to production, and the guardrails to scale safely. If you’re preparing to deploy an agent, adapt these steps to your stack and your customers. Your future self—and your users—will thank you.
Your AI feature can be online, fast, and still be failing. A report renders but omits important records. A workflow returns valid JSON with the wrong meaning. A retry creates a duplicate. A permissions change quietly removes the data needed for a trustworthy answer.
If you own an AI product, an uptime dashboard cannot tell you whether users are receiving the outcome you promised. You need a reliability system that covers data, models, runtime dependencies, output quality, delivery, and recovery. The practical goal is not to eliminate every failure. It is to detect meaningful failures early, contain their impact, and recover without making the situation worse.
Define reliability at the user-outcome boundary
Traditional service reliability often starts with a relatively clean question: did the request succeed? AI products make that question insufficient. A request can return a success status while the user receives an incomplete, structurally invalid, stale, unauthorized, or semantically poor result.
Start by writing a reliability contract for one important user journey. State what must be true when that journey succeeds. A useful contract usually covers these dimensions:
Reliability dimension
Question to answer
Evidence to capture
Completion
Did the workflow reach a terminal outcome?
Completed, rejected, timed out, cancelled, or still pending
Structural validity
Does the output satisfy the interface expected downstream?
Schema-validation result, schema version, and rejection reason
Data integrity
Was the required data accessible, current, and complete enough for the task?
Data-source status, permission result, retrieval result, and freshness signal
Semantic quality
Is the answer useful and acceptable for this use case?
Evaluation result by task, customer segment, language, or workflow
Latency
Did the outcome arrive while it was still useful?
End-to-end latency and latency for each pipeline stage
Delivery integrity
Was the result applied once, without duplication or corruption?
Idempotency key, write status, attempt count, and final state
Privacy and risk
Did processing respect the product’s data-handling rules?
Policy checks, PII-scanning result, access decision, and exception path
This contract prevents an easy but damaging mistake: counting technically completed requests as successful user outcomes. If a report is truncated yet parseable, the transport succeeded and the product failed. If a model response is excellent but based on data the user can no longer access, the answer should not be delivered as a success.
Turn the contract into service-level indicators that the system can measure. Then set service-level objectives around the indicators that matter to the user. The difference between the objective and actual performance becomes the error budget available for change and experimentation.
Do not hide behind a global average. Break reliability down by model, prompt version, schema version, dataset, workflow, customer segment, and dependency. AI failures are often concentrated. A healthy aggregate can conceal a severe regression for one language, one integration, or one high-value workflow.
Your error budget should also drive decisions. When budget consumption accelerates, narrow the rollout, pause the risky change, or redirect capacity toward the failure path. When the budget is healthy, you have evidence that the product can absorb controlled experimentation. That is more useful than declaring reliability important while allowing roadmap pressure to settle every tradeoff.
Instrument the full path from request to delivered outcome
A useful AI trace does not stop at the model call. It follows the user request through authentication, permission checks, data retrieval, context assembly, model execution, output validation, business rules, persistence, and delivery. Give the journey one correlation identifier so an engineer can move from a failed user outcome to the responsible stage without reconstructing the request from unrelated logs.
Build visibility at three levels:
Structured events: Record the request identifier, workflow, customer segment, model, prompt version, schema version, dependency, attempt number, latency, result class, and failure code. Use controlled fields rather than free-form error messages for the dimensions you expect to aggregate.
Distributed traces: Create a span for each meaningful stage. A trace should show whether time was spent waiting in a queue, retrieving data, calling a provider, validating output, or committing a side effect.
Keep raw customer data, prompts, and model responses out of routine telemetry unless there is a defined and approved need to retain them. Structured metadata is usually enough for operational diagnosis. When content must be inspected, apply access controls, retention rules, redaction, and PII scanning as part of the observability design. Logging sensitive data first and deciding how to govern it later creates a second reliability problem: the monitoring system becomes a source of risk.
Design failure codes around actions, not organizational boundaries. Invalid model output, missing source permission, provider throttling, exhausted token budget, duplicate delivery, and policy rejection tell the responder what kind of path failed. A generic model error or integration error forces the on-call person to rediscover information the system already had.
Alerts should represent conditions that require intervention. Error-budget burn, broad validation failures, growing queue age, or a dependency circuit remaining open may justify an immediate response. A slow-moving change in evaluation performance may belong in a product review instead. If every anomaly pages someone, the monitoring system trains the organization to ignore it.
The same dashboard should work for product and engineering. An SRE needs the failing dependency and trace. A product leader needs the affected workflow, segment, volume, and user consequence. Connecting both views prevents a team from fixing the loudest technical symptom while a quieter failure causes more product damage.
Harden each boundary instead of trusting the happy path
Most AI workflows combine components with different failure behavior: internal services, databases, queues, retrieval systems, model providers, and third-party data sources. Reliability comes from controlling the boundary around each component. The following sequence gives you a practical hardening checklist.
Bound every external call. Set explicit timeouts using observed latency distributions, including p95 behavior, as an input. A missing timeout allows one slow dependency to consume workers and delay unrelated requests. Treat timeout as a classified outcome rather than an unhandled exception.
Retry only failures likely to be temporary. Provider throttling and transient network failures may recover. Invalid input, permission denial, and schema rejection usually will not. Use delayed retries with exponential backoff and jitter so concurrent failures do not return as another synchronized burst. Cap attempts and record the final reason.
Put a circuit breaker around unstable dependencies. When failure crosses the condition you have defined, stop sending traffic long enough to prevent resource exhaustion and cascading latency. Make the open, probing, and closed states visible. The product should communicate a controlled unavailable or delayed state rather than pretending work completed.
Make side effects idempotent. Derive the idempotency key from the logical operation, destination, and relevant payload version. Persist the result of the operation so retries can return or reconcile the prior outcome. Do not depend on local wall-clock time alone to distinguish writes; clock skew can turn retry protection into duplicate or missing work.
Apply backpressure before the queue becomes the outage. Bound concurrency for each constrained dependency. When demand exceeds safe processing capacity, queue, defer, or reject according to the user promise. Preserve enough state to resume safely. Unbounded retries feeding an unbounded queue convert a temporary provider problem into a long recovery.
Validate contracts before committing effects. Validate generated JSON against the expected schema, including required fields, types, allowed values, and relevant bounds. Keep parsing separate from business validation: syntactically valid output can still violate a product rule. Reject or quarantine invalid results before they reach reporting, billing, messaging, or another irreversible operation.
Detect incomplete generation explicitly. Budget context and expected output together. When the provider exposes completion metadata, use it to distinguish a completed response from one stopped by a limit. Do not pass partial structured output downstream merely because a parser can repair it. Reduce unnecessary context, split an oversized task, or return a controlled failure.
Treat permissions as changing runtime state. Check access near the point of retrieval, classify authorization failures separately, and monitor permission-related drops by integration. Do not repeatedly retry a denial. If upstream access changes silently, the product should expose which data is unavailable rather than producing an apparently complete result from a partial dataset.
Put risky behavior behind feature flags. Separate deployment from release. A flag should let you disable a model, prompt, retrieval path, or downstream action without waiting for another deployment. Test the rollback or disable path before relying on it during an incident.
These controls need an explicit order of operations. Validate permissions before retrieving sensitive data. Validate generated output before executing a side effect. Persist idempotency state before acknowledging completion. Apply retry policy after classifying the failure. Ordering is what prevents individually sensible mechanisms from undermining one another.
Be careful with graceful degradation. It is useful when the degraded state remains honest and valuable, such as delaying a non-urgent report or identifying an unavailable data source. It is dangerous when the system silently substitutes stale, incomplete, or lower-quality information and presents it as equivalent. The user must be able to distinguish degraded output from normal output.
Make model and prompt releases earn production traffic
A prompt edit can change output structure. A model change can improve one task while weakening another. A retrieval change can alter both answer quality and latency. Treat these modifications as production changes even when no application code changed.
An eval-driven release path should work like this:
Version the complete behavior. Record the model, prompt, schema, retrieval configuration, tool definitions, policy rules, and relevant application release. Without this bundle, a failed response cannot be reproduced with confidence.
Build evaluations around the product contract. Cover representative tasks, important customer segments, difficult inputs, and failure cases discovered in production. Include structural checks alongside semantic checks. A quality score cannot compensate for output that breaks its interface.
Establish a baseline. Compare the candidate with the current production behavior on the same evaluation set. Review the distribution by meaningful slice rather than relying only on one average score.
Gate promotion in CI/CD. Require the agreed evaluation baselines to hold or improve before the candidate can progress. Make exceptions explicit, owned, and reversible. A hidden manual bypass is not a release policy.
Release through a canary. Send a limited, observable portion of eligible traffic to the candidate. Keep the current version available. Watch evaluation signals, validation failures, p95 latency, dependency behavior, and error-budget consumption by version.
Expand in stages or roll back. Increase exposure only while the user-facing indicators remain within the agreed conditions. If a signal degrades, use the feature flag or version control to stop exposure quickly while preserving diagnostic evidence.
The release gate needs product judgment. Not every evaluation failure carries the same consequence. A formatting defect in an internal draft is different from an unsupported claim in a customer-facing recommendation or an unauthorized action by an agent. Define which failures block release, which require human review, and which can be monitored after release.
Do not force a choice between delivery speed and reliability without evidence. Track deployment frequency alongside change failure rate. Frequent, small, reversible releases can improve both learning speed and recovery. Large bundled changes make it harder to identify the cause of regression and increase the amount of behavior a rollback must undo.
Before approving an AI release, a product leader should be able to answer five questions:
Which user promise can this change affect?
Which evaluation and production indicators represent that promise?
Which segments could regress even if the aggregate improves?
What condition stops or reverses the rollout?
Who has the authority and the mechanism to act when that condition appears?
If those answers are missing, the release is relying on optimism rather than a control system.
Run reliability as a product operating system
Technical safeguards decay unless ownership and operating routines keep them current. Models change, integrations evolve, permissions move, and traffic develops new burst patterns. Reliability therefore belongs in roadmap and incident decisions, not in a one-time infrastructure project.
Prepare a lightweight runbook for each critical journey. It should identify the owner, user-visible failure states, primary indicators, relevant dashboards, recent release controls, dependency status, safe disable path, and rules for replaying work. A responder should not have to infer whether replay can duplicate a message, report, charge, or external action.
During an incident, establish the user impact before chasing every technical symptom. Identify the affected workflow and segment, stop further harm, preserve evidence, and use the safest available rollback or containment control. Communicate whether results are delayed, incomplete, unavailable, or at risk of duplication. Those states require different user actions.
Afterward, use a blameless review to find the conditions that allowed the failure to reach users. The strongest follow-up actions are testable and automatable: a new schema check, an evaluation case, a permission metric, a retry limit, a canary gate, a better idempotency key, or a rehearsed rollback. An instruction to be more careful is not a control.
Prioritize the reliability backlog by user consequence and error-budget impact. A noisy internal exception with no lost outcome may matter less than a silent data omission affecting a small but important workflow. This keeps observability from becoming a competition to reduce whichever counter is easiest to move.
Privacy-by-design and AI risk management belong in the same operating system. Add PII scanning, access validation, and policy checks to the pipeline and release gates. Assign owners for exceptions. Revisit the controls as the product gains new data sources or actions. Risk is a continuing product constraint, not a review performed after the architecture is settled.
Key takeaways
Define success at the delivered user outcome, not at the HTTP response or completed model call.
Measure completion, structural validity, data integrity, semantic quality, latency, delivery integrity, and privacy where each applies.
Trace the whole pipeline and segment reliability by model, prompt, schema, workflow, dataset, and customer group.
Use timeouts, selective retries, circuit breakers, idempotency, backpressure, validation, and feature flags as coordinated controls.
Gate model and prompt changes with evaluations, then use canaries and staged releases to limit exposure.
Let SLOs, error-budget consumption, and user consequence determine when reliability work outranks feature work.
Choose your highest-consequence AI journey and write its reliability contract. Trace it end to end, attach an SLO to the user outcome, and replay the known failure modes against the controls you already have. If the system cannot tell you whether its output was valid, complete, permitted, and delivered once, that is the first reliability gap to close.
“Speed is not the enemy of safety; it is the prerequisite for it.” I live by this principle. In our organization, the average time from merging code to it being used by customers in production is just 12 minutes, and that short window is fundamental to how we build, ship, and learn.
In January 2026, we are averaging 180 ships per workday – roughly 20 deployments every hour. Conventional wisdom suggests that to increase stability, you must slow down. I believe the opposite. Speed is not the enemy of safety; it is the prerequisite for it. Accumulating code creates risk; shipping small batches minimizes it. Shipping is our company’s heartbeat.
Maintaining this frequency while targeting 99.8+% availability has required over a decade of focused investment in systems, principles, and processes. We protect the integrity of our systems through three layers of defense: an automated pipeline that is simple, reliable, and removes the need for manual intervention, a shipping workflow that promotes ownership and uses guardrails as accelerants, and a recovery model that optimizes for mitigating inevitable failures. Here’s how we’ve built each layer so that velocity is our greatest source of stability.
While our platform consists of various services and frontend applications, I’ll focus here on our Ruby on Rails monolith. It is our core application and the one we deploy most frequently; we also deploy it to three different data‑hosting regions with independent pipelines. Our other services follow similar pipeline principles and safeguards, but the Rails monolith is the clearest example of how we ship at scale.
The automated pipeline is designed to move code from merge to production as fast as possible while enforcing strict safety checks. It is fully automated, and the vast majority of releases require no human intervention—critical for CI/CD at high deployment frequency.
Once an engineer merges code to GitHub, two things happen immediately. First, the build: we compile the Rails application and its dependencies into a deployable asset (a slug) in about four minutes. Second, parallel CI: our test suite runs alongside the build; through extensive optimization, parallelization, and test selection, the vast majority of CI builds finish in under five minutes.
As soon as the slug is built, it’s deployed to a pre‑production environment. CI does not block the progression of the slug to pre‑production. Deploying to pre‑production takes around two minutes. This environment serves no customer traffic, but it is connected to our production datastores, mirrors our production infrastructure variants (e.g., web serving, asynchronous worker), and is configured so that requests exercise the pre‑release code and workers.
Immediately after deployment, we run and await several automated approval gates. We verify that the application boots cleanly on hosts (boot test), confirm the parallel test suite passed (CI check), and execute functional synthetics using Datadog Synthetics on critical flows—such as loading or editing a Fin workflow. If any gate fails, the release is halted and does not go to production.
Once approved, we promote the code to thousands of large virtual machines. A deployment orchestrator triggers these deployments simultaneously, while a decentralized, staggered rollout avoids changing the state of the entire fleet at the same millisecond. Within each machine, a rolling restart mechanism removes a process with old code from the serving path, lets it drain gracefully, and replaces it with a fresh process running the new code. From the moment a deployment starts, first requests are served by new code within roughly two minutes, and the vast majority of the global fleet updates transparently within six minutes. When restarts trigger on every machine, production unblocks so the next deployment can begin.
We treat a stalled pipeline as a high‑priority incident. If the automated system rejects three consecutive release attempts, it pages an on‑call engineer. These are pre‑production blocks, but if the shipping lane stops moving, changes pile up—and our stability relies on building and shipping in small steps. The on‑call’s job is to restore flow so that tiny, safe, frequent updates continue to keep risk low.
Our shipping workflow is built on extreme ownership: tools assist, but the engineer is accountable for quality and the decision to merge. I insist that you are present when you ship. The practical benefit of a 12‑minute deployment cycle is that engineers remain in the zone, focused on the problem they just solved, and ready to validate behavior as it goes live.
A rocket lifts into a luminous sky, a metaphor for shipping code fast without breaking things, where precision, automation, and guardrails power 180 safe deployments a day.
To support this, our deployment system sends Slack notifications the moment code is submitted and as it advances through stages, embeds direct observability links to relevant dashboards and logs in every PR and message, and prompts verification so engineers actively watch the dials and test features in production. It is not acceptable to rely on green builds. You’re expected to watch your change go live and if you’re not prepared to rollback, you’re not prepared to ship. We maintain a no‑blame culture: quick rollbacks and immediate reverts are signs of vigilance and ownership, not failure.
We make extensive use of feature flags to turn deployment into a non‑event. By decoupling deployment (moving code to servers) from release (turning features on), we shrink the blast radius of change. Flags can be enabled for all customers, a specific subset, or disabled for everyone in under 60 seconds through our backend UI. Engineers can group flags into beta features and run phased rollouts; we also ensure flags work consistently across non‑monolith applications. In the past three months, we created over 560 flags—and we actively manage them to avoid permanent complexity.
For complex refactors—especially when behavior should not change—we leverage GitHub Scientist, an open‑source experimentation library. It runs candidate logic (new code) in parallel with existing logic (old code) in production, instruments both paths for result and timing comparisons, and keeps existing behavior user‑visible. That means we can iterate on and validate new code under real load without risking the experience, then switch seamlessly when confident.
When engineers need to go deeper before merging, they can generate a slug and deploy it to a virtual machine, detaching a running production host from the serving path and connecting for manual testing. They can also put a pre‑release slug on a serving machine that handles a small percentage of jobs or web requests. Single‑host validation lets us slice observability to those hosts, compare against the main release, and make low‑level changes safer. Staging is a simulation; production is reality. Testing on a single production host validates assumptions with real‑world data without risking the fleet.
Our recovery model starts from a simple principle: stop monitoring systems; start monitoring outcomes. Traditional monitoring tells you if a server is healthy; we care whether customers are healthy. We rely on heartbeat metrics—vital signs that represent the core value our product provides—such as the rate at which messages and comments are created.
Unlike standard uptime checks, heartbeat metrics are binary in spirit. If message send rates dip below baseline, it does not matter if infrastructure dashboards are green. Down is down, and if customers can’t do their job, uptime percentages are irrelevant. By tracking real‑world success rates as a high‑level signal, we catch subtle degradations that traditional alerting either misses or over‑alerts on.
Because we ship in small, incremental steps and maintain previous releases on our virtual machines, our Time to Recover (TTR) is generally very fast. If a heartbeat metric drops or a critical anomaly is detected right after a ship, the system can trigger an automatic rollback, reverting to the release that was running 20 minutes ago—often restoring service before an engineer responds. For complex issues, engineers can initiate a manual rollback through our deployment UI; doing so also locks the production pipeline to prevent further releases while we investigate and remove problematic code.
Resumption of service is not the end. Every incident prompts an incident review, and we don’t just fix the bug. We ask, “How did the machine allow this to happen?” Then we harden the system so it cannot happen again. This loop—fast shipping, fast recovery, rigorous learning—compounds resilience over time.
This operating model aligns to DORA metrics: high deployment frequency, short lead time for changes, low change failure rate, and rapid time to restore service. It’s a CI/CD and SRE‑informed approach that converts speed into a defensive advantage rather than a liability.
Shipping 180 times a day isn’t a vanity metric; it’s a deliberate choice to protect the customer experience. With a 12‑minute window from code to customer, the feedback loop is tight and engineers retain context—and accountability—for the immediate impact of their work. Maintaining this pace requires more than fast CI; it requires judgment, extreme ownership, disciplined use of feature flags, and a recovery model that monitors outcomes. We rely on human expertise, augmented by these layers of defense, to catch issues before they turn into customer pain. We don’t ship fast despite our need for stability; we ship fast to stay in control of change.
I build AI products with a simple conviction: disciplined experimentation beats intuition. Over the years, I’ve refined a practical playbook that helps my teams learn faster, reduce risk, and turn every release into a smarter next step.
Product experimentation isn’t luck; it’s a method. Learn how top AI product managers test, measure, and grow smarter with every release.
I begin every effort with a crisp hypothesis, an expected user or business outcome, and unambiguous success criteria tied to outcomes vs output OKRs. Before writing a line of code, I define primary metrics and guardrails so we know what “good” looks like—and what to stop.
When the change affects UX, pricing, or activation flows, I favor A/B testing with the statistical rigor to back decisions. We calculate the minimum detectable effect (MDE), choose appropriate randomization units, and pre-register the analysis plan to avoid p-hacking. This gives the team the confidence to scale wins and sunset underperformers quickly.
AI features demand a tailored approach, so I run eval-driven development before any user sees a variant. We curate golden datasets, score candidate prompts and models, and stress-test failure modes. This is where LLMs for product managers matters: prompt templates, context window management, and a retrieval-first pipeline are all evaluated for quality, latency, and cost-to-serve. I treat “hallucination rate,” safety violations, and bias as first-class metrics under AI risk management.
To de-risk launches, we ship behind feature flags with CI/CD, monitor DORA metrics, and roll out in stages. Product trios own problem framing to solution delivery, which shortens feedback loops and preserves accountability. If early signals drift from our hypotheses, we pause, adjust, and re-run—no sunk-cost thinking.
Measurement is non-negotiable. I instrument user journeys end-to-end with Amplitude analytics, track activation and retention analysis, and map behavior to learning objectives. We consolidate logs and events into a unified analytics platform so qualitative insights from customer research pair cleanly with quantitative trends.
Continuous discovery keeps the engine running. Weekly customer conversations, in-product feedback, and lightweight prototypes ensure we validate needs, not just solutions. The output flows into product discovery, product roadmapping and sprint planning, and a reusable AI product toolbox that scales across teams.
Finally, I protect the culture that makes experimentation work: we celebrate invalidated hypotheses, document decisions, and optimize for outcomes over output. That’s how empowered product teams sustain product-led growth—even as complexity grows.
If you’re building AI features today, adopt this playbook to maximize learning velocity, minimize risk, and compound advantage. The method is straightforward: form strong hypotheses, test with rigor, measure what matters, and let evidence—not HiPPOs—guide the roadmap.