Category: Product Management

  • Connecting Amplitude Positioning to Product-Led Growth

    Connecting Amplitude Positioning to Product-Led Growth

    For an analytics product, positioning cannot stop at a market-facing promise. The promise has to appear in onboarding, become visible in user behavior, withstand technical evaluation, and give sales and product teams a consistent explanation of value.

    Taken together, two Shivam.Consulting profiles describe complementary sides of that system at Amplitude. The profile of Darshil Gandhi emphasizes competitive, partner, and technical credibility, while the profile of Tommy Keeley concentrates on acquisition, activation, engagement, and experimentation. Their combined lesson is that positioning and product-led growth work best as one evidence loop rather than as separate marketing and product programs.

    Positioning becomes credible inside the product

    Product positioning defines the problem a product addresses, the value it promises, and the reasons a buyer should choose it. Product-led growth puts that proposition under immediate pressure: users encounter the product directly and can compare the promise with the experience.

    The Darshil Gandhi profile reports that Gandhi leads competitive intelligence, partner product marketing, and technical marketing at Amplitude after serving as a principal on a solutions engineering team. The article treats that technical background as important because positioning must reflect real implementations, not merely persuasive language. It connects this approach to field-tested demonstrations, documentation, reference architectures, integrations, and feedback from sales and solutions engineering.

    The Tommy Keeley profile approaches the same credibility question from the user’s side of the interface. It describes guided onboarding, product tours, progressive disclosure, contextual prompts, and other in-product guidance as ways to move users toward an early experience of value. Funnel instrumentation and session replay are presented as tools for locating friction in that journey.

    These perspectives form a useful positioning test. A claim must be technically defensible during evaluation, understandable when a user first enters the product, and observable in subsequent behavior. If one of those conditions fails, stronger copy alone is unlikely to repair the mismatch.

    Behavioral evidence closes the positioning loop

    The two profiles both assign behavioral analytics a role beyond reporting. In the Gandhi article, Amplitude analytics are used to validate claims and identify themes associated with competitive wins. In the Keeley article, behavioral analytics, cohort analysis, funnels, pathing, and retention analysis help determine which actions are associated with longer-term value and where users abandon important journeys.

    This creates a feedback loop between market language and product behavior. Positioning proposes that a capability produces a meaningful outcome. Instrumentation then shows whether intended users reach that capability, adopt it, and continue using the product. Field feedback adds another layer by revealing which claims survive buyer scrutiny and which require qualification or clearer proof.

    The distinction between correlation and causation remains important. Cohort patterns can identify promising behaviors, but an association with retention does not by itself prove that encouraging the behavior will improve retention. The Keeley profile therefore pairs behavioral analysis with controlled A/B testing, minimum detectable effect thresholds, guardrail metrics, sequential testing, and feature flags. In this model, analytics generates hypotheses and experiments provide stronger evidence for decisions.

    The same discipline applies to AI-enabled personalization. The Keeley article describes using generative AI for tailored onboarding, recommended next actions, and summaries of activity patterns, while placing interventions behind feature flags and evaluating them through controlled experiments with privacy-by-design constraints. AI is therefore framed as an extension of the measurement system, not a substitute for a clear value proposition.

    A shared driver tree connects the market promise to growth

    A recurring mechanism across both sources is the driver tree. The Gandhi profile recommends connecting capabilities to customer outcomes so competitive narratives remain consistent. The Keeley profile starts with a North Star Metric and maps drivers across acquisition, activation, engagement, retention, and monetization. Combined, these uses turn the driver tree into a translation layer between positioning and product-led execution.

    At the top sits the outcome the product claims to enable. Beneath it are the behaviors that indicate users are realizing that outcome, followed by the product capabilities and interventions intended to support those behaviors. Competitive intelligence can examine whether the top-level promise is distinctive and relevant. Technical marketing can verify that the enabling capabilities work as described. Growth teams can measure whether users discover and adopt them.

    This structure also changes acquisition decisions. The Keeley profile argues for optimizing beyond clicks toward post-signup behaviors associated with retention. That requires congruence among the landing-page message, the users being attracted, and the experience after signup. A campaign that produces registrations but draws people away from the product’s strongest use case may improve a top-of-funnel measure while weakening the product-led system.

    Growth loops should follow the same logic. The Keeley article identifies collaboration invitations, user-generated content, and shareable artifacts as possible viral mechanisms. Their strategic value depends on whether sharing is a natural expression of the product’s core value. When distribution emerges from useful product behavior, the loop reinforces positioning; when sharing is detached from that value, it risks becoming a short-lived acquisition tactic.

    Key takeaways

    • Positioning should be treated as a testable claim linking a capability, a user behavior, and a meaningful outcome.
    • Technical evidence, field feedback, and behavioral analytics answer different questions; credible differentiation needs all three.
    • A shared driver tree can align competitive intelligence, product marketing, growth, design, engineering, sales, and solutions engineering around the same value logic.
    • Acquisition quality should be judged partly by meaningful post-signup behavior, not solely by traffic or registration volume.
    • Onboarding, in-product guidance, and viral loops should express the core value proposition rather than operate as disconnected growth tactics.
    • Personalization, including AI-enabled interventions, needs feature controls, privacy safeguards, and experimental evaluation.

    Organizational alignment is part of the positioning system

    Neither source presents this work as the responsibility of a single function. The Gandhi profile emphasizes collaboration among competitive intelligence, partner product marketing, technical marketing, sales, solutions engineering, and product. The Keeley profile describes empowered product trios, continuous discovery, and outcome-focused roadmaps that connect engineering, design, and product decisions to measured growth drivers.

    The synthesis suggests a practical division of responsibility without creating separate agendas. Market-facing teams clarify the buyer’s alternatives and the basis for differentiation. Technical teams establish what can be demonstrated and implemented. Product teams reduce the distance between signup and experienced value. Growth teams measure the journey and test interventions. Partners can make integrations and associated use cases more repeatable.

    The forward opportunity is to make this loop increasingly explicit: every major positioning claim can be connected to product evidence, every growth initiative can be checked against the intended value proposition, and every field objection can become an input to product discovery. That approach gives Amplitude’s reported playbooks a broader implication for product-led companies: differentiation becomes more durable when the story, the implementation, and the observed behavior keep correcting one another.

    References

  • Supercharge Insights with Amplitude Agent Connectors: Connect Notion, Slack, Linear & More

    Supercharge Insights with Amplitude Agent Connectors: Connect Notion, Slack, Linear & More

    I’ve led enough multi-tool product organizations to know how quickly momentum erodes when insights and actions live in different places. When my teams bounce between Notion, Atlassian, Slack, Linear, and analytics dashboards, we pay a real tax in context switching. That’s why I’m excited about what Amplitude is enabling with Agent Connectors—bringing our daily work and our data-driven decisions into one fluid, agentic AI workflow.

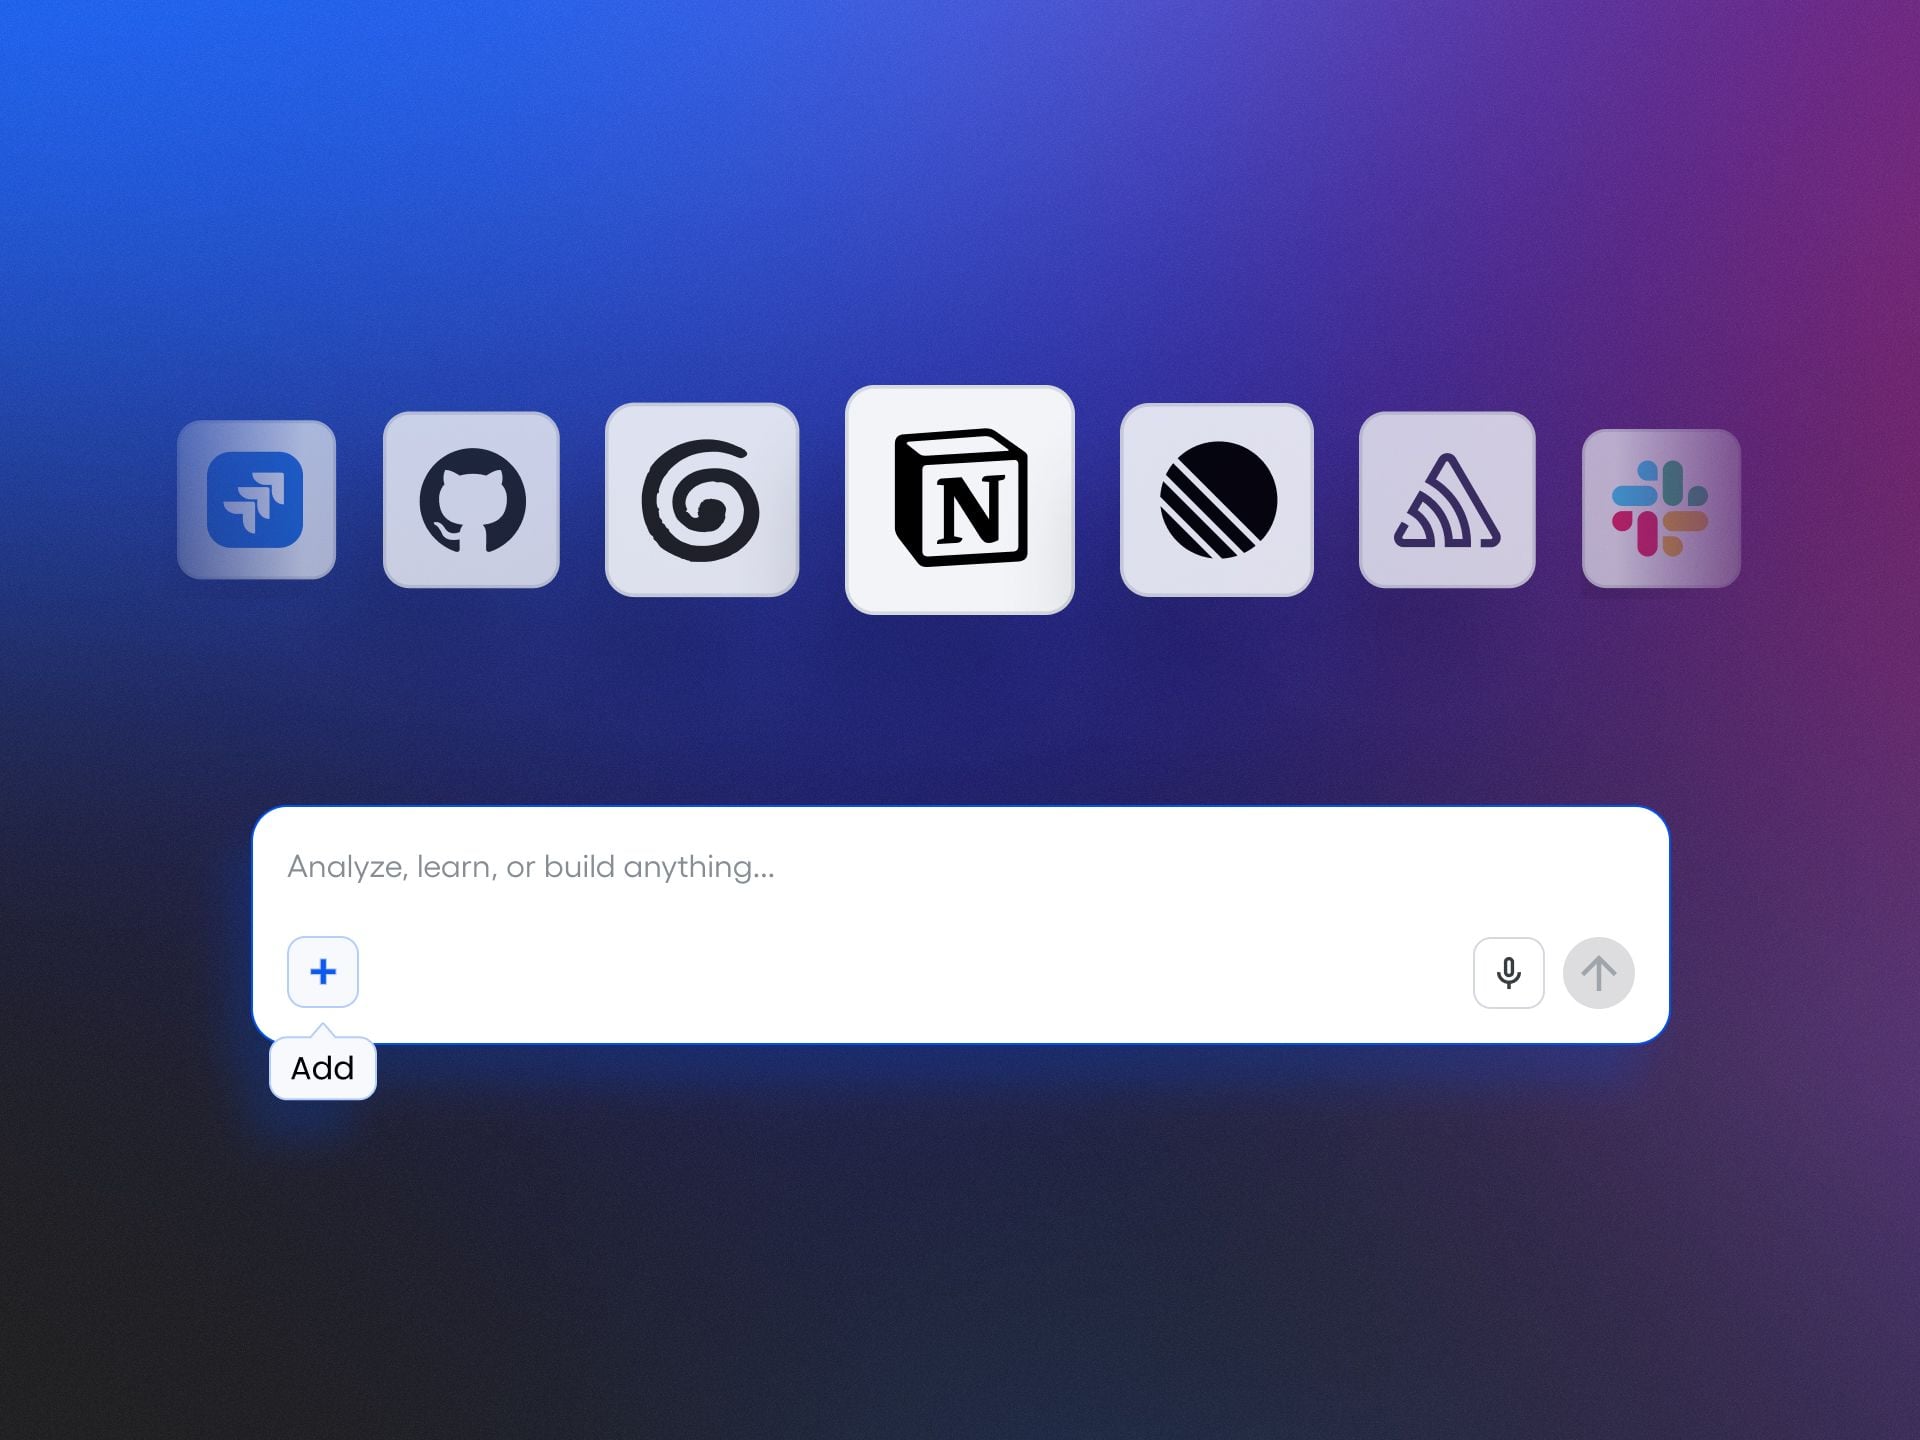
    Connect Notion, Atlassian, Slack, Linear, and more to Amplitude's Global Agent. Get richer analysis and take action across tools without leaving Amplitude.

    Practically, this means I can treat Amplitude analytics as a unified analytics platform where analysis and execution finally meet. Instead of exporting charts or copying insights into docs, I can drive Agent Analytics directly from the same surface where I manage behavioral analytics, reducing friction and accelerating decisions. For my product strategy, that’s a meaningful shift—from “insight later” to “insight-to-action now.”

    Here’s how I’d use it on a typical day: I ask the agent to synthesize signals from recent feature usage, spotlight anomalies, and then draft a concise summary for our Slack channel. In the same flow, I can prompt it to reference our Notion specs for context and queue next steps in Linear, keeping Atlassian stakeholders looped in without any extra swiveling between tabs. The value isn’t just faster execution; it’s tighter alignment across teams because the analysis and the plan live together.

    From an operating model perspective, this is how I scale AI workflows responsibly. I can define clear prompts, approval paths, and ownership so the agent augments—not replaces—expert judgment. Data governance and permissions remain front and center: the agent sees what your teams are allowed to see, and we maintain auditability on critical workflow steps. The outcome is a trustworthy, repeatable system that compounds learning over time.

    If you’re exploring agentic AI for product teams, start small and instrument your ROI. Pick one or two connectors (Slack and Notion are great first choices), define a measurable workflow—like pushing weekly retention insights and creating prioritized follow-ups in Linear—and iterate using continuous discovery. In my experience, the first wins appear as reduced time-to-insight, fewer meetings to align, and faster cycle time from observation to shipped change.

    The big picture is simple: bring your work to your analytics, and your analytics to your work. With Agent Connectors, Amplitude’s Global Agent helps close the loop from understanding behavior to taking action—without leaving the place where your insights are born.


    Inspired by this post on Amplitude – Best Practices.


    Book a consult png image
  • Broken Procurement Is Costing You Talent: A Product Leader’s Playbook for Speed and Sanity

    Broken Procurement Is Costing You Talent: A Product Leader’s Playbook for Speed and Sanity

    Procurement should accelerate value, not suffocate it. Listening to this episode, I found myself nodding (and wincing) through a painfully familiar story about how well-intended controls morph into barriers that keep great expertise out. As a product leader responsible for speed, outcomes, and brand experience, I see procurement as a direct mirror of culture—and an often overlooked part of the product operating system.

    In the conversation, Teresa is cranky—and honestly, she has every right to be. She’s simultaneously juggling seven speaking engagement contracts, and six of them have become a part-time job in themselves—think 80-page ethics policies, 800-question security forms, and Multi-Factor Authentication (MFA) questions asked 17 different times. Meanwhile, the one company that just put her fee on a credit card? Scheduled, confirmed, and done in two weeks. That contrast is the whole story: friction repels talent; clarity and simplicity attract it.

    Petra adds her own horror story—filling out 12 identical Word document forms—and together they surface a deeper truth I’ve seen across organizations: broken vendor processes don’t just frustrate consultants; they stop companies from getting the expertise they actually need. And despite what many assume, company size isn’t the deciding factor—leadership intent and process ownership are.

    If you’ve ever wondered why a training got canceled, why a speaker backed out, or why your team can’t seem to bring in outside experts, this is likely the culprit: procurement theater. Repetitive forms, unbounded scope creep, and sprawling security reviews create drag that outlasts any short-term legal or compliance gain. The opportunity cost—lost learning, slower progress, and talent that simply says no—is enormous.

    One detail that stood out: with CEO-level buy-in, a legal review timeline collapsed from four months to 10 days. I’ve seen the same thing. Executive sponsorship is the fastest procurement tool there is, and it reveals what the organization truly values. If you can compress the path when a leader cares, you can redesign the path so it’s always faster—without compromising real risk management.

    I also loved the clarity of a simple policy from the episode: Teresa’s new policy is straightforward—her paperwork, credit card payment, no vendor setup—or no speaking engagement. That’s not obstinance; it’s a bright-line test for whether an organization respects expert time and understands total cost. The best experts have options, and friction filters them out first.

    Here’s how I operationalize this in product-led organizations. Tier risk by engagement type (e.g., one-hour talk vs. long-term software vendor) and match the process to the risk. Offer a credit-card fast lane with standard, plain-English terms for low-risk work. Eliminate duplicate data entry and kill redundant questionnaires. Use a single, secure intake that auto-fills known fields. Track cycle time end to end, and publish SLAs for legal, InfoSec, and finance. Most importantly, make vendor experience a first-class metric—because it is a brand experience.

    Security and compliance matter, but they must be right-sized. If you’re buying a keynote, you’re not buying data processing—so why the 800-question security review? Calibrate controls to actual data access and system interaction. The episode even references AWS DynamoDB and GuardDuty, plus Claude Code—helpful reminders that your stack context matters, but not every purchase touches it. Don’t conflate deep technical diligence for a SaaS integration with a simple, no-data engagement.

    There’s a reason the classic film Office Space gets a nod—it’s the perfect metaphor for what happens when well-meaning governance calcifies. Bureaucracy compounds over time, usually after adverse events, until startups—or any team that still moves fast—run circles around you. Procurement that treats experts like adversaries won’t win the race that actually matters: learning faster than the market.

    If you want the full story, listen to the episode here: Spotify (https://open.spotify.com/episode/2JHnTvnZX2WcFczml7ozKY?ref=producttalk.org) | Apple Podcasts (https://podcasts.apple.com/kh/podcast/procurement/id1794203808?i=1000770701690&ref=producttalk.org). It’s cathartic, but more importantly, it’s a blueprint for fixing what’s broken.

    Mentioned in the episode: Hire Teresa to Speak (https://www.producttalk.org/hire-teresa-to-speak/), AWS DynamoDB (https://aws.amazon.com/dynamodb/?ref=producttalk.org), GuardDuty (https://aws.amazon.com/guardduty/?ref=producttalk.org), Claude Code (https://www.claude.com/product/claude-code?ref=producttalk.org), and Office Space (https://en.wikipedia.org/wiki/Office_Space?ref=producttalk.org).

    I’d love to hear your experiences and fixes. Where does your procurement flow break, how do you measure cycle time today, and what would it take to create a vendor experience you’d be proud to put your brand on? Drop your thoughts below and let’s trade playbooks.


    Inspired by this post on Product Talk.


    Book a consult png image
  • A Reliable Amplitude AI Workflow for Product Decisions

    You ask Amplitude AI why activation fell. It returns a convincing explanation, a few plausible segments, and a recommendation your team could act on. The problem is that you still don’t know whether the answer reflects your product data, an ambiguous metric, or a reasonable-sounding guess.

    You don’t fix that uncertainty with a longer prompt. You fix it with a controlled workflow: define the decision, provide only the context needed to analyze it, let AI run a bounded sequence of checks, and require evidence before accepting a conclusion. The result is an analysis another product manager can inspect, reproduce, and turn into action.

    Start with a decision contract, not an open-ended question

    A request such as analyze our onboarding leaves too many choices to the model. It must decide what onboarding means, which users count, what success looks like, which period matters, and whether the goal is diagnosis or opportunity discovery. A polished answer can hide those unresolved choices.

    Write a short decision contract before opening the analysis. It should contain five elements:

    • Decision: State what someone will decide after reading the result. For example: decide which activation bottleneck the onboarding team should investigate next.
    • Population: Name the eligible users, accounts, plan types, platforms, markets, or acquisition channels.
    • Metric: Supply the exact event or formula, its time window, and any exclusions.
    • Evidence bar: Specify what the answer must show, such as the supporting events, segments, funnel steps, or behavioral trend.
    • Output: Ask for a conclusion, competing explanations, uncertainties, and the next analysis or product action.

    A useful objective is narrow enough to fit in one sentence. Your quality rubric can be slightly longer: require every conclusion to identify the relevant metric, population, comparison, and evidence. This intent-first, evaluation-driven approach keeps the analysis tied to a product decision instead of rewarding whatever answer sounds most complete.

    Constraints belong in the contract too. If the team cannot change pricing, instrumentation, or a particular onboarding step, say so. If a result must remain descriptive because the analysis cannot establish causality, require that distinction. AI is more useful when it knows which doors are closed.

    Build a compact context packet Amplitude AI can actually use

    Amplitude AI can only interpret behavior through the data model it receives. If two teams use different definitions of an activated account, or an event changed meaning after an instrumentation update, the model can produce a coherent answer to the wrong question.

    Create a reusable context packet for each important product area. Keep it short enough to review, but precise enough to remove semantic guesswork. Include:

    • Metric definitions: Write the numerator, denominator, qualifying window, and exclusions for activation, retention, conversion, or any other decision metric.
    • Event taxonomy: List the events and properties relevant to the question, including known aliases or deprecated events that should not be used.
    • Segment definitions: Explain how key cohorts are formed and which properties distinguish users from accounts.
    • Known data limitations: Flag missing platforms, delayed events, identity-resolution issues, tracking changes, and periods that should not be compared.
    • Recent product context: Include only releases, experiments, or journey changes that could plausibly affect the behavior under review.

    Use retrieval before expansion. Start with the smallest relevant set of definitions and observations. Add more context only when the analysis reaches a question that requires it. Dumping an entire analytics catalog into the prompt makes it harder to see which definitions shaped the answer and gives irrelevant details more chances to distract the model.

    Examples can stabilize recurring work, but choose them carefully. One to three strong examples are enough to demonstrate the expected structure, evidence standard, and level of uncertainty. Remove old conclusions and stale numbers before reuse. You want the model to copy the analytical pattern, not inherit a previous answer.

    Version this packet alongside the workflow. When an event definition, segment, or guardrail changes, record the change and rerun the analyses that depend on it. That turns context management from prompt housekeeping into part of your analytics governance.

    Run a bounded analysis loop, then challenge the result

    Move from observation to explanation in explicit steps

    Don’t ask for a diagnosis in a single jump. A reliable workflow separates what happened from why it may have happened. Use a fixed sequence:

    1. Establish the baseline. Confirm the metric definition, eligible population, comparison, and direction of change.
    2. Locate the difference. Break the result down by the segments most relevant to the decision. Avoid exploring every available property.
    3. Inspect the journey. Examine funnel steps, behavioral paths, retention patterns, or other views that can show where behavior diverges.
    4. Generate competing hypotheses. Ask for more than one plausible explanation and require supporting and contradicting evidence for each.
    5. Choose the next best analysis. Run the segment drill-down, funnel attribution, or anomaly check most likely to separate the leading explanations.
    6. Apply a stop rule. End when the evidence is sufficient for the stated decision, when the remaining uncertainty requires new instrumentation, or when another analysis would not change the next action.

    The stop rule matters. Without one, an agentic workflow can keep generating cuts of the data that add activity without increasing confidence. Before each tool call, require the system to state what question the analysis will answer and how each possible result would change its next step.

    If you expose Amplitude actions through MCP or another callable interface, keep each tool narrow and observable. A call should have explicit inputs, a recognizable output shape, and an error state the workflow can surface. Log the question, parameters, returned evidence, and the interpretation built from it. Tool access makes iteration faster; it does not remove the need for an audit trail.

    Put every conclusion through a verification gate

    Before a finding reaches a stakeholder, check it against a simple evidence ledger. For each important claim, record:

    • the event, metric, segment, funnel step, or trend that supports it;
    • the population and comparison to which it applies;
    • whether it is an observation, interpretation, or causal hypothesis;
    • the strongest alternative explanation;
    • the assumptions or data limitations that could change the conclusion;
    • the next check required if confidence is still too low for the decision.

    Then try to disprove the preferred answer. Ask whether the pattern survives a relevant segment change, whether a tracking change could explain it, and whether the same evidence also supports a competing hypothesis. This adversarial pass is often more valuable than asking the model to make its first response more detailed.

    Turn repeated checks into an evaluation set. Save representative questions, approved metric definitions, required evidence fields, and known failure cases. Rerun them when prompts, context, instrumentation, or model versions change. Review failures by category: wrong scope, wrong metric, unsupported inference, missed uncertainty, or unusable recommendation. That gives your team a regression signal instead of a vague impression that the workflow still works.

    Hand stakeholders a decision artifact, not an AI transcript

    The output should make the next decision easier. A long transcript of prompts, tool calls, and exploratory branches shifts the work of interpretation onto the reader. Keep the trace for auditability, but present a concise decision artifact with six fields:

    • Decision: The choice this analysis informs.
    • Finding: The clearest supported behavioral observation.
    • Evidence: The exact events, segments, funnel steps, or trends behind the finding.
    • Uncertainty: What remains unknown and what the analysis cannot establish.
    • Recommendation: The next analysis, discovery activity, experiment, or product change justified by the evidence.
    • Owner: The person responsible for the next step and the condition that triggers a follow-up.

    Keep human judgment at the decision boundary. Amplitude AI can retrieve definitions, propose analyses, call tools, compare patterns, and draft the artifact. A product leader should still decide whether the evidence is strong enough, whether the recommendation fits current constraints, and whether the cost of being wrong is acceptable.

    That division of labor also clarifies accountability. If the AI workflow produces an unsupported inference, improve the context, tool contract, or evaluation. If the evidence is sound but the organization chooses a different path, record the strategic reason. Don’t let an AI-generated recommendation blur the difference between analytical output and an accountable product decision.

    Key takeaways

    • Begin with the decision, population, metric, evidence bar, and required output.
    • Give Amplitude AI a small, versioned context packet instead of an unfiltered analytics catalog.
    • Separate baseline measurement, segmentation, journey analysis, hypothesis generation, and the next tool call.
    • Require evidence, alternatives, assumptions, and a stop rule before accepting a conclusion.
    • Save recurring checks as evaluations and rerun them when data, prompts, tools, or models change.
    • Deliver a decision artifact with a named owner while keeping the analytical trace available for review.

    Start with one recurring product question this week. Write its decision contract, assemble the minimum context packet, and define the verification gate before asking Amplitude AI to analyze anything. Once that workflow survives review, save it as the template for the next question.

    References

  • Join Me in June: Master Opportunity-First Product Strategy with Continuous Discovery Habits

    Join Me in June: Master Opportunity-First Product Strategy with Continuous Discovery Habits

    I’m celebrating the five-year anniversary of Continuous Discovery Habits by inviting you to read it with me this June. As someone who leads product management and coaches product trios, I’ve seen how a shared discovery practice tightens alignment, speeds up learning, and drives outcomes. This month, we’ll go deep on prioritizing opportunities—not solutions—and I’ll guide you step by step so you can apply the ideas on your own team.

    Each month, I’m releasing an in-depth reading guide that includes:

    We’ll discuss each month’s reading in the comments, and we’ll gather quarterly on a live call to unpack real-world applications, trade wins and missteps, and keep the momentum going.

    Joining late? No problem. I monitor the comments on each reading guide throughout the year. Start with the current month or go back to January—whatever works for you. Ask for help, share what’s working, and connect with other readers at any point.

    If you want to participate, grab a copy of the book (or dust off your old copy), share the “Spread the Love” videos with your team, block time for the exercises, and register for the community sessions. Let’s do this.

    This Month’s Reading

    Chapter:

    Estimated reading time: ~16 minutes

    This month's chapter will introduce you to:

    Need a copy? Grab the book

    Share the Love with Friends and Colleagues

    We learn best in community. Use these short videos to spread the key ideas across your product trios, engineering partners, and stakeholders. Invite them to read along with you so your discovery cadence—and your product strategy—advance together.

    Reflect & Discuss What You Read

    When we reflect and discuss what we read, we absorb more and apply it faster. This chapter challenges a deeply ingrained habit: prioritizing solutions. I’ve been in those meetings—spreadsheets full of features, heated roadmap debates, and a creeping sense that we’re optimizing outputs rather than outcomes. The shift to opportunity-first thinking changed how my teams frame bets, sequence discovery, and communicate product strategy.

    Individual Reflection

    Team Discussion

    Put It Into Practice

    This month is all about shifting from solution-first to opportunity-first thinking. These short, focused exercises will help your product trio practice opportunity prioritization and improve decision speed without sacrificing product discovery rigor.

    Exercise: Map Your Roadmap to Opportunities

    Time: 45 minutesDo this: With your product trio

    Take your current roadmap or backlog and work backwards. For each planned feature or solution:

    This exercise often reveals that you're either:

    Use these insights to inform your next prioritization conversation.

    Exercise: Practice Two-Way Door Thinking

    Time: 30 minutesDo this: With your product trio

    Choose 3-5 recent or upcoming product decisions. For each one, discuss:

    The goal is to calibrate your team's decision-making speed. Two-way door decisions should be made quickly with "just enough" evidence. One-way door decisions deserve more deliberation and data.

    Go Deeper: Additional Reading

    If you prefer an audio summary of this month’s reading, including the book chapters and the following resources, I’ve included an audio version for members at the bottom of this post.

    Related In-Depth Guides

    Supplementary Reading

    Related Courses

    Our Live Discussion Schedule

    Our live discussion sessions are for registered members. Sessions are not recorded. Invitations will go out two weeks before the scheduled event—reserve time now.

    Audio Summary

    Prefer to listen? Stream the audio overview here: June — Prioritizing Opportunities (audio).

    Ready to put continuous discovery into action? Grab the book, share the videos with your team, schedule the exercises, and join the community sessions. Opportunity-first product strategy is a muscle we can build together.

    The chapters we will be readingA preview of the most important concepts we'll be learning aboutShort videos you can share with friends and colleagues to help spread the ideasIndividual and team discussion questions to help you absorb and engage with the readingTeam exercises to help you put the ideas into practiceAdditional reading to help you go deeper on the core ideasChapter 7: Prioritizing Opportunities, Not SolutionsWhy product strategy happens in the opportunity space, not the solution spaceHow to focus on one target opportunity at a time to deliver value iterativelyUsing the tree structure to simplify prioritization decisionsThe four criteria for assessing opportunities: sizing, market factors, company factors, and customer factorsWhy treating prioritization as a messy, subjective decision leads to better outcomes than scoring formulasThe concept of two-way door decisions and how they apply to opportunity prioritizationWork on one small opportunity at a time – Reduce your batch sizeGetting started with compare and contrast decisions – Choose the right target opportunityTurn big intractable problems into smaller, more solvable problems – The power of decompositionThink about your team's current roadmap or backlog. How much of your time is spent prioritizing features versus understanding and prioritizing customer opportunities? What would change if you flipped that ratio?Reflect on the last time you made a product decision. Did you treat it as a one-way door (irreversible) or a two-way door (reversible)? How did that framing affect your decision-making process and timeline?Consider the four assessment criteria (opportunity sizing, market factors, company factors, customer factors). Which of these does your team currently emphasize most? Which do you tend to overlook or underweight?As a team, list the top 5-10 items on your current roadmap or backlog. For each one, try to identify the underlying customer opportunity it addresses. If you can't clearly articulate the opportunity, what does that tell you about how you're making decisions?The chapter argues against scoring formulas (like RICE or ICE) for prioritization, calling them "made-up math." If your team uses a scoring system, discuss: What is it really measuring? Does it help you make better decisions, or does it just make subjective decisions feel more objective?Walk through a recent prioritization decision. Did you assess options in isolation ("should we build this?") or compare and contrast them? How might your decision have been different with a compare-and-contrast approach?Identify the customer opportunity it's meant to addressWrite it as something a customer might say (e.g., "I can't find anything to watch" not "We need better search")Look for patterns: Are multiple solutions addressing the same opportunity? Are some solutions disconnected from any clear customer need?Spreading yourself thin across too many opportunitiesOver-investing in a single opportunity with multiple solutionsBuilding solutions with no clear opportunity attachedIs this a one-way door decision (hard to reverse) or a two-way door decision (easy to reverse)?If it's a two-way door, what's the smallest step we could take to learn whether we're on the right track?What would we need to see to know we made the wrong choice?If we realize we're wrong, how quickly could we course-correct?Opportunity Solution Trees: Visualize Your Discovery to Stay Aligned and Drive OutcomesCustomer Interviews: Uncover Hidden Insights from Every ConversationPrioritize Opportunities, Not Solutions7 Key Benefits of Using Opportunity Solution TreesProduct in Practice: How 2-Way Door Decisions Helped Simply Business Learn FastProduct in Practice: Getting Started with Opportunity Solution Trees at SuperAwesomeProduct Discovery Fundamentals: Learn a structured and sustainable approach to continuous discovery.Tuesday, June 16, 2026: 9am-10am PDTThursday, September 17, 2026: 9am-10am PDTWednesday, December 16, 2026: 9am-10am PST


    Inspired by this post on Product Talk.


    Book a consult png image
  • Stop Support Tickets Before They Start: How AI Unsticks Users and Lifts Conversions

    Stop Support Tickets Before They Start: How AI Unsticks Users and Lifts Conversions

    Every moment of friction in a product carries a hidden cost: attention drifts, motivation wanes, and the next click becomes a support ticket—or worse, silent churn. Over the years, I’ve learned to treat “stuck” as an urgent product signal, not just an operational nuisance. When we unstick users in the flow, we protect revenue, brand trust, and the momentum that powers product-led growth.

    Learn how Amplitude’s Global Support team uses AI Assistant to reduce support tickets, prevent user churn, and increase conversions.

    I reference that line often because it captures a proven pattern: meet users where confusion peaks and resolve it instantly. In my practice, the formula is straightforward—pair behavioral analytics and session replay with a just-in-time AI Assistant, routed by clear driver trees. This transforms support from reactive firefighting into a proactive, in-product experience that accelerates onboarding and boosts user activation.

    Here’s how I operationalize it. First, I use Amplitude analytics and behavioral analytics to surface high-friction steps—pages with elevated drop-off, loops, or rage clicks. Session replay clarifies the “why” behind the numbers, while cohort and retention analysis reveal who’s most at risk. Then I deploy targeted in-app guides and tooltip design to preempt known pitfalls, while an AI Assistant handles real-time questions with context from our knowledge base and product docs.

    The AI Assistant is more than a chatbot. With well-structured AI workflows, it detects intent, pulls precise snippets from docs-as-code, and handles routine issues instantly. When complexity spikes, it executes a graceful handoff to consultative support via Intercom or a Zendesk integration—preserving conversation history and sentiment cues—so humans spend time where judgment matters. This hybrid model keeps response times low without sacrificing quality.

    To de-risk changes, I lean on A/B testing and feature flags. I measure time-to-value, activation rate, and funnel conversion as leading indicators, while tracking ticket deflection, CSAT, and NRR as trailing indicators. The goal isn’t just fewer tickets; it’s faster learning loops and a compounding improvement in user outcomes. When we see activation curves steepen and onboarding friction flatten, we know the system is working.

    Practically, I start with the top three friction points in onboarding, implement narrow in-app guides, and deploy the AI Assistant with strict guardrails and clear escalation paths. Weekly reviews align product, customer success, and solutions engineering around shared telemetry—so we tune prompts, content, and UI patterns together. Over time, I’ve seen ticket volume decline meaningfully, while conversion and retention rise as users experience fewer dead ends.

    If you’re evaluating where to begin, identify the moments where confusion compounds—pricing configuration, integrations, and data mapping are common culprits. Then introduce targeted, context-aware help right where users hesitate. You’ll not only prevent “every stuck user” from turning into a ticket—you’ll convert friction into confidence, and confidence into growth.


    Inspired by this post on Amplitude – Best Practices.


    Book a consult png image
  • How to Design a Dependable CLI Agent Users Can Trust

    How to Design a Dependable CLI Agent Users Can Trust

    Your CLI agent can look impressive in a controlled demo and still feel unsafe in a real repository. The moment it can edit files, invoke tools, or use credentials, users need to understand what it will do before they let it proceed.

    The dependable design is rarely the one with the most capabilities. It is the one with the smallest clear promise, predictable execution, visible controls, and evidence that it succeeds repeatedly.

    Define the boundary before you define the features

    Start by writing an operating contract for the agent. This is a product decision, not a prompt-writing exercise. A useful contract answers five questions:

    • What job does the agent complete?
    • Which resources and tools may it use?
    • What must it never do?
    • Which actions require explicit approval?
    • What observable result counts as success?

    Keep the job narrow enough to explain in one sentence. If the description needs a collection of exceptions, the interface is already carrying too much ambiguity. Split the work into a clearly named subcommand or make the advanced behavior opt-in.

    Treat every flag, tool, and permission as an increase in blast radius. A new option does not merely add flexibility. It creates another state the agent can misunderstand, another path you must test, and another behavior the user must learn. Reducing the surface area can improve repeatability and trust because both the agent and the user have fewer possible paths to reason about.

    When reviewing a proposed capability, ask whether it makes the mental model smaller. If it does not, remove it, defer it, or isolate it behind progressive disclosure. Safe, fast defaults should handle the common case without demanding that a new user understand the entire system.

    Design one boring, observable execution path

    A dependable run should feel like a transaction with recognizable stages. The model can help interpret intent, but it should not invent the execution contract as it goes.

    • Capture intent: Ask only for information required to resolve the task. If a missing choice would materially change the result, stop and ask.
    • Retrieve context: Fetch the smallest relevant set of files, facts, or records. More context can introduce conflicting instructions and distract the agent from the requested change.
    • Show the plan: Present a compact description of the intended actions, affected targets, and likely side effects.
    • Preview when useful: Provide a dry run for operations whose effects the user should inspect before execution.
    • Execute through narrow tools: Give each tool a deterministic input and output contract. Reject malformed responses instead of guessing what they meant.
    • Verify the result: Check the resulting state and tell the user what changed, what did not, and whether any step failed.

    The agent should stop when the requested scope changes, required context is unavailable, or a tool returns an unexpected result. A visible stop is easier to recover from than confident improvisation.

    Favor idempotent operations wherever you can. Repeating an idempotent action produces the intended state without duplicating or compounding its effects. That property matters in a CLI because interrupted runs and retries are normal operating conditions. Test the second run as deliberately as the first.

    Put human control at the blast-radius boundary

    Do not ask for approval at every step. Constant prompts train users to approve without reading. Place confirmation gates where the consequence or scope changes.

    • Read-only work: Make inspection and planning the default where possible.
    • Scoped writes: Request access only to the specific project, service, or resource needed for the task.
    • Destructive actions: Require a separate confirmation that names the target and explains the consequence.
    • Credentials: Use narrowly scoped, time-bounded access rather than broad credentials that persist beyond the run.
    • Expanded capability: Let users opt into advanced tools instead of quietly enabling them for every session.

    A confirmation message should help the user make a decision. Replace a generic question such as “Continue?” with a concrete statement of what will be changed and whether it can be undone.

    Reversibility should shape the underlying implementation as well. Prefer changes that can be represented as a patch, show the proposed difference before applying it, and preserve enough information to explain how to undo the operation. When reversal is impossible, make that fact visible before execution.

    Use a simple review question for each workflow: can a user predict the maximum consequence of saying yes? If the answer is unclear, the permission boundary is too broad or the confirmation arrives too late.

    Prove reliability before expanding the roadmap

    Do not use capability count as the measure of progress. Before adding a feature, define the task it should complete, the success threshold it must meet, and the smallest interface needed to test it. This turns roadmap discussions into observable product decisions.

    Evaluate at least three outcomes: task completion, time to first successful result, and stability when the same operation is run again. A capability that succeeds once but behaves differently on a retry is not ready merely because the first demonstration worked.

    Instrument each run with Agent Analytics. Capture the input, tools selected, duration, outcome, and error pattern. Review those signals to find where the agent asks unnecessary questions, repeats tool calls, loses users, or encounters the same failure. The response may be a smaller prompt, a tighter tool contract, a safer default, or the removal of a confusing option.

    Documentation belongs in this reliability loop. Keep runnable examples alongside the code and make them reflect the golden path. Treat any mismatch between documented behavior and actual behavior as a product defect. If the workflow cannot be explained and demonstrated simply, it is not yet a dependable workflow.

    Use these evaluations as promotion gates. Add power only after the current path is measurable, understandable, and stable. That discipline earns you the right to expand without turning the CLI into a collection of loosely related agent behaviors.

    Key takeaways

    • Write the agent’s operating contract before choosing its tools or refining its prompt.
    • Keep the default workflow narrow, safe, fast, and explainable in one sentence.
    • Retrieve minimal context, show a compact plan, execute through deterministic contracts, and verify the result.
    • Place explicit approval at destructive, irreversible, or scope-expanding boundaries.
    • Measure completion, time to first success, and rerun stability before adding another capability.
    • Use run telemetry and executable documentation to decide what to simplify next.

    Choose one golden-path task and write its operating contract now. Then run it twice: once normally and once as a retry. Every surprise you find is a reliability requirement to resolve before you broaden the agent’s reach.

    References

  • Analytics-Led Growth Engineering: A Practical Operating Model

    Analytics-Led Growth Engineering: A Practical Operating Model

    Your team has dashboards, event data, and a backlog of growth ideas. Yet decisions still come down to whoever has the strongest opinion, and experiment results rarely change the roadmap.

    The missing piece is usually not another analytics tool. It is an operating model that connects user behavior to a decision, a controlled release, and a measurable business result. Here is how to build one.

    Start with a growth constraint, not a dashboard

    Analytics-led growth begins with a constraint you want to remove. A broad instruction such as improve onboarding gives your team too much room to produce activity without progress. Frame the problem as a break in the user journey instead: qualified users reach the setup screen but fail to complete the action associated with first value.

    Connect that problem to your North Star metric through a driver tree. If the North Star depends on retained active accounts, its drivers might include the number of activated accounts, how frequently they return, and how deeply they use the product. Each driver can then be decomposed into observable behaviors.

    This prevents a common mistake: optimizing the easiest metric to move rather than the metric that matters. More tooltip clicks are not useful if they do not increase successful setup. Higher setup completion is still questionable if those users never return.

    Before opening your analytics platform, write down four things: the user segment, the behavior that is breaking, the outcome it should influence, and the decision you will make if the signal changes. If you cannot name the decision, you are probably requesting a report rather than investigating a growth opportunity.

    Build an evidence chain you can trust

    A growth team needs to trace the path from exposure to durable value. That requires more than counting page views. Instrument the events that represent intent, progress, successful value delivery, and return behavior.

    For every important event, define who triggered it, what object it affected, where it occurred, and whether it represents an attempt or a successful outcome. A generic event such as integration clicked cannot tell you whether the connection worked. Separate the attempt, completion, failure, and first successful use.

    Then inspect the journey through three complementary views. Funnel analysis shows where users stop progressing. Cohorts reveal whether the problem is concentrated among particular acquisition channels, plans, roles, or use cases. Retention analysis tests whether an apparent activation gain survives after the initial session.

    Behavior alone will not explain motivation. Pair the quantitative signal with customer interviews, support conversations, or session-level evidence. If a funnel shows that users abandon a configuration step, qualitative evidence can distinguish confusing language from missing permissions, weak intent, or a technical failure.

    Treat instrumentation defects as product defects. An event that fires twice, changes meaning, or omits a critical property can send engineering effort toward the wrong problem. Assign an owner to each decision-critical event and verify it across the full journey before using it to approve a rollout. Reliable behavioral analytics, cohorting, and funnel analysis are the foundation of this operating model, not a reporting layer added after release.

    Turn every growth idea into an experiment contract

    An experiment should begin with a falsifiable claim. Use this structure: for a defined user segment, changing a specific part of the experience should change a target behavior because it removes an identified barrier.

    Complete the contract before implementation. Name the primary success metric, the guardrails that must not deteriorate, the expected direction of change, and the minimum detectable effect. The MDE forces a useful product decision: what is the smallest improvement that would justify shipping and maintaining this change?

    Power considerations belong in planning, not in the explanation written after results arrive. If the eligible audience cannot produce a credible read on the effect that matters, change the experiment. You can target a higher-signal segment, test a stronger intervention, choose a more responsive leading indicator, or treat the release as a qualitative learning exercise rather than claiming a statistical win.

    Pre-commit to the decision rules as well. A positive primary metric with damaged guardrails should not become an automatic launch. A neutral result can still eliminate a weak theory. A surprising segment difference should become a new hypothesis, not an invitation to search repeatedly for a favorable slice of the data.

    This discipline changes backlog quality. Ideas compete on the strength of their evidence, the importance of the driver they address, and the clarity of the learning they can produce. The roadmap becomes a portfolio of testable growth mechanisms rather than a list of requested features.

    Use staged releases to separate learning from risk

    Feature flags let you control exposure without tying every decision to a new deployment. Start with internal validation, expose the change to an eligible cohort, watch technical and user guardrails, and widen access only when the evidence supports it.

    Keep three decisions distinct. The first is whether the change works as designed. The second is whether it improves the intended user behavior. The third is whether that behavior produces a lasting outcome. Passing the first decision does not answer the other two.

    Onboarding illustrates the difference. A clearer tooltip may increase interaction with a setup control. An in-app guide may increase completion of the setup flow. Neither result proves that users reached value or formed a durable habit. Follow the exposed cohort through the activation event and into retention before declaring the intervention successful.

    Small, reversible changes are especially useful here. Progressive disclosure, revised UX writing, a better default, or guidance at a predictable stall point can isolate a mechanism more clearly than a full onboarding redesign. When several elements change together, you may see movement without learning what caused it.

    Make the product trio accountable for learning

    Growth engineering is not an analytics team handing insights to a delivery team. Product, engineering, and design should jointly own the hypothesis, the intervention, the instrumentation, and the interpretation.

    Product connects the opportunity to the growth model and defines the decision. Design identifies the user friction and shapes the smallest credible intervention. Engineering validates event behavior, controls exposure, and protects reliability. All three inspect the outcome together.

    Close each experiment with a short decision record. Capture what you believed, what changed, which users were exposed, what happened to the primary metric and guardrails, what you decided, and which assumption changed. Record neutral and negative results as carefully as wins. Otherwise, old ideas return with new wording and consume another cycle.

    Leaders should review the quality of this learning system, not just the number of tests shipped. Notice whether teams are testing consequential hypotheses, whether events remain trustworthy, whether results lead to explicit decisions, and whether short-term activation gains are being checked against retention. Experiment volume without decision quality is another output metric.

    Key takeaways

    • Define the broken user behavior and the decision it affects before opening a dashboard.
    • Connect activation, depth, and frequency to your North Star through a driver tree.
    • Specify the hypothesis, primary metric, guardrails, MDE, and decision rules before implementation.
    • Use feature flags and staged exposure to manage risk while preserving a valid learning loop.
    • Validate leading indicators against retention, and store every result in a reusable decision record.

    Choose one important journey this week and trace it from first intent to retained value. If the events, ownership, or decision rules break anywhere along that path, fix that link before adding another growth experiment. Compounding growth begins with compounding clarity.

    References

  • Prompt Engineering for Amplitude Global Agent That Holds Up

    Prompt Engineering for Amplitude Global Agent That Holds Up

    You ask Amplitude Global Agent why activation fell. It returns a plausible explanation, but you still can’t tell which events it examined, whether the comparison was valid, or what your product team should do next.

    The fix is to treat the prompt as an analysis specification. Define the decision, provide the relevant analytics context, constrain unsupported conclusions, and make the agent show its work. You will get an answer that is easier to verify and more useful in a product review.

    Start with the decision, not a broad request for insights

    Requests such as “analyze activation” leave several decisions unresolved. The agent must guess what activation means, which users belong in the analysis, which period matters, and what kind of answer you expect. Even a polished response may answer the wrong question.

    Before writing the prompt, complete this sentence: “After reading the answer, we need to decide whether to…” Your ending might be “change the onboarding sequence,” “investigate a recent release,” or “prioritize one segment for discovery.” That decision gives the analysis a destination.

    Then assign a role that matches the work. “You are a product analyst investigating activation performance” is more useful than “You are a helpful assistant.” Add the audience as well. An executive needs the size and business relevance of a change; a product trio also needs the affected steps, segments, and follow-up questions.

    A strong opening contains three elements:

    • Role: the analytical perspective the agent should take.
    • Decision: what the team will choose or investigate after reading the result.
    • Success criteria: what the answer must establish before it is useful.

    For example: “You are a product analyst helping the onboarding team decide whether to redesign a weak activation step. Identify the largest meaningful drop-off, show which defined segment is most affected, and separate measured findings from possible explanations.”

    Give the agent a compact analytics contract

    The most reliable prompt names the data the agent may use. Include the relevant event names, property names, segment definitions, filters, and timeframe. If activation has an internal definition, write it out rather than relying on the agent to infer it.

    This is a retrieval-first approach: put authoritative definitions, dashboard context, and prior query logic into the request before asking for interpretation. Concrete grounding reduces room for invented assumptions and makes repeated analyses easier to compare. A structured prompt can also specify the role, business objective, allowed data, and output fields.

    Prompt elementWhat to provideWhat it prevents
    Metric definitionThe exact event sequence or outcome that countsA different interpretation of activation or retention
    PopulationIncluded users or accounts and explicit exclusionsComparisons across unlike populations
    SegmentsNamed properties and the values to compareArbitrary segmentation
    TimeframeThe analysis period and comparison periodHidden or inconsistent date choices
    Evidence boundaryThe events, properties, definitions, and dashboards allowedUnsupported claims presented as measured facts
    Output contractRequired sections, fields, ordering, and lengthA long narrative that cannot be reviewed quickly

    Do not dump every available definition into the context. Include only what the question requires. More context is useful when it resolves ambiguity; irrelevant context competes for attention and makes the prompt harder for a teammate to audit.

    Use a reusable prompt that exposes uncertainty

    You can adapt the following structure for activation, retention, anomaly investigation, or another behavioral analysis:

    1. Role and audience: “Act as a product analyst. Write for the product manager and analytics lead responsible for [area].”
    2. Decision: “Help us decide whether to [decision].”
    3. Question: “Determine [specific analytical question].”
    4. Definitions: “For this analysis, [metric] means [explicit event or outcome definition].”
    5. Data context: “Use these events: [names]. Use these properties: [names]. Compare these segments: [definitions]. Analyze [timeframe] against [comparison period]. Apply [filters and exclusions].”
    6. Constraints: “Use only the supplied Amplitude analytics events, properties, and definitions. Do not treat an unmeasured explanation as a finding.”
    7. Output: “Return the metric result, segment comparison, timeframe, evidence, interpretation, confidence or limitation, and recommended next check.”
    8. Fallback: “If the available data cannot answer the question, state what is missing and provide the smallest follow-up query needed.”

    The fallback matters. Without it, the agent has an incentive to complete the requested narrative even when the evidence is incomplete. A useful failure is specific: it identifies a missing event, undefined property, absent comparison, or ambiguous metric. Your team can fix that. A confident guess is harder to detect.

    Ask for measured findings, interpretations, and recommendations as separate fields. A measured drop-off is evidence. A claim that users were confused is an interpretation unless the supplied data establishes it. A recommendation to inspect session replay or conduct customer interviews is a next step, not proof of the cause. Keeping those layers separate makes the result safer to use in prioritization.

    Turn prompt quality into a small product evaluation

    Do not judge a prompt by whether one response sounds intelligent. Save the prompt version, input context, and output. Then test it against a question whose answer your team already knows. This gives you a reference point for accuracy before you use the template on an ambiguous problem.

    Score each version on three dimensions:

    • Accuracy: Did the answer use the supplied definitions, filters, segments, and timeframe correctly?
    • Clarity: Can a reviewer distinguish evidence, interpretation, limitations, and next steps?
    • Actionability: Does the result support the stated decision or name the next query required?

    Change one meaningful element at a time. You might compare a broad objective with a decision-specific objective, a narrative response with a fixed output contract, or an unrestricted answer with an explicit evidence boundary. Run the same test question through each variant. Otherwise, you will not know which change improved the result.

    Commit to two or three prompt iterations for one critical workflow. Review the failures, tighten the ambiguous instruction, and keep the better-performing version. Within a sprint, that process can produce a reusable template for a recurring analysis such as activation, retention, or anomaly detection.

    Store winning prompts with their required inputs and known limitations. A template without those notes becomes cargo cult: teammates copy the wording but omit the definitions that made it work. Treat the prompt, context requirements, evaluation question, and scoring criteria as one asset.

    Key takeaways

    • State the product decision before requesting analysis.
    • Define the metric, population, segments, filters, and timeframe explicitly.
    • Restrict conclusions to the analytics evidence you supplied.
    • Separate measured findings from interpretations and recommended actions.
    • Require a specific fallback when the data is insufficient.
    • Version and score prompts for accuracy, clarity, and actionability.

    Start with the recurring Amplitude question that currently creates the most debate. Write its decision, definitions, evidence boundary, and output contract. Run two or three scored iterations, then give the winning template to another product manager. If they can obtain a defensible answer without you translating the prompt, it is ready to become part of the team’s operating system.

    References

  • Beyond Accuracy: How I Evaluate AI Customer Service Agents That Delight and Scale

    When teams evaluate AI Agent options for customer service, I often see the rigor aimed at the wrong subset of criteria. After leading and observing dozens of proof of concept (POC) efforts with our customers and prospects, I understand why performance—accuracy scores, resolution rates, and benchmark tests on curated datasets—soaks up most of the attention. But those indicators alone won’t guarantee success once you leave the sandbox and face real customers.

    If your POC only proves that the AI “works,” you’re missing the bigger picture. Here’s what else I look for to make the best long-term decision.

    How does it handle your real-world setup?

    Performance is table stakes, but it has to reflect the messiness of an actual support environment. The best-performing Agents don’t just get answers right—they exhibit resilient, human-like behavior under pressure. I watch how the Agent behaves when it doesn’t know an answer: does it recover or spiral? Does it stay on track through multi-step requests, and how gracefully does it hand off to human agents? If your knowledge base depends on a retrieval-first pipeline, test cross-source retrieval and grounding—not just single-document lookups.

    When I build evaluation scenarios, I put the Agent through its paces with a broad, realistic mix:

    • Multi-turn queries that require the Agent to carry context across a conversation, not just answer isolated questions.
    • Vague or fragmented inputs, like typos, grammatical errors, and incomplete questions, because that’s how customers actually write.
    • Edge cases and sensitive scenarios, like billing disputes, frustrated customers, and questions that sit at the boundary of what the Agent is trained on.
    • Different phrasings of the same question. An Agent that handles one version well but fails on a rephrasing has a knowledge problem, not a performance problem.
    • Queries that require pulling from multiple knowledge sources. Real issues are rarely answered by a single help article, and an Agent that can only handle single-source questions will hit a ceiling fast.
    • Multilingual conversations, if your customer base requires it. Performance can vary significantly across languages and it’s better to discover that in testing than in production.

    This preparation is worth the effort. Any Agent can look impressive in a demo; what matters is how it holds up as part of your team, serving your customers in production.

    What does it feel like to interact with the Agent?

    Two AI Agents can post the same quantitative scores—resolution rates, containment rate, and more—and still deliver very different customer experiences. Resolution rate tells me whether the Agent finishes conversations; it says nothing about how customers felt during them. I deliberately assess the experience, not just the outcome, because conversation design shapes trust and brand perception.

    Here’s what I look for to ensure the AI Agent is enjoyable to interact with:

    • Is the tone natural and on-brand, or does it feel robotic and generic?
    • Does it build trust early in the conversation, or does it create friction that makes customers want to immediately request a human?
    • When it doesn’t know the answer, does it handle that gracefully?
    • When it hands off to a human, is that transition seamless, or does the customer feel abandoned?

    As George Dilthey at Clay put it when evaluating their AI setup: “Keep what’s important to your business up front and center. For us, that was transparency and control over the customer experience.”

    That framing is exactly right. The Agent represents your brand in every conversation. Customers don’t experience “accuracy,” they experience conversations. An Agent that’s technically accurate but tonally off-brand will erode customer trust over time.

    I make the experience dimension explicit in my POCs. I have people on my team—and when possible, a small cohort of real customers—interact with the Agent under realistic conditions. Then I ask how it felt, not just whether it worked.

    Can you keep improving it after launch?

    This is the dimension most teams don’t evaluate at all, and it’s possibly the most important one. Choosing an Agent that works today and ensures you can continuously improve the customer experience over time requires more than a functional demo. You’re buying a system that must get better every week, not just during the first sprint.

    The feedback loop

    Can your team easily review conversations and identify where the Agent is underperforming? Can you pinpoint specific gaps (missing knowledge, incorrect tone, poor handoff decisions) and act on them quickly? The faster the loop between “something isn’t working” and “we’ve fixed it,” the more value compounds over time. In practice, that means instrumenting conversations, leveraging Agent Analytics, tagging misroutes and tone slips, and running targeted evals on known failure modes.

    The speed of iteration

    When you identify a gap, how quickly can you address it? This is partly a question of tooling (how easy is it to update knowledge, refine guidance, adjust behavior?) and partly a question of team capability. The teams getting the most out of AI are the ones that have changed how they operate and made continuous improvement a part of their everyday work. They’ve committed to going all-in for the long term, not just the first few weeks when launching their AI Agent. We treat this as eval-driven development: automate evaluations that mirror real tickets, tighten prompt engineering and retrieval settings, and ship small fixes daily.

    The vendor partnership

    The vendor behind the Agent matters just as much as the solution itself. You’re choosing a partner for transformation that will help you evolve how your business delivers customer experience. Ask:

    • How does customer feedback influence the product roadmap, and can they show you examples?
    • If you have feedback on limitations or weaknesses, do they engage transparently or get defensive?
    • What kind of support will you get post-launch?
    • Are they shaping where AI customer experience is going, or reacting to what others are building?

    How a vendor responds to those questions tells you more about the long-term relationship than any benchmark result.

    What a good POC proves

    If your POC only proves “the AI works,” you haven’t done enough. A strong proof of concept tests performance in realistic conditions, evaluates the experience from the customer’s perspective, and validates the system that will support continuous improvement after launch. Done well, it sets you up for long-term operational success and builds organizational AI readiness—not just a flashy demo.


    Inspired by this post on The Intercom Blog.


    Book a consult png image
  • Product Analytics for Retention: A Practical Operating System

    Product Analytics for Retention: A Practical Operating System

    You have a retention chart and a familiar problem: the curve is falling, the segments disagree, and every team has a different explanation. Another dashboard will not tell you what to build.

    You need a decision loop that connects retained value to observable behavior. Define the outcome, instrument the journey, locate the behavioral gap, and test the smallest change that could close it. That turns retention analytics into a product operating system rather than a monthly reporting exercise.

    Start with a retention contract, not a dashboard

    Before opening your analytics tool, finish this sentence: “For users who first do [starting action], retention means completing [valuable action] again within [return window].” If your team cannot agree on the blanks, it is not ready to interpret a retention curve.

    The starting action should identify a meaningful cohort. Account creation is often too weak because it combines curious visitors, evaluators, invited teammates, and serious users. Prefer the moment a person begins the journey you intend to improve, such as creating a project, starting an agent, or completing an initial workflow.

    The return action must represent delivered value, not convenient activity. Opening the app, viewing a page, or receiving a notification may be easy to count but weakly connected to the reason someone adopted the product. Choose an action that would make a customer notice if the product disappeared.

    Set the return window around the product’s natural use cycle. A daily workflow and an occasional administrative task should not share the same definition. Document the window, the qualifying action, the excluded users, and whether retention is measured at the user or account level. This is your retention contract.

    Next, build a driver tree connecting the retention outcome to measurable inputs. Put retained value at the top. Beneath it, map activation, repeated value-producing behavior, and the friction that can interrupt either one. This separates the lagging outcome you care about from leading signals a team can move sooner.

    For every leading signal, add a guardrail. If a change increases sessions but reduces task completion, it has created activity rather than value. If it improves first-session completion but does not affect return behavior, treat it as an onboarding improvement until the retention evidence catches up.

    Instrument the journey so the data can survive a decision

    Retention analysis breaks when event names mirror the interface instead of the customer’s progress. A click on “Continue” becomes meaningless after the button moves. An event such as workflow_started or task_completed remains interpretable across interface changes.

    For each critical event, record enough context to reconstruct what happened:

    • The user and, for collaborative products, the account.
    • The channel, surface, or entry point that started the journey.
    • The use case or object involved.
    • The event timestamp and relevant status.
    • The experiment assignment, when the experience is being tested.
    • The event version when its meaning or properties change.

    Give every retention-critical event a plain-language definition and an owner. The definition should state when the event fires, when it must not fire, which properties are required, and how duplicate or failed actions are handled. Keep cohort definitions centralized for the same reason. Product, marketing, and customer success cannot compare decisions if each team silently defines “activated” or “retained” differently.

    Validate the journey before trusting the curve. Trace real test accounts from the starting action through the value event and return action. Compare the interface state, raw events, and resulting cohort membership. Check identity transitions such as anonymous-to-signed-in usage, invitations, account switching, and merged profiles. A polished retention chart built on broken identity resolution is still broken.

    Treat the taxonomy like a product surface. Changes need review, backward compatibility, documentation, and monitoring. This work feels slower than building a dashboard, but it prevents teams from spending an entire planning cycle acting on instrumentation defects.

    Diagnose the behavioral gap before proposing a feature

    A retention curve tells you where return behavior weakens. It does not explain why. Use a fixed analysis sequence so the team does not jump from an interesting segment to a preferred solution.

    1. Inspect the curve shape. An early drop points you toward expectation-setting, onboarding, or initial value. A later decline points you toward repeat value, changing needs, or workflow friction.
    2. Segment with a hypothesis. Compare acquisition source, device, channel, use case, or customer type only when you can explain why that dimension might change the experience.
    3. Compare retained and non-retained cohorts. Look for behaviors that differ in sequence, completion, or repetition, not merely events with high volume.
    4. Build a funnel around the strongest candidate behavior. Find the step where the cohorts separate and inspect how users arrive there.
    5. Review session replay, conversation transcripts, or journey detail at that step. Look for hesitation, repeated attempts, unclear choices, missing context, and premature exits.

    This sequence moves you from outcome to segment, behavior, moment, and observable friction. Stop if the evidence cannot support that chain. A behavior that correlates with retention is a place to investigate, not proof that forcing the behavior will retain users.

    AI products make this distinction especially important. A generic greeting may produce a response without moving the user toward a task. If people hesitate, test a concise follow-up that clarifies the agent’s scope, offers two or three concrete choices, and still accepts free-form input. Measure the chain from continuation to task start, task completion, and return across the first three to five sessions. Do not optimize for extra conversation turns if users remain stuck.

    Pair behavioral evidence with continuous discovery. Analytics identifies the moment worth investigating; interviews and direct observation help explain the need, expectation, or constraint behind it. That combination produces a testable problem statement instead of a feature request decorated with data.

    Turn retention signals into controlled product bets

    Write the opportunity before discussing solutions: “When [cohort] reaches [moment], [observable friction] prevents [valuable behavior], which is associated with lower [retention outcome].” The wording forces you to name the user, the moment, the evidence, and the outcome without pretending you have already established causality.

    Then create an experiment card with:

    • A hypothesis linking the proposed change to a specific behavior.
    • The eligible cohort and trigger moment.
    • One primary retention outcome.
    • A leading indicator that can move earlier.
    • Guardrails for completion quality, errors, or unintended friction.
    • The minimum detectable effect and planned evaluation window.
    • A decision rule for stopping, iterating, rolling out, or reversing the change.

    Choose a change small enough to isolate the mechanism. If the suspected problem is uncertainty at the start of an AI interaction, test the opening sequence rather than redesigning the agent, onboarding flow, and navigation together. A smaller bet makes the result easier to interpret and cheaper to reverse.

    Review experiments on a regular product cadence. Begin with data quality, then evaluate the leading indicator, guardrails, and retention outcome in that order. Inspect the segments named in the original hypothesis rather than searching every possible cut for a favorable result. Record what the team decided, why it decided it, and what evidence would change the decision.

    Your roadmap should name the retention outcome and the behavioral driver, not promise a feature prematurely. “Increase repeat task completion for newly activated accounts” leaves room to test messaging, workflow design, defaults, or assistance. “Build a new onboarding wizard” locks the team into an answer before it has earned confidence in the problem.

    Key takeaways

    • Define retention as a cohort, a value-producing action, and a return window before interpreting any chart.
    • Use a driver tree to connect the lagging retention outcome to behaviors a product team can influence.
    • Standardize event and cohort definitions, then validate identity and journey data with real test accounts.
    • Move from curve to segment, behavior, moment, and friction before proposing a solution.
    • Use controlled, reversible experiments to distinguish a useful behavioral signal from a causal retention lever.

    Start with one journey that matters this week. Write its retention contract, trace the events, and identify the first point where retained and non-retained users behave differently. That single decision-ready path is more valuable than a broad analytics program nobody trusts.

    References

  • Supercharge Core Web Vitals with Amplitude’s Global Agent: Faster Rankings, Happier Users

    Supercharge Core Web Vitals with Amplitude’s Global Agent: Faster Rankings, Happier Users

    I measure product health by a simple equation: speed plus clarity equals trust. That’s why I prioritize Core Web Vitals and search performance together—because the fastest path to better UX and higher rankings is a closed loop between measurement, diagnosis, and action. Standardizing on Amplitude’s Global Agent with Amplitude AI Agents let my teams compress that loop from weeks to hours, and in many cases, to minutes.

    Learn how to track your web vitals and page rankings faster with Amplitude AI Agents and improve your site’s user experience and SEO rankings. That goal sounds ambitious, but with the right instrumentation and analytics workflow, it becomes a repeatable operating rhythm rather than a one-off project.

    Here’s what changed for us with Amplitude’s Global Agent: a single, consistent way to capture performance signals across pages and journeys, unified context for every session, and a lightweight footprint that doesn’t get in the way of speed. By centralizing measurement, we eliminated blind spots and gave product, growth, and engineering one shared truth for Core Web Vitals and behavioral analytics.

    My practical playbook is straightforward: 1) Establish a performance baseline for Core Web Vitals on key templates and critical user paths. 2) Segment results by device, location, acquisition channel, and content type to surface where users actually feel the friction. 3) Connect those vitals to downstream behaviors—scroll depth, engagement, and conversion—so we prioritize fixes that move business outcomes, not just lab scores. 4) Use feature flags and A/B testing to ship improvements safely and quantify uplift. 5) Close the loop with Agent Analytics to keep learnings visible and actionable.

    Operationally, we rely on anomaly detection to flag regressions early, CI/CD guardrails to prevent performance slips at deploy time, and observability plus session replay to accelerate root-cause analysis. This combination reduces mean time to resolution, protects page experience during fast iteration cycles, and helps us avoid trading UX for speed—or vice versa.

    The strategic benefit is compounding: better Core Web Vitals improve user perception and increase engagement, which strengthens SEO signals and, ultimately, page rankings. With a unified analytics platform in place, we can spotlight the few improvements that create outsized gains, then scale those patterns across the site with confidence.

    If your roadmap includes faster pages, stronger rankings, and happier users, align your teams around this simple loop: measure precisely, diagnose quickly, experiment safely, and learn continuously. Amplitude’s Global Agent and Amplitude AI Agents give you the instrumentation and insight to make that loop your competitive advantage.


    Inspired by this post on Amplitude – Best Practices.


    Book a consult png image